WisDM Organization Metrics
Overview
Metrics Dashboards allow you to create custom monitoring views in WisDM for gateway operation and network performance analysis. You can organize dashboards by project, add widgets, and visualize available gateway metrics such as gateway status, system resource usage, network connectivity, LoRaWAN packet statistics, and other operational data.
Instead of checking each gateway individually or relying on external monitoring tools for basic metric visualization, you can build dashboards based on your projects, locations, or troubleshooting needs. This helps you monitor gateway performance, identify abnormal behavior, and understand the operating status of your deployment more efficiently.
Key Capabilities
With Metrics Dashboards, you can:
- Create custom dashboards for different projects, sites, or monitoring needs.
- Add widgets to visualize gateway metrics as single values, charts, or tables.
- Select available metrics and configure how they are calculated and displayed.
- Monitor gateway status, system resource usage, network connectivity, and LoRaWAN packet statistics.
- Filter data by location, gateway, or firmware version.
- Organize widgets to build dashboard views that match your operation or troubleshooting workflow.
Why Use Metrics Dashboards
- Centralized Monitoring: View key gateway metrics in one dashboard.
- Faster Troubleshooting: Compare system, network, and LoRaWAN metrics to identify issues.
- Less Manual Checking: Reduce the need to open each gateway page individually.
- Better Operational Visibility: Understand gateway health and deployment status more clearly.
- Native WisDM Experience: Monitor metrics directly in WisDM without switching tools.
Before You Start
Before creating a Metrics Dashboard, review the basic structure of Metrics Dashboards and make sure your role has the required access permissions.
Core Concepts
The following concepts help you understand how Metrics Dashboards are organized in WisDM.
| Concept | Description |
|---|---|
| Project | A workspace used to group related dashboards. A project can represent a site, customer deployment, or monitoring scenario, such as Apartment 1, Factory A, or Warehouse Site. |
| Dashboard | A monitoring view within a project. It is used to display a group of widgets for a specific purpose, such as gateway status monitoring, resource monitoring, or LoRaWAN packet analysis. |
| Widget | A visual card added to a dashboard. A widget can display metric data as a single value, chart, or table. |
| Metric | A specific data point that can be visualized in a widget, such as CPU usage, memory usage, gateway online status, or uplink packet count. |
In general, a project contains one or more dashboards, a dashboard contains one or more widgets, and each widget displays one or more selected metrics.
Role and Permissions
Available actions in Metrics Dashboards depend on your role in the organization. In general:
| Role | Metrics Dashboard Access |
|---|---|
| Organization Admin | Can view, create, edit, copy, and delete projects, dashboards, and widgets within the organization. |
| Organization Supervisor | Can view projects, dashboards, and widgets within the organization. Editing actions are not available. |
| Location Admin | Can create and edit projects, and can view, create, edit, copy, and delete accessible dashboards and widgets when all data displayed in them belongs to the user’s assigned locations. |
| Location Supervisor | Can view accessible projects, dashboards, and widgets when all data displayed in them belongs to the user’s assigned locations. Editing actions are not available. |
Create Your First Metrics Project
This quick start walks you through the basic workflow of creating your first Metrics Dashboard in WisDM. In this example, you will create a Gateway Status Dashboard to display the number of online gateways in a selected location.
After completing this section, you will have a basic dashboard that can display gateway online status data.
Example: Gateway Status Dashboard
| Item | Example Value |
|---|---|
| Project name | Apartment 1 |
| Dashboard name | Gateway Status Overview |
| Widget type | Single value |
| Widget name | Gateway Online |
| Type | System |
| Metric | Gateway Online |
| Operation | SUM |
| Filter label | Location = Apartment 1 |
Step 1: Create a Project
Create a project to group dashboards for the same site, customer, or monitoring scenario.
-
Go to Dashboard from the left navigation bar.
-
Click + Create Project.
-
Enter the project name, for example:
Apartment 1 -
Click Save.
The project appears as a project tab on the Dashboard page. For more details, see Create a New Project.
Step 2: Create a Dashboard
Create a dashboard under the project to organize widgets for gateway monitoring.
-
Open the project you created.
-
Click + Create dashboard.
-
Enter the dashboard name, for example:
Gateway Status Overview -
Optionally, enter a dashboard description.
-
Click Save.
The dashboard appears under the selected project. For more details, see Create a New Dashboard.
Step 3: Add a Widget
Add a widget to display the gateway status metric.
- Open the dashboard you created.
- Click + Add widget.
- Select + Create new.
- Configure the widget details:
- Widget type: Select
Single value. - Widget name: Enter
Gateway Online. - Description: Optional.
- Widget type: Select
For more widget configuration options, see Add a New Widget.
Step 4: Configure Metrics
In the Metrics to display section, configure the metric that the widget will show.
Use the following example settings:
| Parameter | Example Value |
|---|---|
| Metric name | Gateway Online |
| Type | System |
| Metric | Gateway Online |
| Operation | SUM |
| Filter label | Location = Apartment 1 |
The SUM operation calculates the total number of online gateway records that match the selected filter and dashboard time range.
Step 5: Retrieve and Save Metrics
- Click Retrieve metrics to preview the metric result.
- Check whether the returned data matches your expected gateway status.
- If the result is correct, click Add widget to save the widget.
After the widget is saved, it appears on the dashboard.
Project
A project is used to group related dashboards together. You can create a project for a specific customer, site, deployment area, or use case. For example, you can create projects such as Apartment 1, Factory A, Warehouse Site, or City Deployment.
After creating a project, you can add one or more dashboards under it and configure widgets to monitor gateway metrics.
Create a New Project
-
Go to Dashboard from the left navigation bar.
-
Start creating a project.
- If no project exists, click + Create Project.
- If projects already exist, click the + button in the project tab area, and then select Create new project.
-
On the Create project page, enter the project name.
- Project name: Required. 1–50 characters. Letters, numbers, and special characters are allowed.
Example:
Apartment 1 -
Click Save.
After the project is created, it appears as a project tab on the Dashboard page. You can then create dashboards under this project.
Copy an Existing Project
You can create a project by copying an existing project. This helps you reuse an existing dashboard structure instead of creating dashboards and widgets from the beginning.
When a project is copied, the copied project includes the dashboards in the original project and their widget configurations, such as widget types, metric settings, filter labels, and layout.
The copied project uses the same dashboard and widget configuration as the original project. After copying, update the project name, dashboard names, widget names, and filters as needed.
Duplicate a Specific Project
Use Duplicate project when you want to quickly copy a specific project from project tab area.
- Locate the project you want to copy.
- Click the action menu next to the project name.
- Select Duplicate project.
- The system creates a copy of the selected project in the current organization.
Make a Copy of Existing Projects
Use Make a copy of existing when you want to select one or more accessible projects and copy them.
-
Go to Dashboard from the left navigation bar.
-
Click the + button in the project tab area.
-
Select Make a copy of existing.
-
In the Select a project to create a copy dialog, select one or more projects.
-
Select the checkbox next to each project you want to copy.
-
Click Create.
The selected project or projects are copied into the current organization.
Manage Projects
Edit a Project
Use Edit project to update the project name.
- Go to Dashboard from the left navigation bar.
- Locate the project you want to edit.
- Click the action menu next to the project name.
- Select Edit project.
- Update the project name.
- Click Save.
After saving, the updated project name is displayed in the project tab area.
Delete a Project
Use Delete project to remove a project that is no longer needed.
- Go to Dashboard from the left navigation bar.
- Locate the project you want to delete.
- Click the action menu next to the project name.
- Select Delete project.
- In the confirmation dialog, review the warning message.
- Click Delete to confirm.
The project is deleted and removed from the project tab area.
Dashboard
A dashboard is created under a project and is used to organize widgets for a specific monitoring purpose. For example, you can create dashboards for gateway status monitoring, resource usage monitoring, LoRaWAN packet statistics, or cellular connectivity analysis. Each project can contain one or more dashboards.
Create a New Dashboard
Use Create dashboard to add a new dashboard under the selected project.
- Go to Dashboard from the left navigation bar.
- Open the project where you want to create a dashboard.
- Start creating a dashboard.
- If no dashboard exists under the selected project, click + Create dashboard.
- If dashboards already exist under the selected project, click the + button in the dashboard tab area, and then select Create new dashboard.
- On the Create dashboard page, enter the dashboard information.
- Dashboard name: Required. 1–100 characters. Letters, numbers, and special characters are allowed.
- Description: Optional. Up to 500 characters. Letters, numbers, and special characters are allowed.
- Click Save.
After the dashboard is created, it appears as a dashboard tab under the selected project. You can then set the dashboard time range or add widgets to start visualizing metrics.
Copy an Existing Dashboard
You can create a dashboard by copying an existing dashboard. This helps you reuse an existing dashboard structure, including widgets, metric settings, filters, and layout.
Duplicate a Specific Dashboard
Use Duplicate dashboard when you want to quickly copy a specific dashboard.
-
Open the project that contains the dashboard.
-
Locate the dashboard you want to copy.
-
Open the dashboard action menu. You can do this from the dashboard list by clicking the action menu next to the dashboard name, or from inside the dashboard by clicking the action menu next to + Add widget.
-
Select Duplicate dashboard.
The system creates a copy of the selected dashboard under the current project.
Make a Copy of Existing Dashboards
Use Make a copy of existing when you want to select one or more existing dashboards and copy them into the current project.
-
Open the project where you want to copy dashboards.
-
Click the + button in the dashboard tab area.
-
Select Make a copy of existing.
-
In the Select a dashboard create a copy dialog, select one or more dashboards.
-
Select the checkbox next to each dashboard you want to copy.
-
Click Create.
The selected dashboard or dashboards are copied into the current project with all existing widgets.
Set the Dashboard Time Range
The dashboard time range defines the time period used to retrieve and display metric data. The selected time range applies to all widgets on the current dashboard.
For example, if you select 7 days, all widgets on the dashboard display data from the last 7 days.
-
Open the project that contains the dashboard.
-
Open the dashboard you want to view or update.
-
Click the time range dropdown.
-
Select one of the available time options. Available options may include:
24 hours: Data from now back to the last 24 hours7 days: Data from now back to the last 7 days30 days: Data from now back to the last 30 days90 days: Data from now back to the last 90 daysCustom: Defines a specific start date/time and end date/time for the dashboard. The selected range must be within the data retention period of your subscription, and the start time cannot be later than the end time.
Available time range options depend on the subscription type.
Subscription Type Available Time Range Options Maximum Data Retention Community 24 hours, 7 days, Custom 7 days Standard 24 hours, 7 days, 30 days, Custom 30 days Professional 24 hours, 7 days, 30 days, Custom 30 days Enterprise 24 hours, 7 days, 30 days, 90 days, Custom 90 days On demand 24 hours, 7 days, 30 days, 90 days, Custom 90 days
After the time range is updated, all widgets on the current dashboard are refreshed based on the selected time period.
Filter by Gateway Serial Number
The gateway serial number filter allows you to display dashboard data for specific gateways. The selected gateway serial number filter applies to all widgets on the current dashboard. By default, all gateway serial numbers are selected.
-
Open the project that contains the dashboard.
-
Open the dashboard you want to view or update.
-
Click the Select serial number dropdown.
-
Select one or more gateway serial numbers from the list. You can also type in the search field to quickly find matching gateway serial numbers.
-
Click Done to apply the filter.
After the filter is applied, all widgets on the current dashboard are refreshed based on the selected gateway serial number or gateway set.
Manage Dashboards
After creating a dashboard, you can edit its basic information, delete it if it is no longer needed, or adjust the layout of its widgets.
Edit a Dashboard
Use Edit dashboard to update the dashboard name or description.
-
Open the project that contains the dashboard.
-
Locate the dashboard you want to edit.
-
Click the action menu next to the dashboard name or the + Add widget button.
-
Select Edit dashboard.
-
Update the dashboard information.
- Dashboard name: Required. 1–100 characters. Letters, numbers, and special characters are allowed.
- Description: Optional. Up to 500 characters. Letters, numbers, and special characters are allowed.
-
Click Save.
After saving, the updated dashboard name or description is displayed in the project.
Manage Widget Layout
Use Edit layout to adjust the position and size of widgets on the current dashboard.
-
Open the dashboard you want to adjust.
-
Click the action menu next to the + Add widget button.
-
Select Edit layout.
-
Adjust the widgets as needed. You can:
- Drag widgets to change their position.
- Resize widgets to change how much space they use.
-
Click Save.
After saving, the updated layout is shown to users who have access to the dashboard.
Delete a Dashboard
Use Delete to remove a dashboard that is no longer needed.
Deleting a dashboard cannot be undone. Make sure the dashboard is no longer needed before confirming the deletion.
-
Open the project that contains the dashboard.
-
Locate the dashboard you want to delete.
-
Click the action menu next to the dashboard name or the + Add widget button.
-
Select Delete.
-
In the confirmation dialog, review the warning message.
-
Click Delete to confirm.
After deletion, the dashboard is removed from the current project.
Widget
A widget is a visual component on a dashboard. It displays one or more selected metrics using a specific visualization type, such as a single value, chart, or table.
Add a New Widget
Use Add widget to create a new widget on the current dashboard.
- Open the project that contains the dashboard.
- Open the dashboard where you want to add a widget.
- Click + Add widget and select + Create new.
- On the Add widget page, configure the widget details.
- Widget type: Select how the metric data is displayed. For details, see Widget Types.
- Widget name: Required. Enter the name displayed at the top of the widget. Length: 1–100 characters.
- Description: Optional. Enter a short description. Length: up to 500 characters.
- Display legend: Enable this option to show the metric legend in the widget. This is useful when the widget contains multiple metrics.
- Display threshold: Enable this option to show a threshold reference in the widget.
- Threshold value: Required only when Display threshold is enabled. Enter an integer value using digits
0–9.
- In the Metrics to display section, configure the metric information.
- Color: Select the color used to display the metric in the widget. This option is available for chart widgets.
- Metric name: Required. Enter the display name of the metric in the widget. Length: 1–100 characters.
- Type: Select the metric group. For details, see Available Metrics.
- Metric: Select the specific metric to display. For details, see Available Metrics.
- Operation: Select how the metric value is calculated. For details, see Supported Operations.
- Configure filter labels if needed.
- Select a filter label, such as
Location,Gateway serial number, orFirmware version. - Select an operator:
=: Includes data that matches the selected value.!=: Excludes data that matches the selected value.
- Select one or more values.
 : Click this button to add another filter condition.
AND: Available when multiple filter conditions are added. The metric data must match all conditions.OR: Available when multiple filter conditions are added. The metric data can match any of the conditions. : Click this button to delete the selected filter condition. This button is available only when more than one filter condition exists.
- Select a filter label, such as
- (Optional) For chart widgets, click + Add metric to add multiple metrics to the same widget. Configure the metric name, color, type, metric, operation, and filter labels for each added metric.
- : Click this button to delete the selected metric section. This button is available only when more than one metric section exists.
- Click Retrieve metrics to preview the result.
- Click Add widget to save the widget.
After the widget is added, it appears on the current dashboard.
Copy an Existing Widget
You can create a widget by copying an existing widget. This helps you reuse an existing widget configuration, including widget type, metric settings, operation, filter labels, and display settings.
Duplicate a Specific Widget
Use Duplicate widget when you want to quickly copy a specific widget on the current dashboard.
- Open the project that contains the dashboard.
- Open the dashboard that contains the widget you want to copy.
- Locate the widget you want to duplicate.
- Click the action menu on the widget.
- Select Duplicate widget.
The system creates a copy of the selected widget on the current dashboard.
Make a Copy of Existing Widgets
Use Make a copy of existing when you want to add a widget by reusing an existing widget configuration.
-
Open the project that contains the dashboard.
-
Open the dashboard where you want to add the widget.
-
Click + Add widget.
-
Select Make a copy of existing.
-
In the Select a widget to create a copy dialog, select one or more widgets.
-
Select the checkbox next to each widget you want to copy.
-
Click Create.
The copied widget is added to the current dashboard with the same configuration as the original widget. After copying, review and update the widget settings as needed.
Widget Types
WisDM supports different widget types for different visualization needs. Select a widget type based on the metric you want to monitor and how you want users to read the data.
| Widget Type | Best Used For |
|---|---|
| Single value | Showing one key value. |
| Line chart | Showing metric trends over time. |
| Bar chart | Comparing values over time. |
| Stacked bar chart | Comparing multiple related metrics as parts of a total. |
| Area chart | Showing trends with volume changes over time. |
| Pie chart | Showing percentage distribution. |
| Table | Showing metric values by gateway. |
Single value
Use a Single value widget to show one important value clearly. This widget is useful for key status indicators that users need to check quickly.
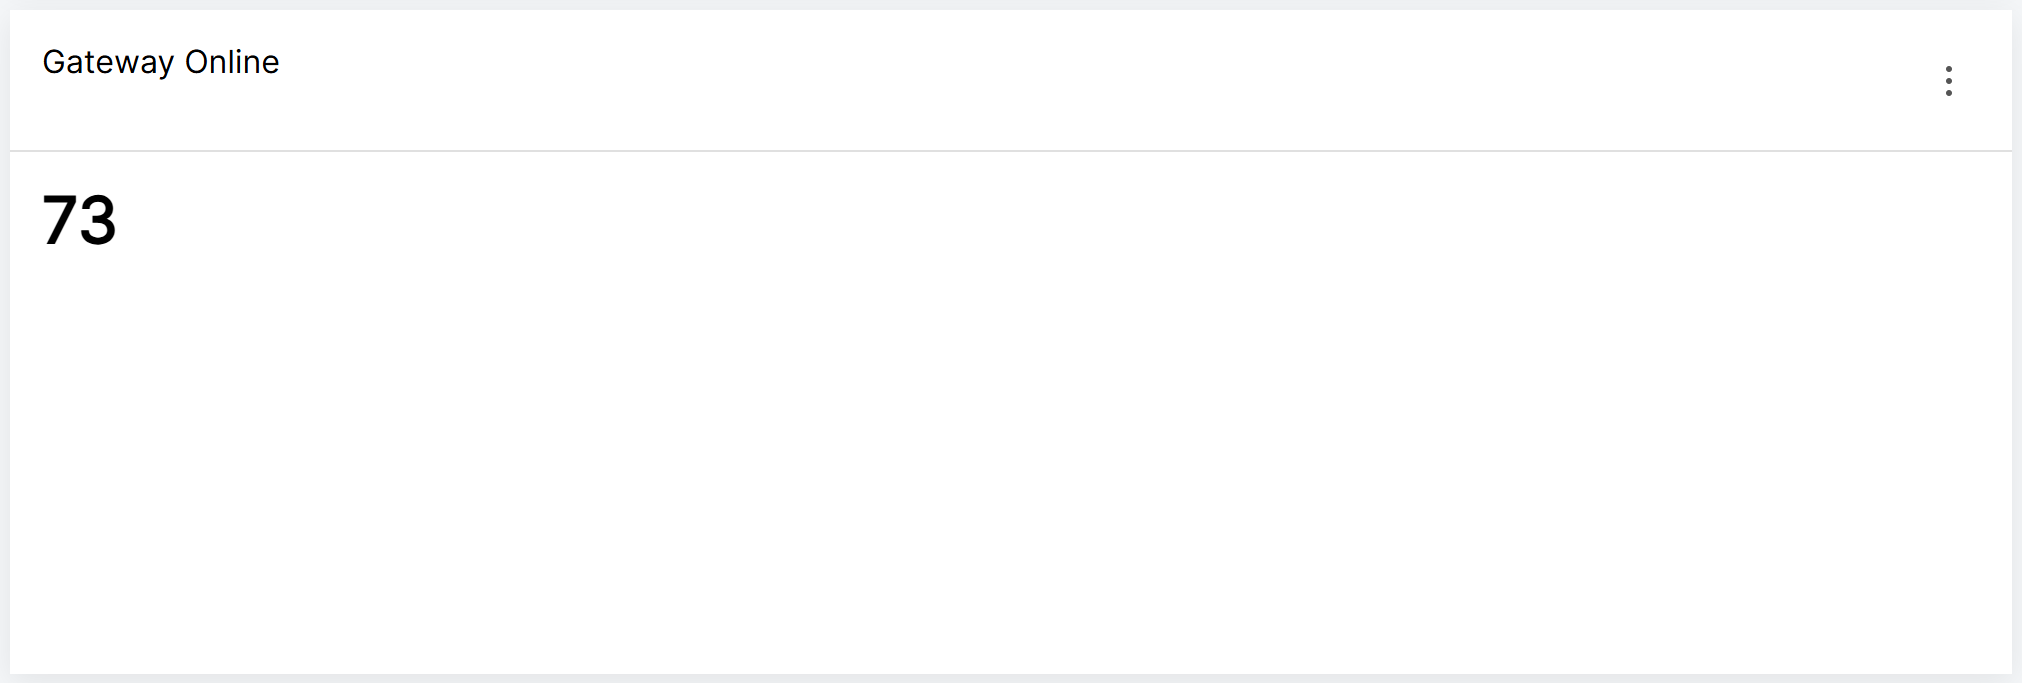 Figure 1: Single Value Widget
Line Chart
Use a Line chart to show how a metric changes over time. It is best for trend analysis.
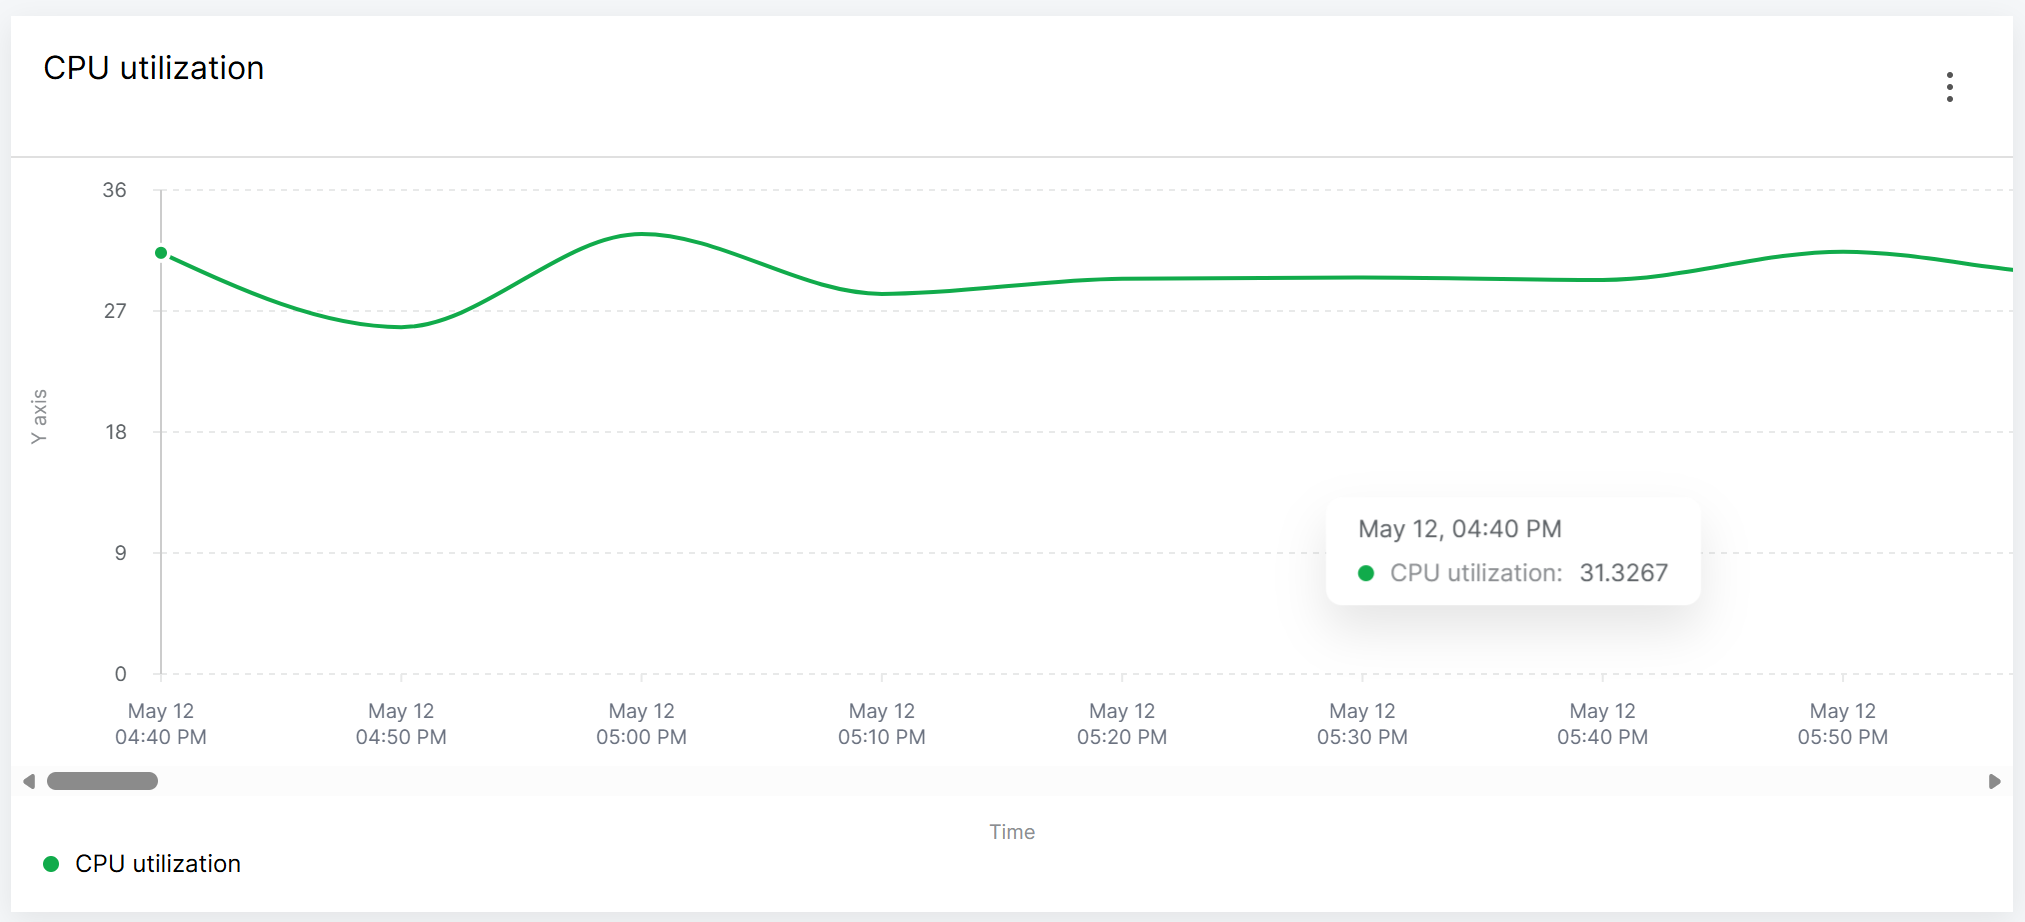 Figure 1: Line Chart Widget
Bar Chart
Use a Bar chart to compare metric values across time intervals. It is useful when users need to compare values clearly.
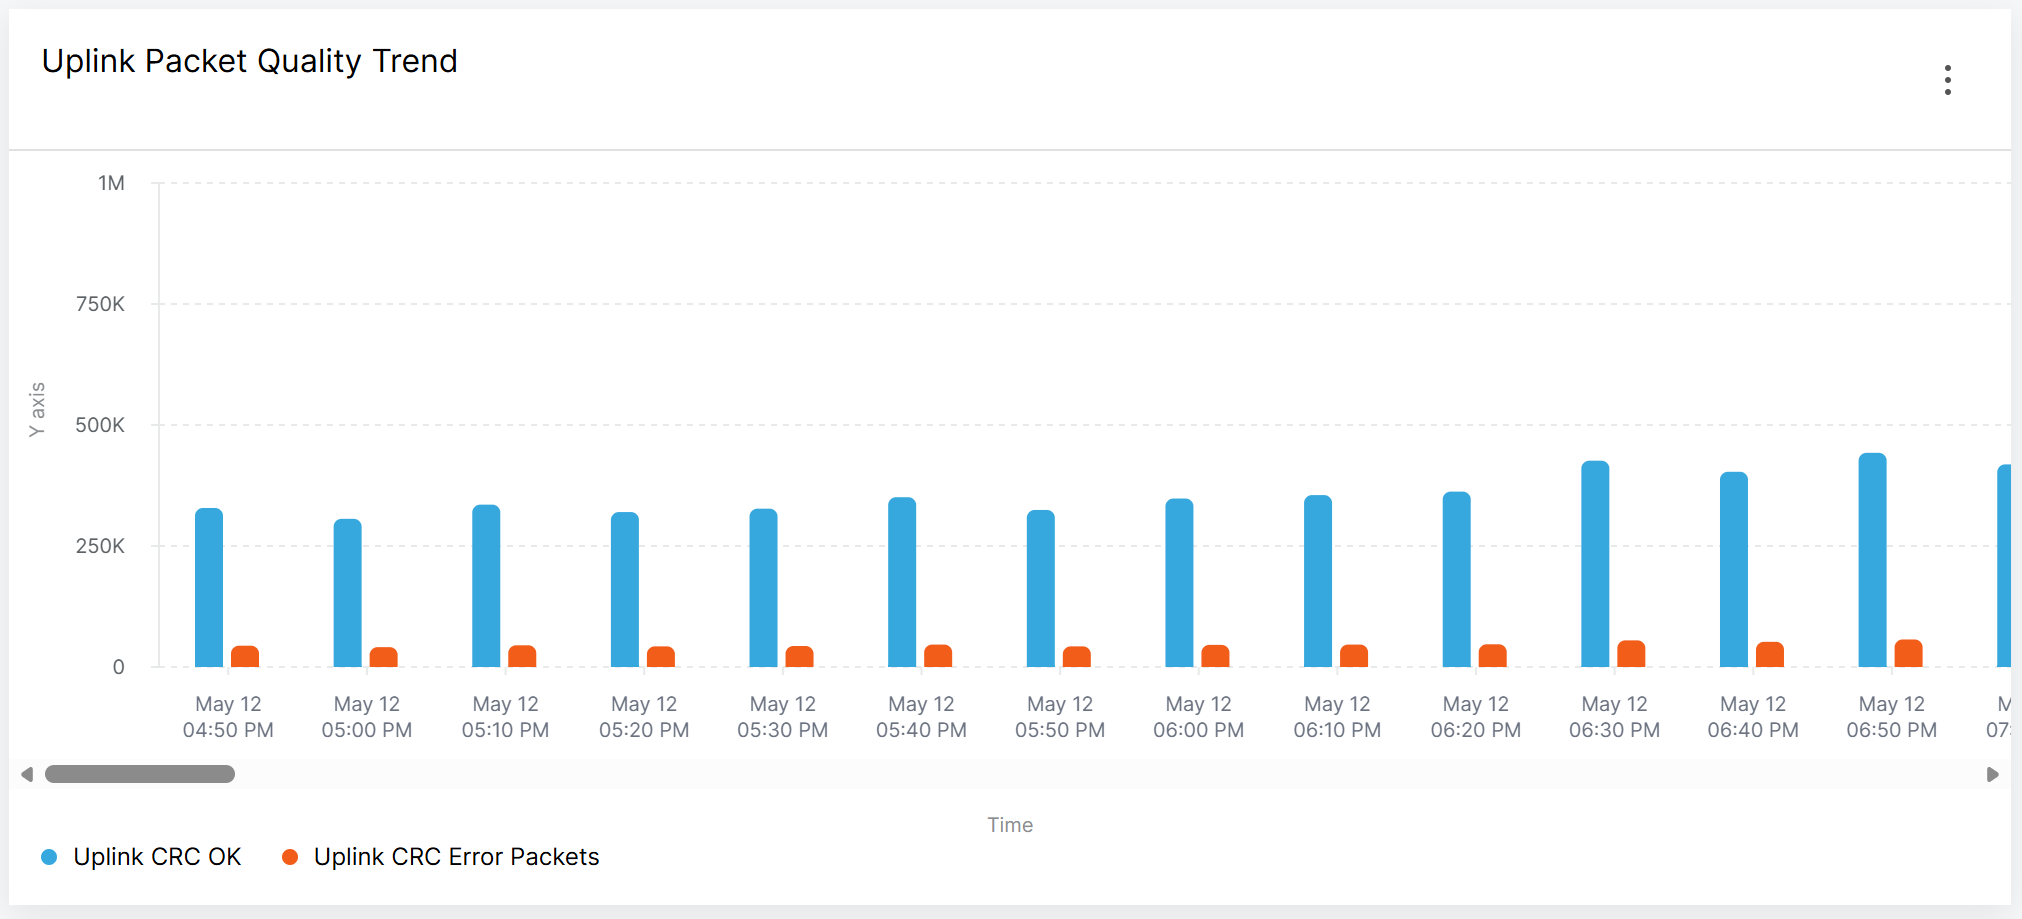 Figure 1: Bar Chart Widget
Stacked Bar Chart
Use a Stacked bar chart to compare multiple related metrics as parts of a total. It is useful when users need to understand both total volume and distribution.
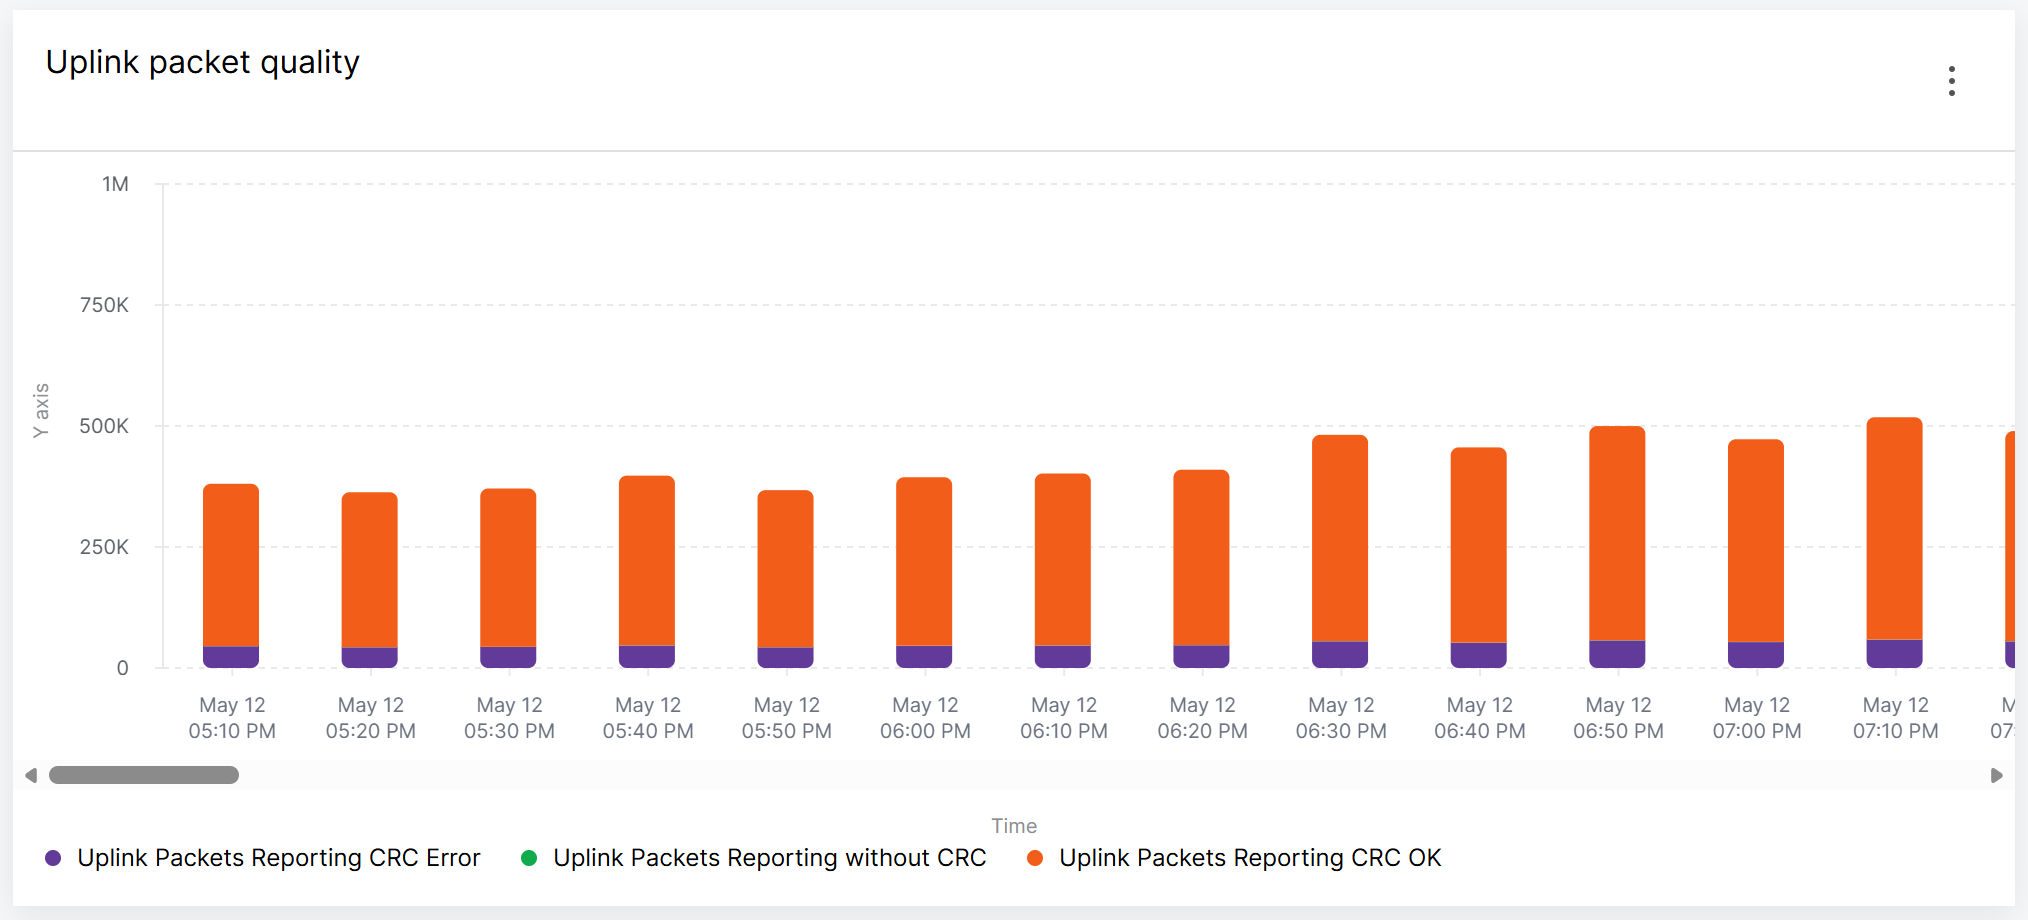 Figure 1: Stacked Bar Chart Widget
Area Chart
Use an Area chart to show trends while emphasizing the volume or magnitude of changes. It is useful for resource usage and traffic-related metrics.
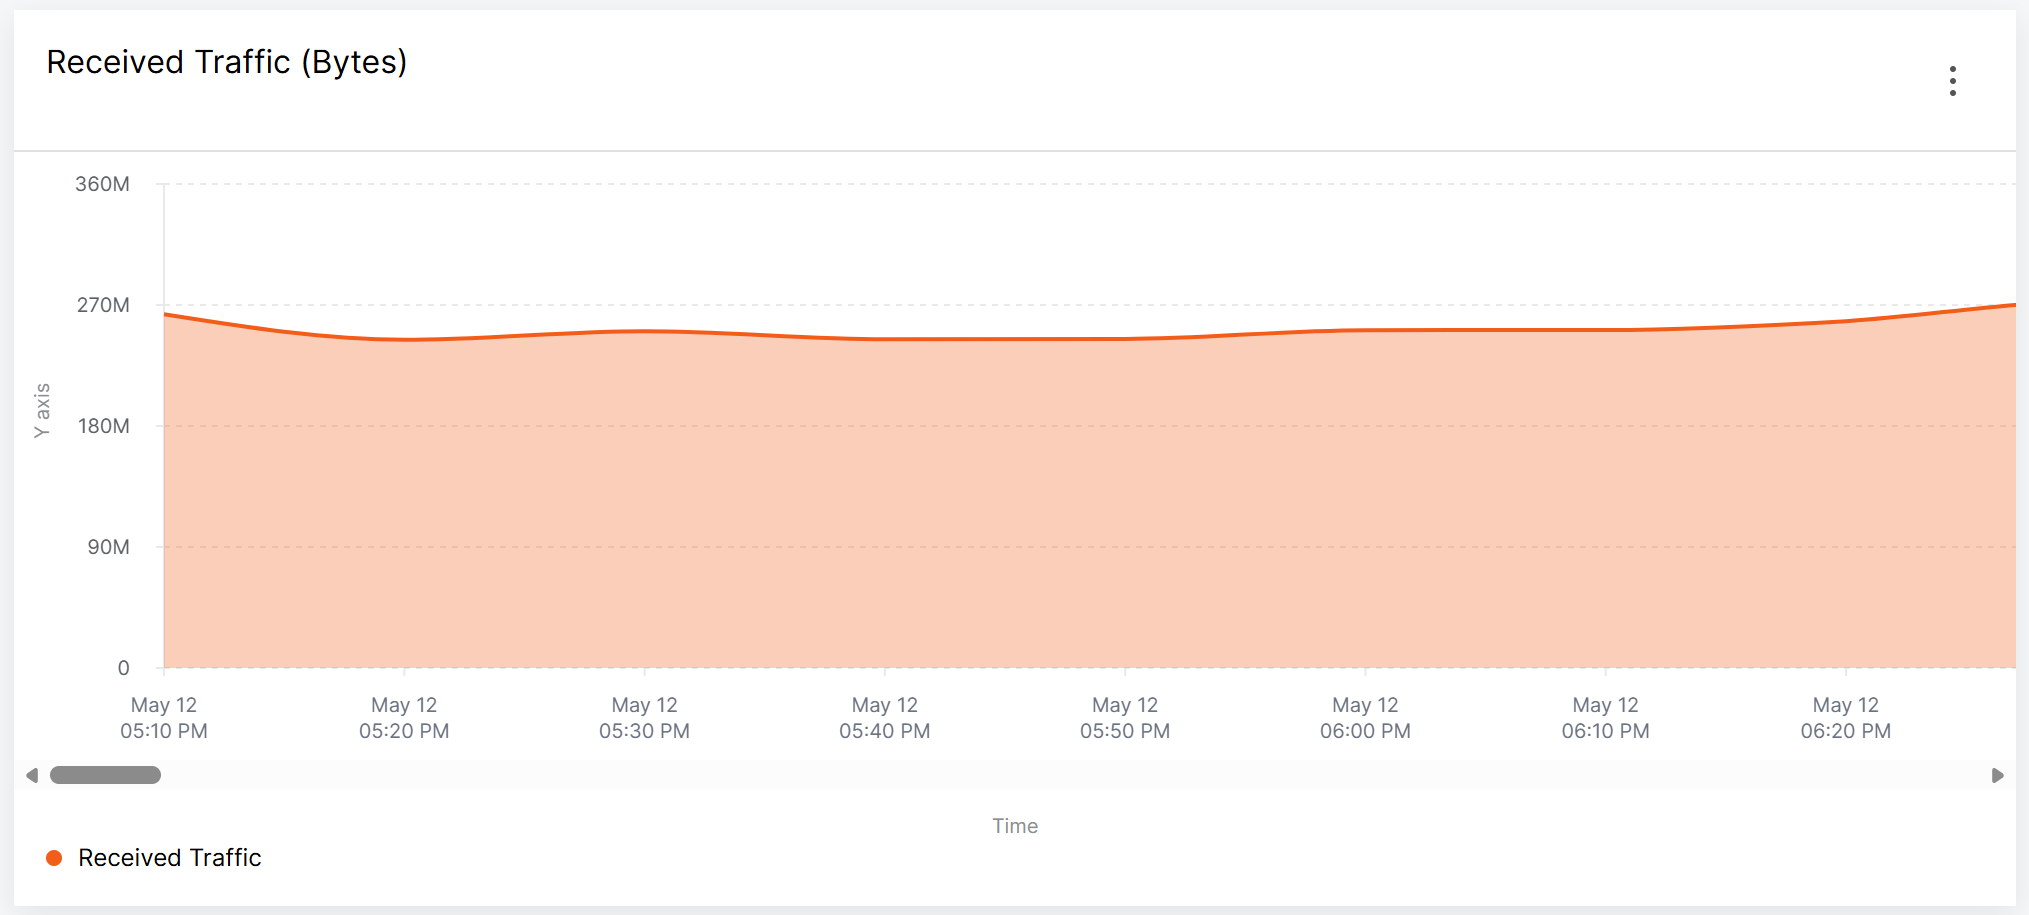 Figure 1: Area Chart Widget
Pie Chart
Use a Pie chart to show percentage distribution. It is useful when comparing parts of a whole.
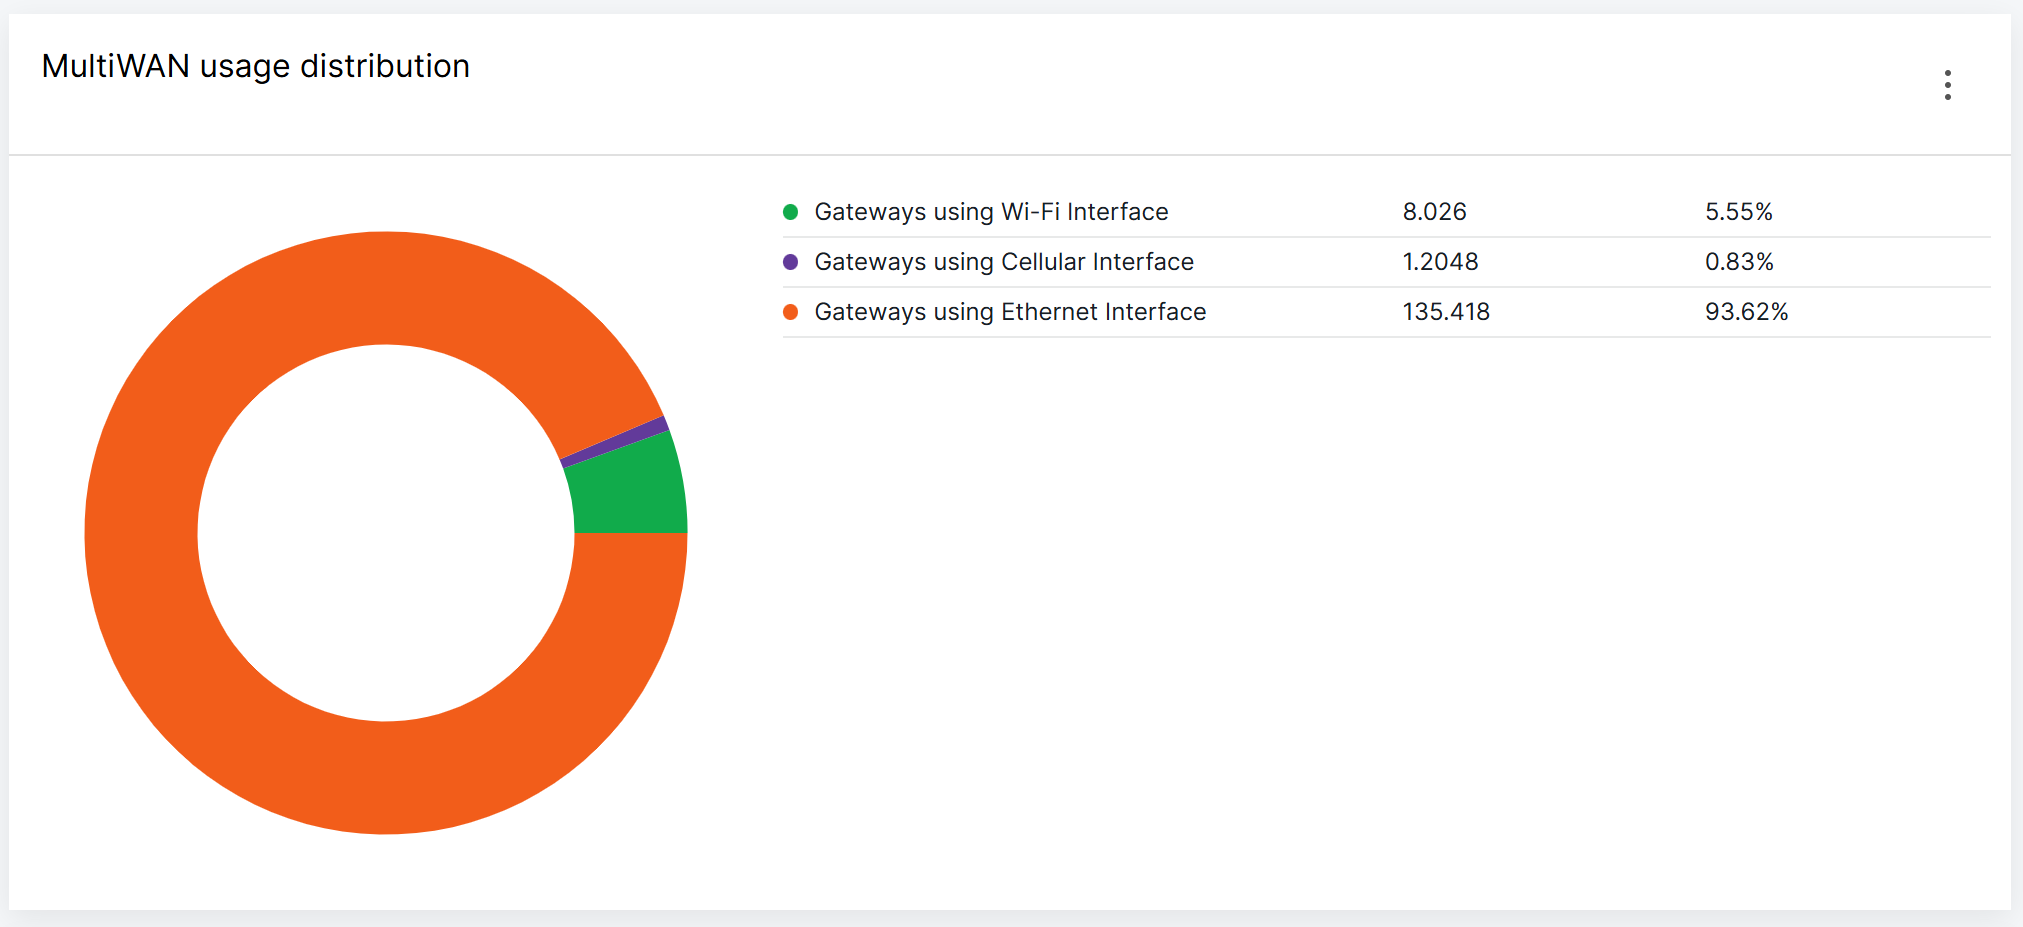 Figure 1: Pie Chart Widget
Table
Use a Table widget to show metric values by gateway. This is useful when users need to identify which gateway has a specific status or abnormal value.
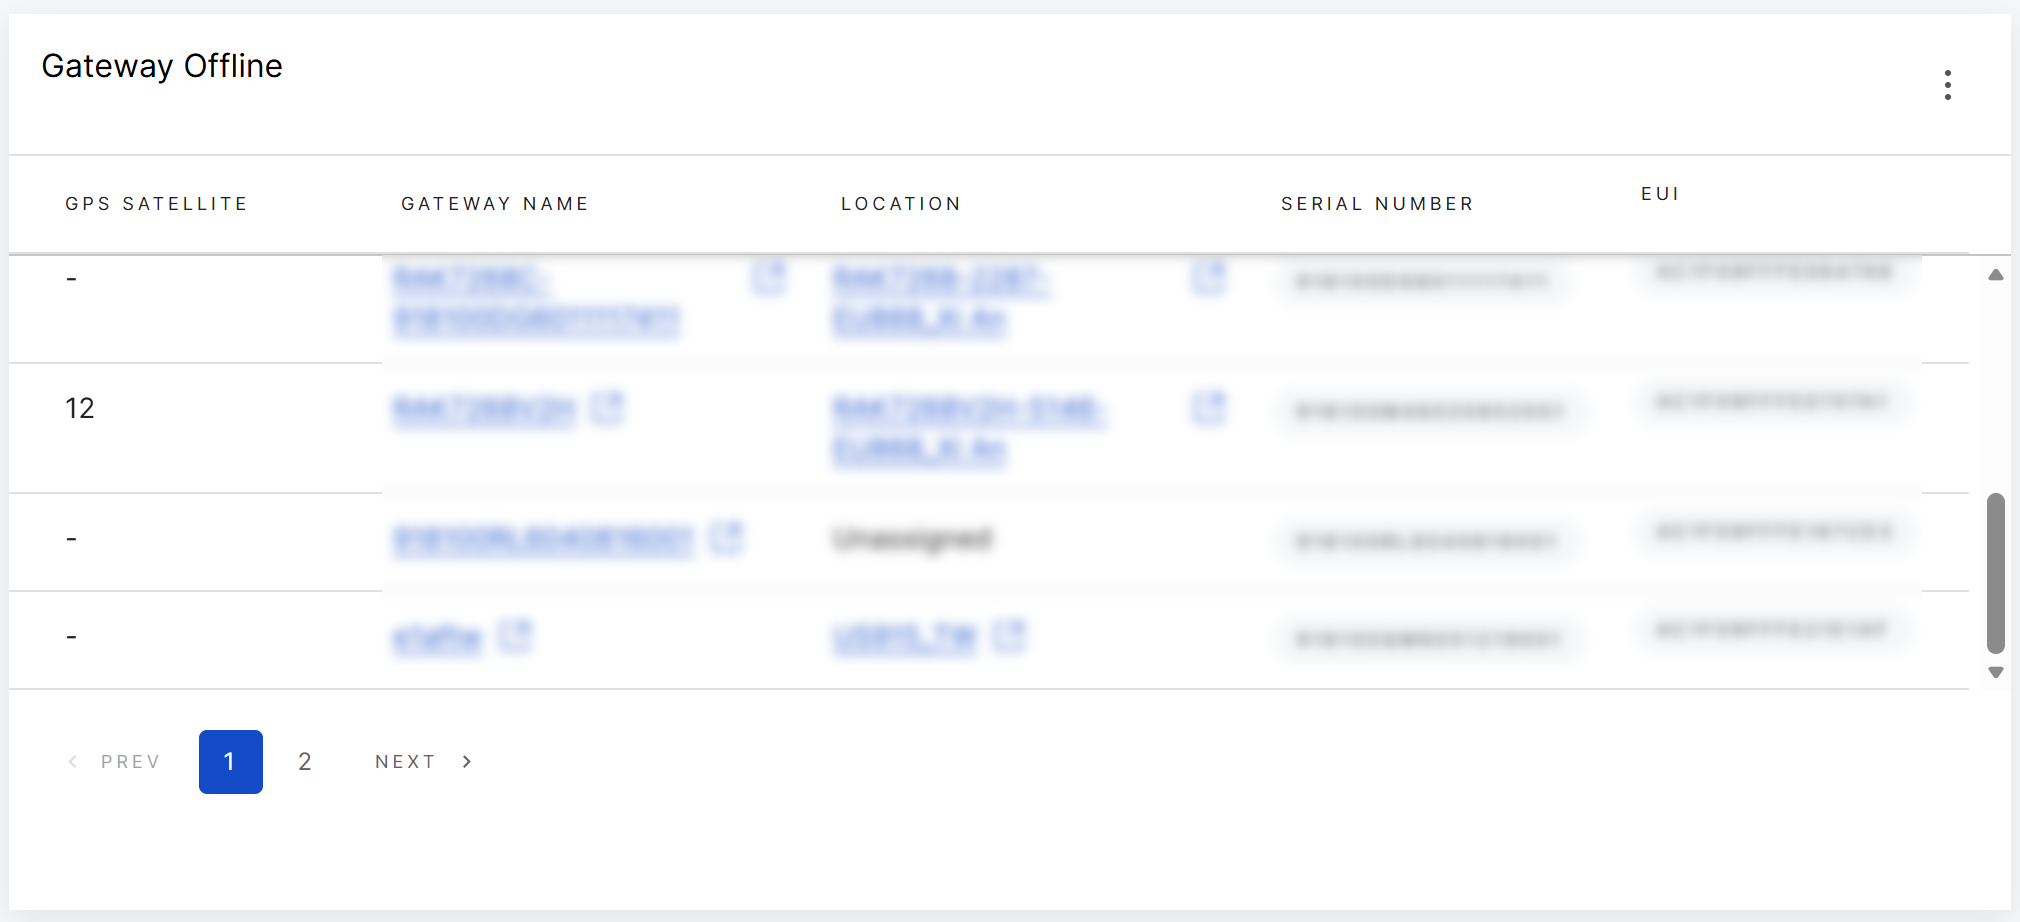 Figure 1: Table Widget
Supported Metrics and Filter Labels
Available Metrics
The following metrics are available in WisDM.
| Type | Metric | What It Helps Monitor | Filter Labels |
|---|---|---|---|
| CPU and Memory Utilization | Available Memory | Available memory on the gateway. | Default Filter Labels |
| CPU Utilization | CPU usage of the gateway. | Default Filter Labels | |
| GPS and Location | GPS Status | GPS status of the gateway. | Default Filter Labels |
| Observed GPS Satellites | Number of GPS satellites observed by the gateway. | Default Filter Labels | |
| LoRaWAN Packet Statistics | Downlink Packets Reporting Error | Downlink packet reporting errors. | Default Filter Labels |
| Downlink Packets Reporting Success | Successfully reported downlink packets. | Default Filter Labels | |
| Uplink Packets Reporting CRC Error | Uplink packets with CRC errors. | Default Filter Labels | |
| Uplink Packets Reporting CRC OK | Uplink packets with valid CRC. | Default Filter Labels | |
| Uplink Packets Without CRC | Uplink packets without CRC information. | Default Filter Labels | |
| Network Interface | Interface Uptime | Uptime of the selected network interface. | Default Filter Labels |
| Received Traffic (Bytes) | Received traffic on the selected network interface. | Default Filter Labels; Additional label: Interface = Ethernet, Wi-Fi, Cellular | |
| Transmitted Traffic (Bytes) | Transmitted traffic on the selected network interface. | Default Filter Labels | |
| Network Interface-Cellular Connectivity | Cellular Link Status | Cellular connection status of the gateway. | Default Filter Labels |
| Cellular Signal | Cellular signal level of the gateway. | Default Filter Labels; Additional label: Signal strength = 0, 1, 2, 3, 4 | |
| Network Interface-MultiWAN | Gateways using Cellular Interface | Gateways currently using the cellular interface. | Default Filter Labels |
| Gateways using Ethernet Interface | Gateways currently using the Ethernet interface. | Default Filter Labels | |
| Gateways using Wi-Fi Interface | Gateways currently using the Wi-Fi interface. | Default Filter Labels | |
| Storage | SD Card Status | SD card status of the gateway. | Default Filter Labels |
| System | Gateway Offline | Offline gateway data. | Default Filter Labels |
| Gateway Online | Online gateway data. | Default Filter Labels | |
| Gateway Status | Gateway status summary. | Default Filter Labels; Additional label: Status = Online, Offline, Rebooted | |
| System Uptime | System uptime of the gateway. | Default Filter Labels |
Default Filter Labels
| Filter Label | Description |
|---|---|
| Location | Filters data by location. |
| Gateway serial number | Filters data by gateway serial number. |
| Firmware version | Filters data by WisDM firmware version. |
Supported Operations
An Operation defines how WisDM calculates the selected metric values within the dashboard time range.
The same metric may show different results depending on the selected operation, widget type, filters, and time range.
| Operation | Meaning | Example |
|---|---|---|
COUNT | Counts the number of metric records or events. | Count how many gateway offline records exist during the selected time range. |
SUM | Adds all metric values together. | Total uplink CRC error packets during the selected time range. |
AVG | Calculates the average value. | Average CPU utilization over the last 24 hours. |
MIN | Returns the lowest value. | Minimum cellular signal level during the selected time range. |
MAX | Returns the highest value. | Maximum CPU utilization during the selected time range. |
Manage Widgets
After a widget is added to a dashboard, you can edit or delete it from the widget action menu. You can also adjust the widget position and size from the dashboard layout settings.
Edit a Widget
Use Edit widget to update an existing widget, including its widget details, metric configuration, operation, filter labels, and display settings.
-
Open the project that contains the dashboard.
-
Open the dashboard that contains the widget you want to edit.
-
Locate the widget you want to update.
-
Click the action menu on the widget.
-
Select Edit widget.
-
Update the widget settings as needed.
NOTEWhen editing a widget type, some options may become unavailable depending on the selected widget type or metric.
-
Click Retrieve metrics to preview the updated result.
-
Click Save to apply the changes.
After the widget is updated, the latest configuration is displayed on the dashboard.
Delete a Widget
Use Delete to remove a widget that is no longer needed.
Deleting a widget cannot be undone. Make sure the widget is no longer needed before confirming the deletion.
- Open the project that contains the dashboard.
- Open the dashboard that contains the widget you want to delete.
- Locate the widget you want to remove.
- Click the action menu on the widget.
- Select Delete.
- In the confirmation dialog, review the warning message.
- Click Delete to confirm.
After deletion, the widget is removed from the dashboard.
Adjust Widget Layout and Size
Widget position and size are managed from the dashboard layout settings. For details, see Manage Widget Layout.