Dashboard
The Dashboard provides real-time monitoring of the gateway's performance and LoRa traffic statistics. This section offers an overview of key network metrics, helping users analyze the gateway's behavior, connected devices, and message traffic.
LoRa Statistics
The LoRa Statistics page presents an organized view of essential LoRaWAN network parameters, displayed in multiple blocks to help users track packet transmissions, channel utilization, and traffic patterns.
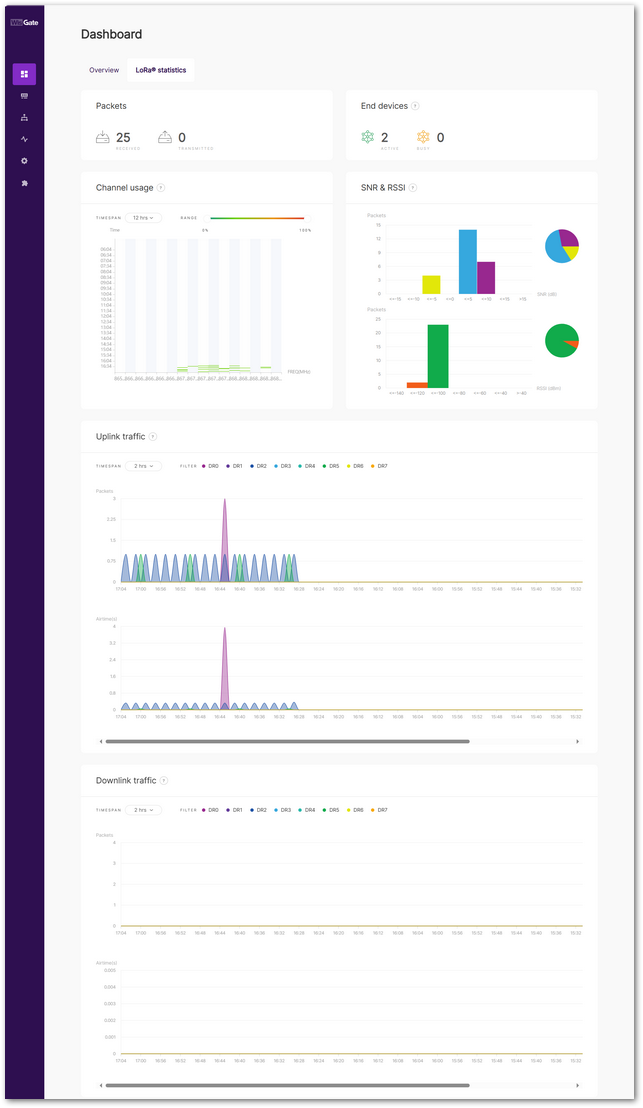 Figure 1: LoRaWAN Statistics
- Packets
Displays the total number of uplink (received) and downlink (transmitted) packets handled by the gateway. This includes messages from devices connected to the gateway as well as any LoRa-enabled device within its coverage area. - End devices
Shows the number of active end devices detected by the gateway:- Active: Devices that have transmitted data within the last hour.
- Busy: Devices that have sent an average of one uplink packet per minute over the past 10 minutes.
- Channel Usage
Visualizes frequency channel load. Green indicates low usage, while red signifies high congestion. Users can adjust the Timespan and Range filters to analyze specific timeframes. - SNR & RSSI
Displays Signal-to-Noise Ratio (SNR) and Received Signal Strength Indicator (RSSI) values across received packets. The data is presented in both bar graphs and pie charts for easy comparison. - Uplink Traffic
Tracks the number of uplink packets per minute and their corresponding airtime. The color-coded data rates (DR0–DR7) allow users to identify variations in network traffic. The Timespan filter lets users refine the displayed period. - Downlink Traffic
Similar to uplink traffic, this section displays downlink packet transmission rates and airtime. Users can adjust the Timespan to focus on specific intervals.
Overview
The Overview page provides a comprehensive snapshot of the gateway's current status, including hardware information, network configuration, system performance, and uptime. It allows users to quickly assess the health and connectivity of the device.
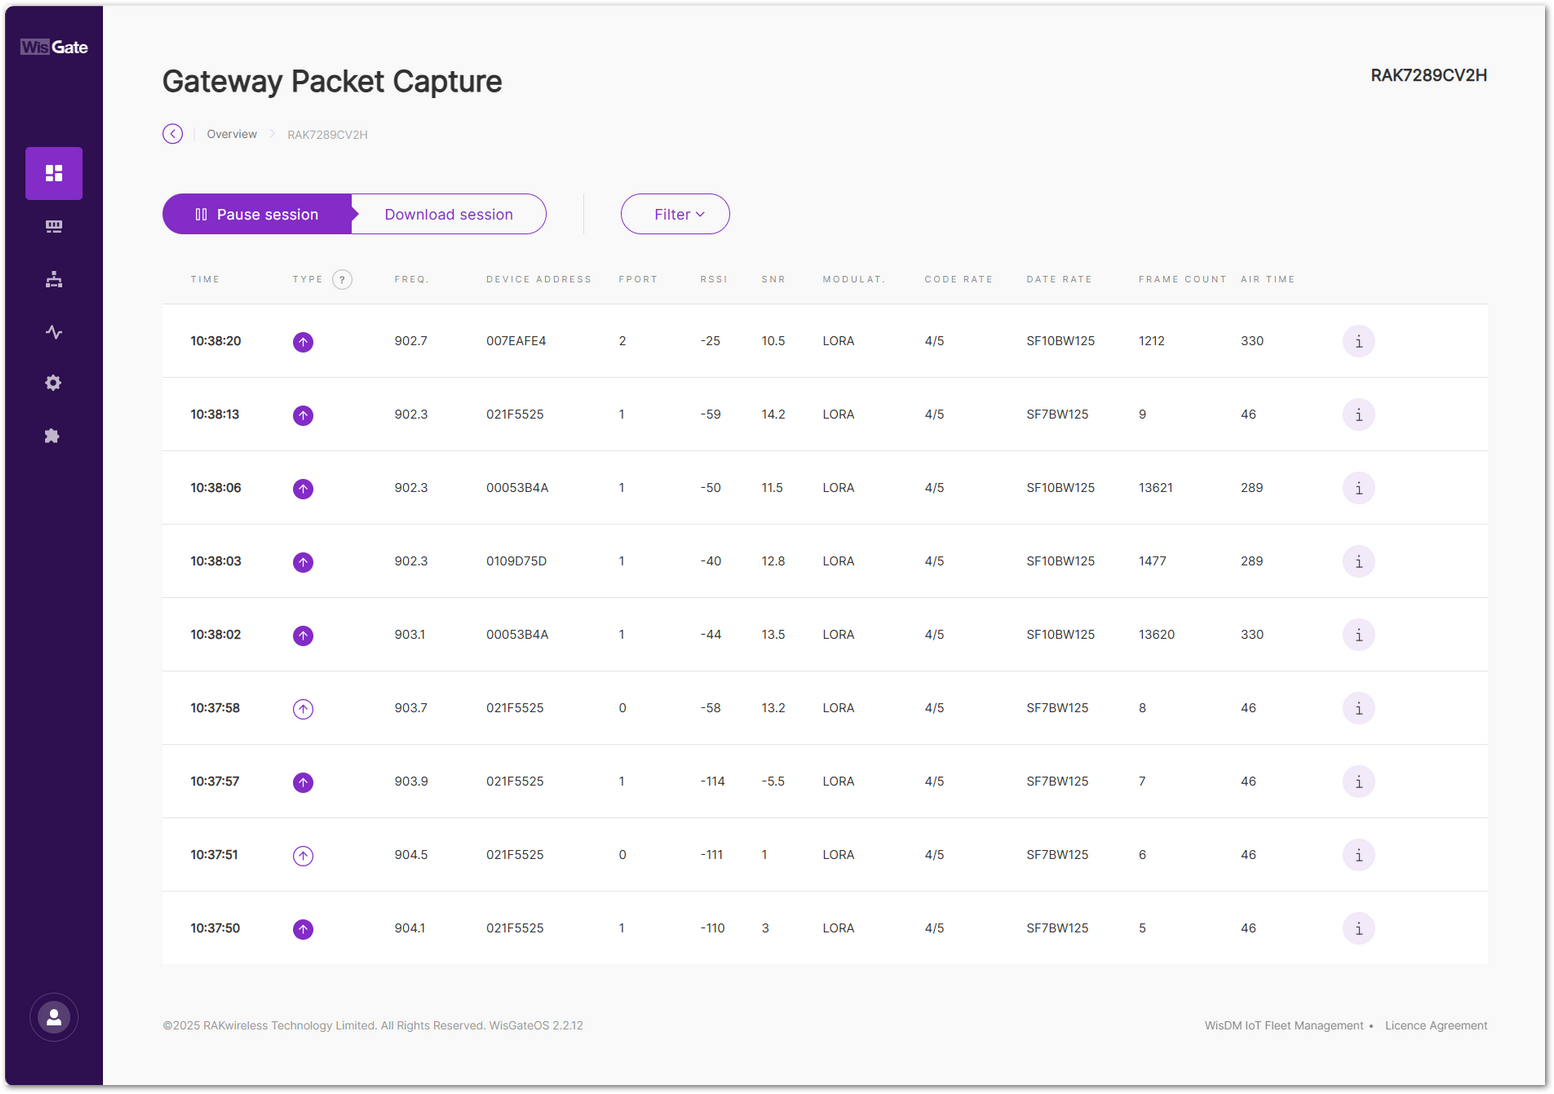 Figure 1: Overview
Basic Information
- MODEL: Displays the gateway model (e.g., RAK7289CV2H).
- SERIAL NUMBER: Unique serial number of the device.
- EUI: LoRa Gateway EUI identifier.
- REPORTED COORDINATES: Coordinates of the gateway.
- MAC ADDRESS: The MAC address used for network identification.
- FREQUENCY BAND: Indicates the LoRa frequency band in use (e.g., 915 MHz).
- NUMBER OF CHANNELS: Shows the number of LoRa channels supported.
- UPTIME: Displays how long the device has been running continuously.
- LOCAL TIME: The current system time on the gateway.
- SD CARD: Shows the operational status of the SD card, which is used for log storage and backups.
- Normal: SD card is detected and functioning properly.
- Not Found: No SD card is detected in the slot. This usually indicates that no card is inserted or the card is loose.
- Abnormal: An SD card is detected, but the gateway cannot read or write to it properly.
Firmware Information
- FIRMWARE: Shows the currently installed WisGateOS version (e.g., WisGateOS_2.2.12_RAK).
- Firmware details: The Firmware details button will redirect you to the Settings > Firmware.
Packet Capture
Allows users to capture and analyze LoRaWAN packets transmitted over the network for debugging and diagnostics.
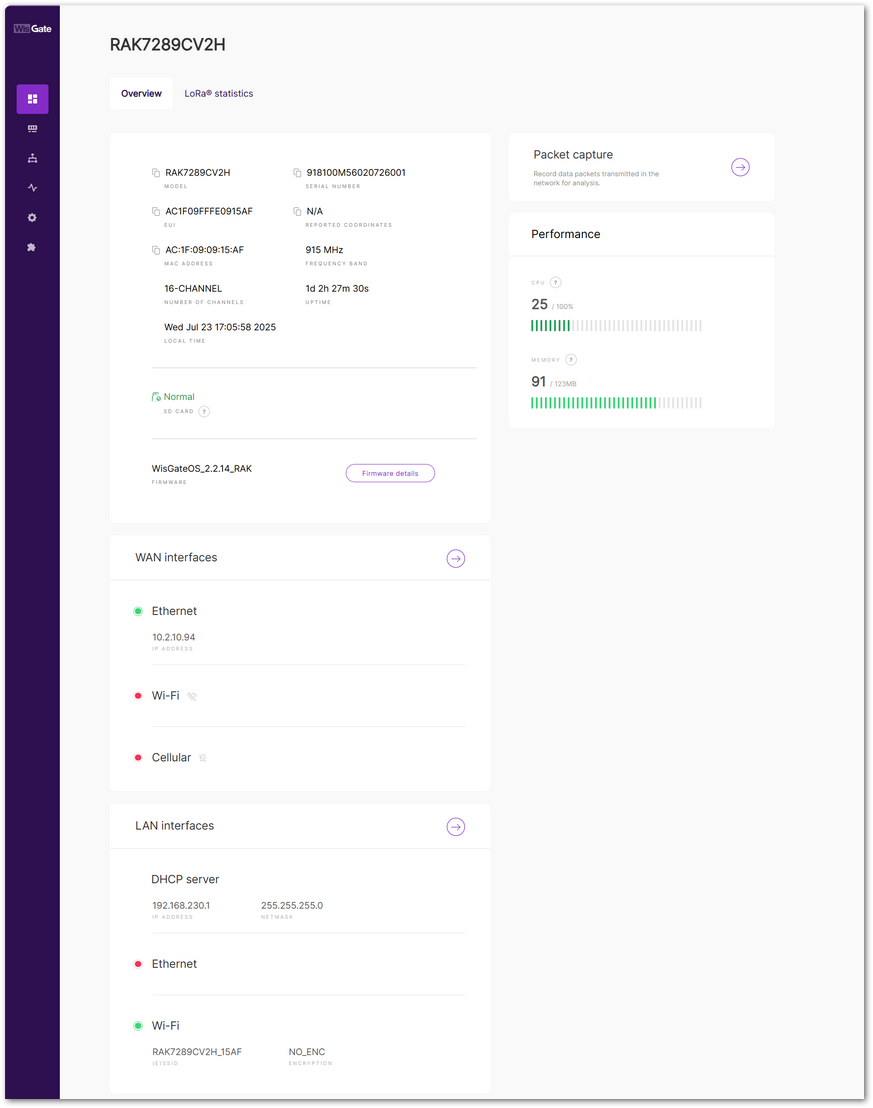 Figure 1: Gateway Packet Capture page
- Pause/Restart session: The button pauses or restarts the session.
- Download session: The button downloads a
.jsonfile with packet data in it. - Filter: The button opens a filter menu.
- Type: LoRaWAN message type.
- Frequency: The frequency on which the packet is received/sent.
- RSSI: Range of the RSSI.
- SNR: Range of the SNR.
- Hide CRC_ERR Packets: When enabled, the filter will hide all packets with a CRC Error.
- Reset filter: Reset the filter to default.
Performance
- CPU: Displays the current CPU usage percentage.
- MEMORY: Shows the amount of memory currently in use.
WAN Interfaces
Displays the status and IP address (if available) of the gateway's wide area network interfaces:
- Ethernet: Wired WAN connection with IP address shown.
- Wi-Fi: Indicates whether Wi-Fi WAN is enabled and connected.
- Cellular (LTE): Shows the status of the LTE connection.
LAN Interfaces
Displays the configuration and status of local area network interfaces:
- DHCP Server: Shows the LAN IP address and subnet mask provided by the DHCP service.
- Ethernet: Status of the LAN Ethernet interface.
- Wi-Fi: SSID and encryption status of the local Wi-Fi network broadcast by the gateway.
GPS
Display the current GPS positioning and timing status, indicating signal availability and system health. For more information, see Check GPS Status and Signal Quality on RAK LoRaWAN® Gateways.
Available only on gateway models equipped with a GPS module. If GPS is not supported, the GPS Status section will not appear in the UI.
- GPS locked, PPS Output: Confirm GPS positioning and precise timing are functioning correctly.
- GPS Locked, No PPS Output: Indicate GPS has a valid fix, but precise timing is unavailable.
- GPS Not Locked, No PPS Output: Show GPS has not acquired a fix, and no timing signal is present.
- No NMEA Output Detected: Detect no GPS data; possible disconnection or hardware issue.
- NO. Of SATELLITES: Indicates the number of satellites the GPS is currently receiving. More satellites generally mean stronger signals and higher positioning accuracy.