RAK7590 Field Test with Pad
Once the LoRaWAN Network Setup is complete and the Field Tester Pad is successfully connected to the LoRaWAN Network Server (LNS), this chapter guides you through the entire field testing workflow, from preparation and test execution to analyzing results and generating reports.
Before You Begin Field Testing
Before conducting field testing at any test points, make the following preparations, especially when the test location does not have Internet access:
- Verify the Pad’s system time.
Accurate timestamps are critical for analyzing logs and reports. If the test site has no Internet, perform time synchronization in advance. - Download offline map tiles (optional).
Only required if your test area has no Internet access and you want to display test-point signal distribution on a geographic map. - Review the site layout.
Obtain a site map and identify buildings, obstacles, gateways (if any), and your planned test points.
Perform Field Tests
Non-Labeling Test
The Non-Labeling Test is the default test mode. It starts automatically after the device successfully joins the network and continues until you manually stop it.
- Displayed as green curves on the line charts
- Stops only when you tap Stop Test
Typical scenarios
- Walk test / route survey: Scan coverage while moving along real deployment routes (corridors, floors, tunnels, production lines).
- Quick coverage screening: Get an initial view of overall coverage and identify areas that may need further verification.
- Weak-zone discovery: Detect sudden RSSI/SNR drops or unstable links, then run Labeling Tests at those locations for repeatable measurements.
How to Run the Non-Labeling Test
- Go to the area you want to evaluate (for example, a building floor, a production line, a warehouse zone, or an outdoor route), then turn on the Pad and open the Dashboard page.
- Tap Start Test.
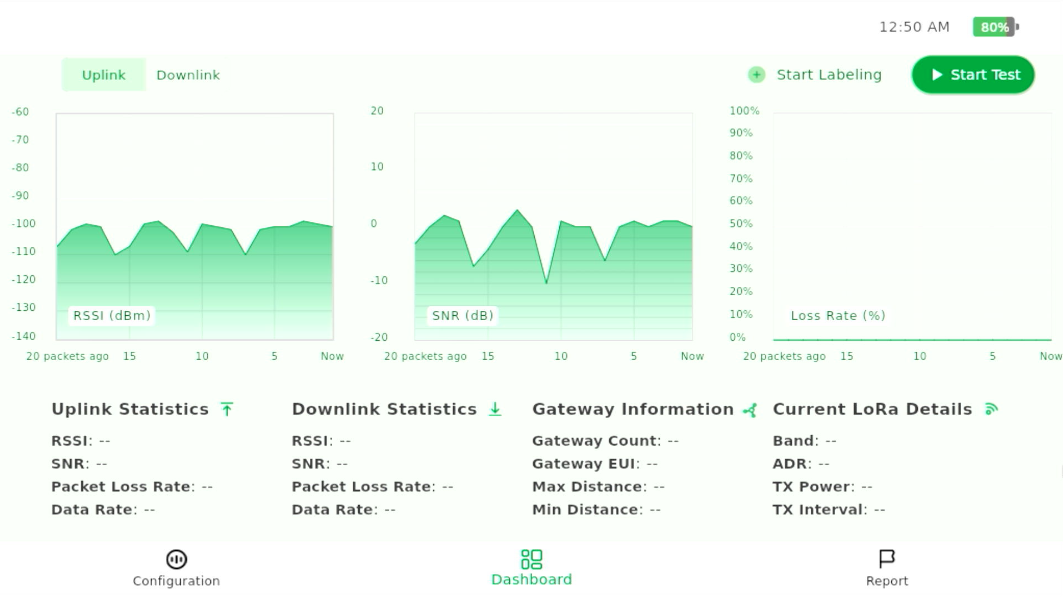 Figure 1: Start a Test
 - Wait for OTAA join to complete. Once the uplink status shows Join Succeeded, the Pad starts sending periodic uplinks automatically and the green charts appear.
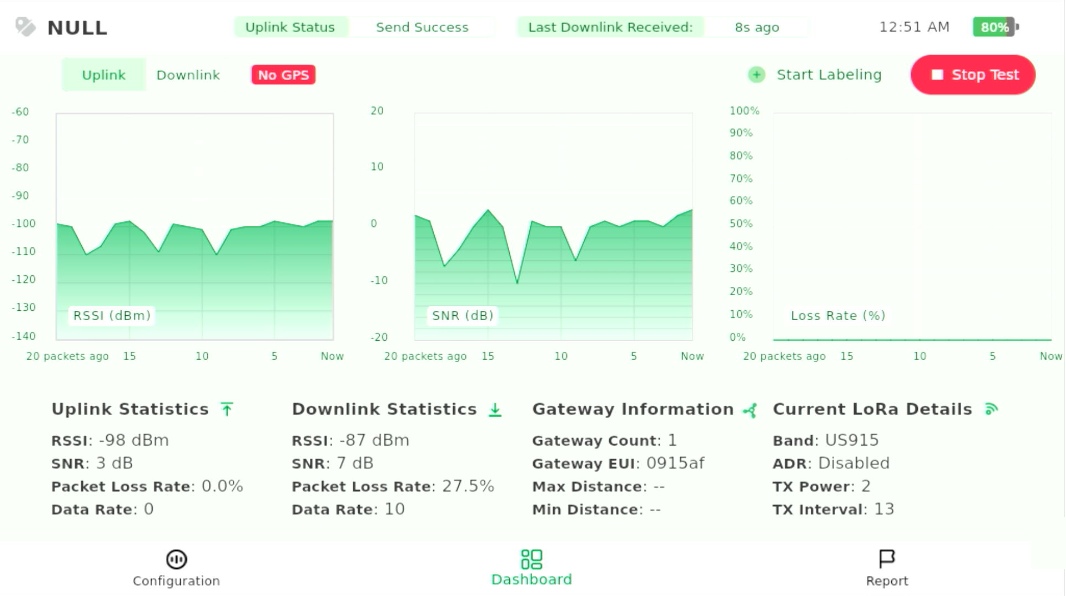 Figure 1: Non-Labeling Test in Progress
 - Walk through the target area along the planned path to scan coverage. If you notice sudden drops in RSSI/SNR or a high packet loss rate, mark these locations and plan Labeling Tests for repeatable, fixed-point verification.
Labeling Test
Use the Labeling Test when you need to measure signal quality at a fixed location and obtain repeatable, comparable results. This test is typically triggered after a Non-Labeling Test when you want to verify a point in detail.
- Automatically sends 50 uplink packets at the same location
- Displayed as orange curves on the line charts
- Can be stopped early using Ending Labeling
- Automatically resumes the Non-Labeling Test when finished
Typical scenarios
- Indoor or GPS-weak environments (basements, corridors, equipment rooms)
- Verifying candidate sensor installation locations
- Confirming coverage at critical points identified during walk tests
- Any scenario requiring fixed-point, repeatable measurements
- Locations where manual coordinate assignment is needed
How to Perform a Labeling Test
- Go to the target test point and open the Dashboard page on the Field Tester Pad.
- Tap Start Test and wait until the device successfully joins the network.
- Tap Start Labeling.
Figure 1: Start a Label Test
- In the dialog that appears:
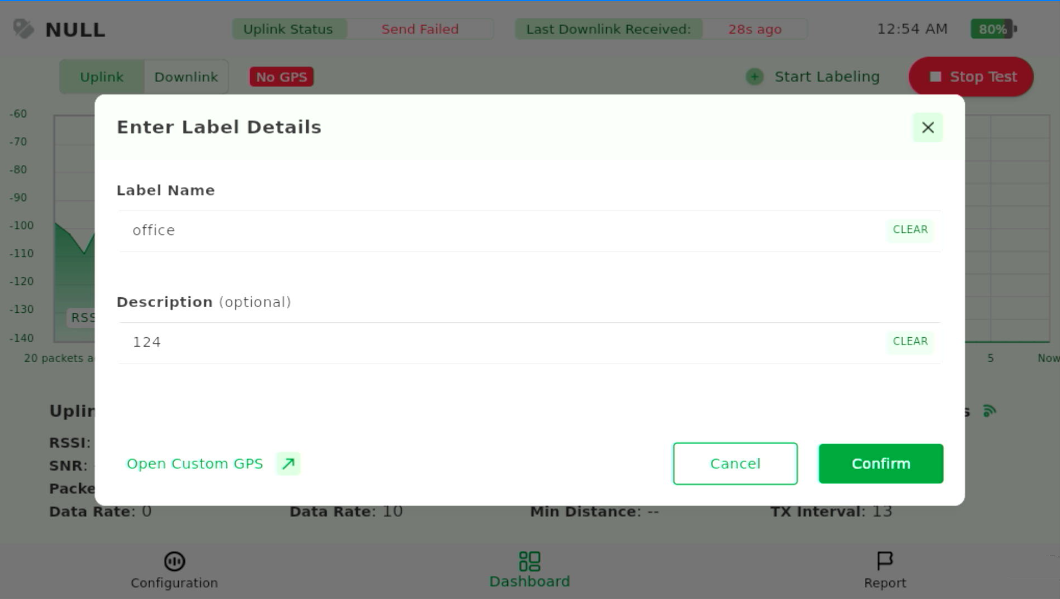 Figure 1: Enter Label Information
- Enter a Label Name (required).
- Enter a Description (optional).
- Open Custom GPS (optional): Use when GPS reception is weak or unavailable to manually enter the test point’s location.
- (Optional) Set a custom GPS location if testing indoors or in a GPS-weak environment. You can manually enter coordinates or select a location on the map.
NOTE
- GPS coordinates are only required for the Geolocation Map View. Labeled points will still appear in Signal View even without GPS; you can add coordinates later.
- Custom GPS coordinates apply only to the current Labeling Test. If you start another Labeling Test, you must set them again if needed.
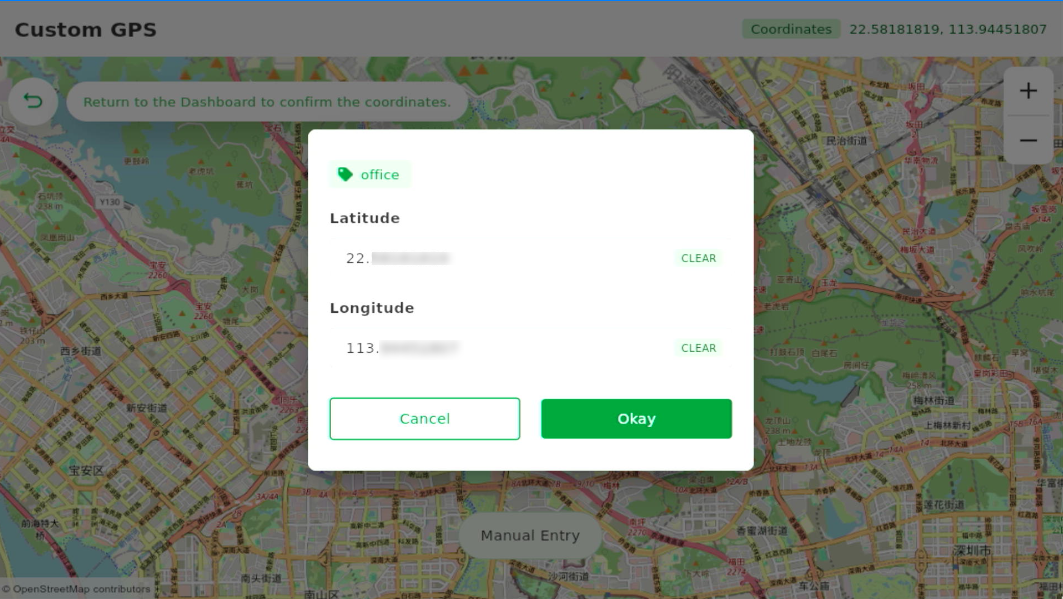 Figure 1: Enter Custom GPS Coordinates
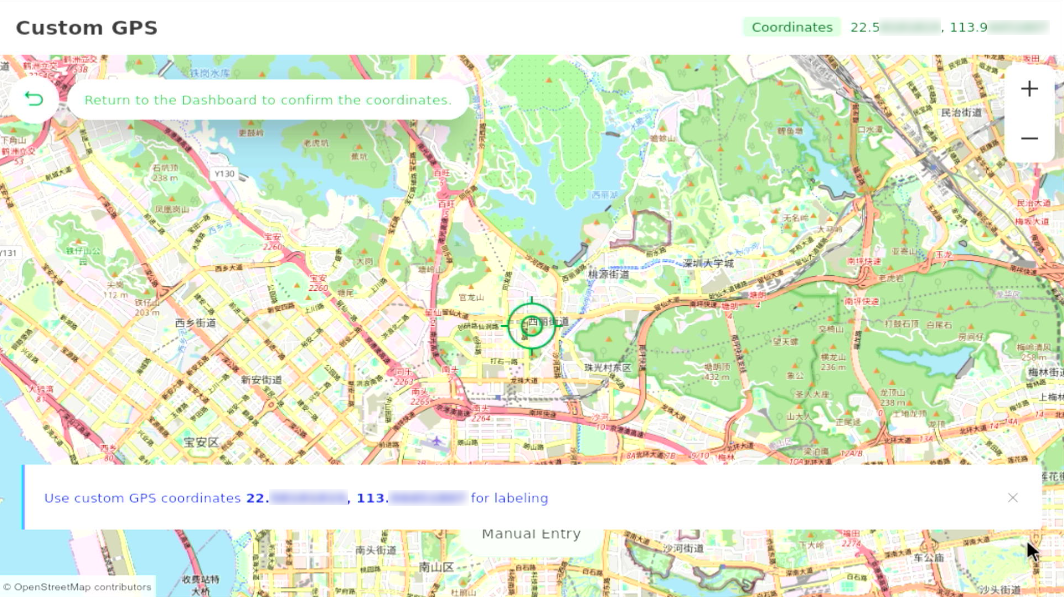 Figure 1: Custom GPS Applied Successfully
 - Tap Confirm to begin the Labeling Test.
- Keep the Pad fixed and stay still while it automatically sends 50 uplink packets.
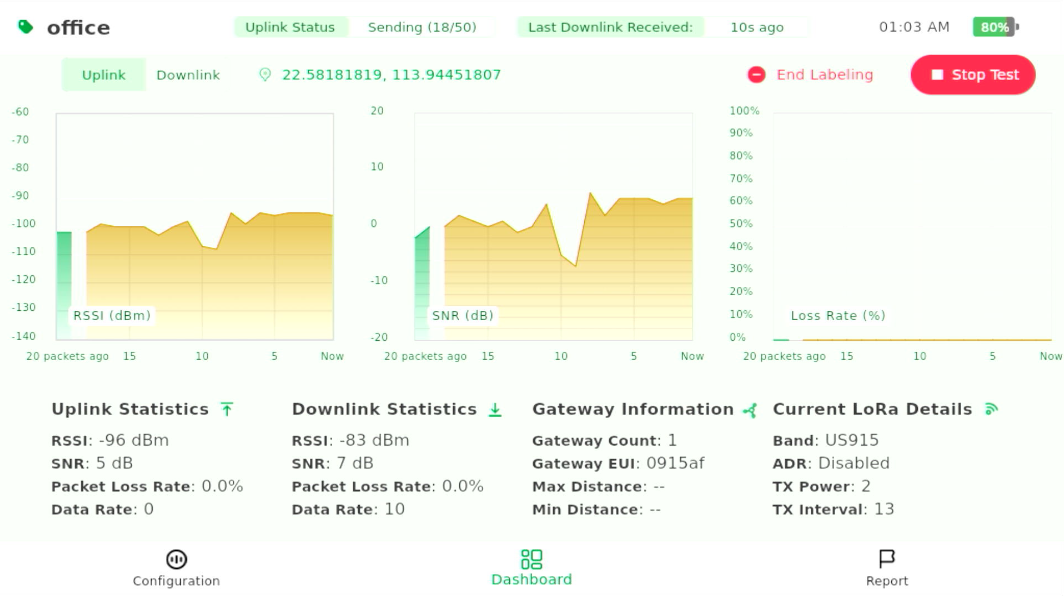 Figure 1: Labeling Test in Progress
 - Repeat the same steps for all planned fixed test points.
Scenario-Based Field Testing
Network Planning & PoC (Coverage Survey)
This test is performed during the planning or PoC stage to evaluate real-world LoRaWAN coverage across the target area. It helps you:
- Validate site feasibility and expected coverage range
- Identify weak or dead zones and key risk areas
- Compare predicted vs. measured coverage
- Determine whether network changes are needed (for example, adding gateways or adjusting the deployment plan)
The objective is to map coverage boundaries and overall link quality so you can decide if the current network design meets your requirements.
Test Procedure
- Select the areas you intend to cover and define a rough testing route, along with several key or planned test points for later verification.
- Go to the test area, power on the Field Tester Pad, and open the Dashboard page.
- Tap Start Test. Wait for the uplink status to show Join Succeeded. The Non-Labeling Test starts automatically, allowing you to walk through the area and scan overall coverage.
- While moving along the planned route, observe signal behavior.
- At a selected point (for example, weak-signal areas, boundaries, or important deployment spots), tap Start Labeling to run a 50-packet fixed-point measurement for accurate, repeatable comparison.
- Stay still during each Labeling Test.
NOTE
For accurate results at each test point:
- Do not walk
- Do not rotate the device
- Do not block the antenna
- Avoid standing between the Pad and the gateway
- Observe real-time signal metrics on the Dashboard:
Figure 1: Testing in Progress
- Real-time Uplink/Downlink RSSI/SNR Graphs and Data
- Packet Loss Rate Graph
- Packet Progress Indicator in Labeling Test
- Gateway Information and LoRaWAN parameters
NOTEFor more detailed information on the device parameters , refer to RAK7590 Datasheet.
- Continue walking and repeating Labeling Tests at all selected locations until the entire area is covered.
Reports & Data Export
- After covering all selected test points, generate an on-device report to evaluate overall network coverage. For detailed steps, refer to On-device Reports.
NOTE
On-device visual reports (scatter chart / map) show labeled test points only. Make sure you ran Labeling Tests at each test point before generating the report.
- If you need to deliver results or perform further analysis, follow Historical Report Generation & Export to generate the historical report and export the files.
- PDF Report: Labeled-point summary (avg RSSI/SNR, packet loss, uplink/downlink stats) with a scatter chart and geolocation map.
- CSV Files (Uplink/Downlink): Complete raw records for all packets (labeled and unlabeled).
Coverage Evaluation & Recommendations
Use the on-device report (scatter chart / map) and exported data to evaluate overall coverage quality across the site.
| Coverage Level | Combined Conditions | Interpretation | Recommendation |
|---|---|---|---|
| Good Coverage | ≥80% of measured points meet all of the following: • RSSI > –80 dBm • SNR > 0 dB • Packet Loss < 5% | Strong, clean, and stable links across the area | Current network design is acceptable; suitable for wide sensor deployment |
| Marginal Coverage | 10~30% of points show any of the following: • RSSI < –100 dBm • SNR < –5 dB • Packet Loss 5~15% | Edge coverage or localized interference | Avoid weak spots; fine-tune gateway position or test nearby micro-locations |
| Poor Coverage | ≥30% of points show any of the following: • RSSI < –100 dBm • SNR < –5 dB • Packet Loss > 15% | Coverage insufficient or unstable | Add a gateway or redesign the deployment |
Endpoint Placement Verification
This test is performed when you need to confirm whether an end device (sensor) can be reliably installed at one or more candidate mounting spots. The goal is to evaluate signal stability over time at each spot and select the location with the most stable RSSI/SNR and lowest packet loss.
Test Procedure
- Identify 2~5 candidate installation spots for the endpoint (for example, different heights, sides of a wall, or inside/outside a cabinet).
- Go to the first candidate spot and open the Dashboard page on the Field Tester Pad.
- Tap Start Test. Wait for the uplink status to show "Join Succeeded", then the regular non-labeling test begins.
- Tap Start Labeling and assign a label that reflects the spot (e.g., B1-Parking-A12-2m-Inside).
- (Optional) Add the test point coordinates if you are testing indoors or GPS reception is weak. Tap Open Custom GPS and set the location manually.
- Keep the Pad fixed during measurement.
NOTE
For accurate results at the test point:
- Do not walk or rotate the device
- Do not block the antenna
- Avoid standing between the Pad and the gateway
- Observe RSSI/SNR trend and packet loss stability during testing.
Figure 1: Testing in Progress
- Real-time Uplink/Downlink RSSI/SNR Graphs and Data
- Packet Loss Rate Graph
- Packet Progress Indicator in Labeling Test
- Gateway Information and LoRaWAN parameters
NOTEFor more detailed information on the device parameters , refer to RAK7590 Datasheet.
- (Optional) If needed, repeat the labeling test at the same spot to confirm stability.
- Repeat Steps 2~8 for each candidate spot and compare results to select the best installation point.
NOTE
For interference-prone areas, repeat tests at different times (morning / afternoon / peak hours) to identify intermittent degradation.
Data Analysis
To make a reliable decision on the most stable candidate location for an endpoint (sensor/device), it is recommended to analyze network performance over a longer time window, not just a single measurement.
Start with the on-device report for a quick review, then export historical logs for trend analysis.
On-device report (quick check) Generate an on-device report and use Signal View (Scatter Chart) or Geolocation Map View to quickly screen out clearly poor candidate locations and make an initial placement decision based on signal distribution across labeled points. For detailed steps, refer to On-device Reports.
Trend analysis (for stability verification) Export the historical report files and use the CSV data to review per-packet trends (RSSI/SNR/packet loss over time) and identify intermittent drops or fluctuations. This helps confirm which candidate spot is most stable. Follow Historical Report Generation & Export to export the files to a USB flash drive.
Endpoint Placement Evaluation & Recommendations
| Evaluation Result | Typical Characteristics | Deployment Recommendation |
|---|---|---|
| Recommended | • RSSI > –80 dBm • SNR > 0 dB • Packet Loss < 5% • Stable trends | Safe to install sensors, including critical devices |
| Conditionally Acceptable | • RSSI –80 to –100 dBm • SNR –5 to 0 dB • Packet Loss 5~15% • Minor fluctuations | Install with caution; optimize height, orientation, or avoid metal obstructions |
| Not Recommended | • RSSI < –100 dBm • SNR < –5 dB • Packet Loss > 15% • Unstable trends | Do not install; relocate sensor or improve network coverage |
Reports
After completing field testing, you can review, analyze, and export all collected test data on the Report page.
Reports can be used as project deliverables and as a data source for deeper analysis and troubleshooting.
The Field Tester Pad provides two ways of post-test analysis:
- On-device quick coverage assessment (Signal scatter chart / Geolocation map)
- In-depth data analytics using exported CSV or PDF reports
On-device Reports
Generate a Report
The Pad can generate a local test report based on completed Labeling Tests within a selected time range. Only periods that contain Labeling Test records will produce a report. If no Labeling Test exists in the chosen time range, no report will be created.
- Navigate to the Report page. When the dialog appears, tap OK.
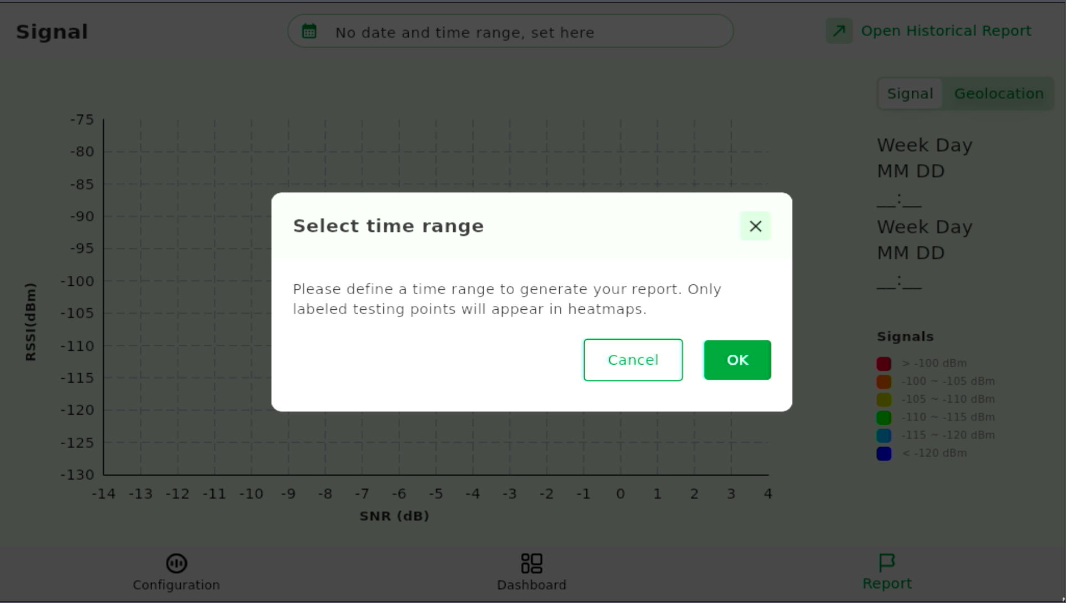 Figure 1: Generate Report
 - Select a time range and tap OK.
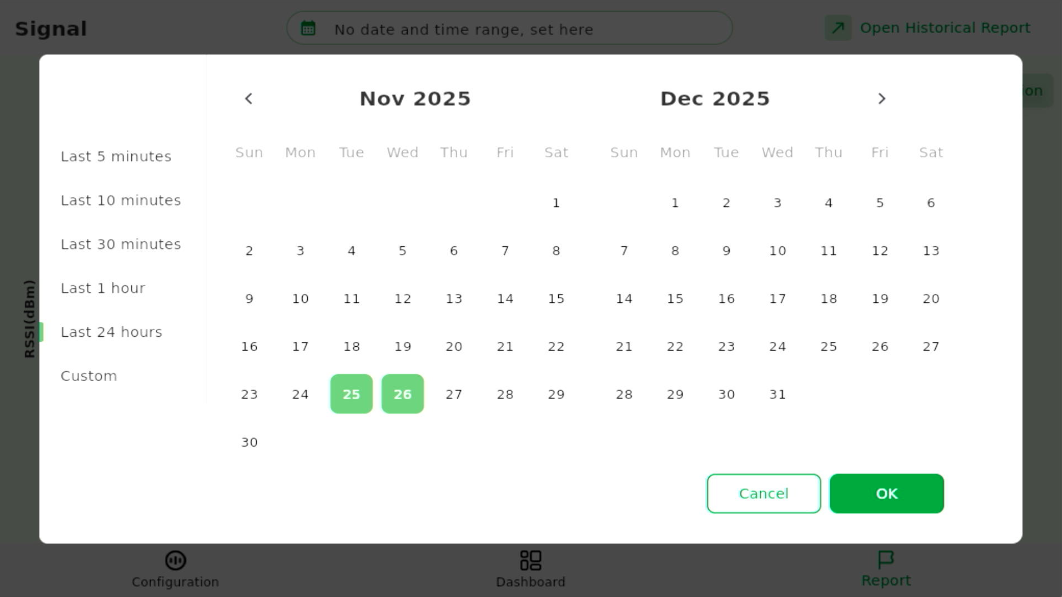 Figure 1: Select Time Range
View and Manage Reports on the Pad
Reports can be viewed in two modes:
- Signal View (scatter chart)
- Geolocation Map View
Both viewing modes display only labeled test points. Unlabeled (NULL) test records are not shown on the Pad and are available only in the exported CSV file.
Signal View (Scatter Chart)
After selecting a time range, the Pad displays a scatter chart showing:
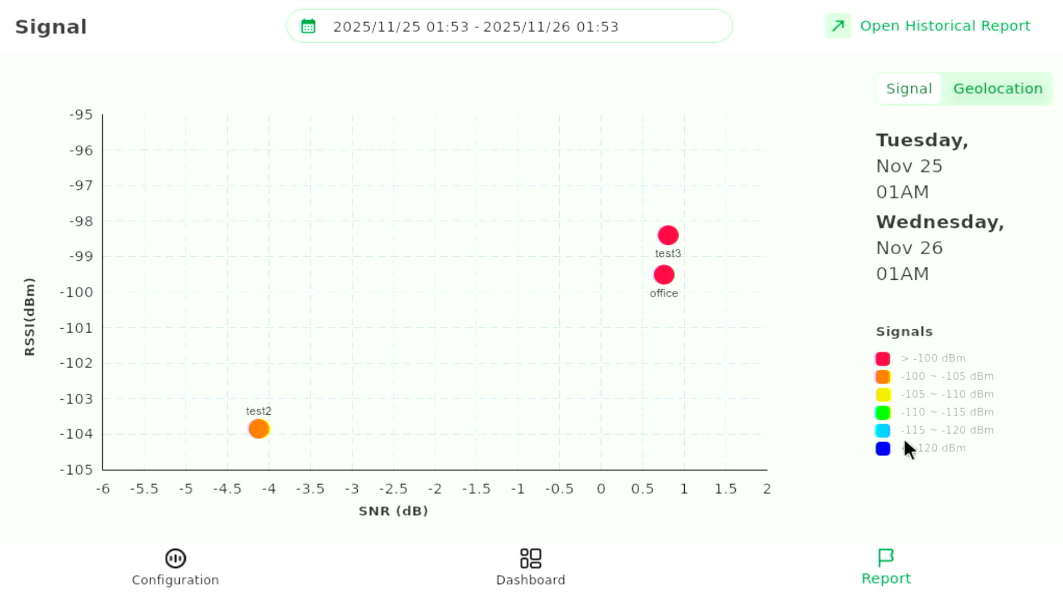 Figure 1: Signal Quality Scatter Chart
- RSSI (Y-axis)
- SNR (X-axis)
- Each labeled test point represented as a dot
This chart helps you quickly compare the signal quality at different fixed test points. When you hover over a dot, the chart displays the average RSSI and SNR calculated from the 50 uplink packets collected at that test point.
Geolocation-Based Map View
-
Tap the Signal / Geolocation toggle to switch to the map view.
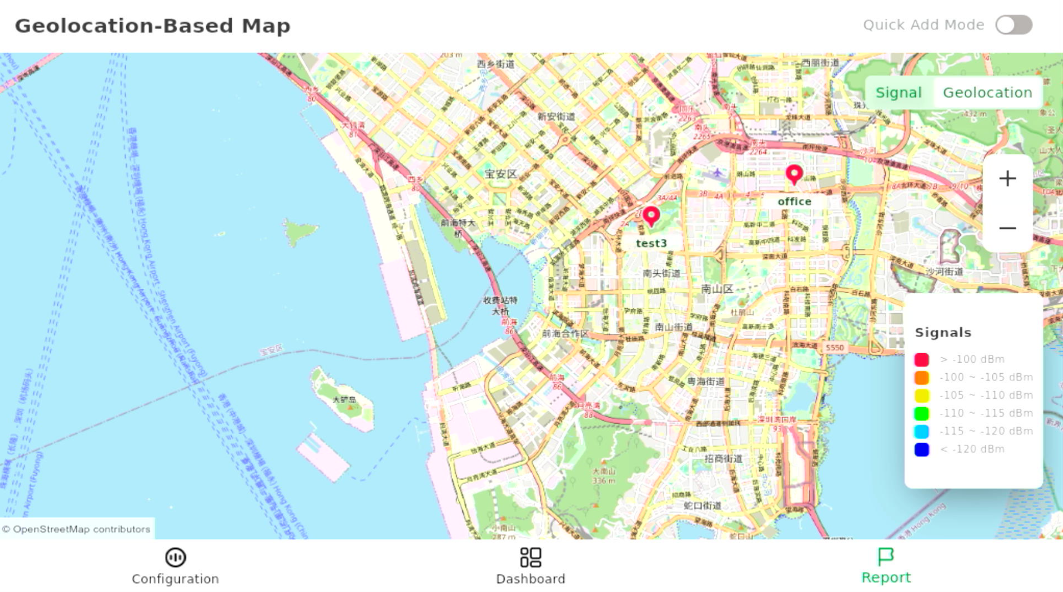 Figure 1: Geolocation-Based Map View
In the map view, you can see:
- Labeled test points and their geographic positions
- Color-coded markers based on RSSI categories, indicating signal quality
- A clear visualization of coverage distribution
This view helps you quickly understand the overall network coverage across the environment.
- If the Pad had no Internet and offline map tiles were not downloaded in advance, the map cannot be displayed.
- If the Pad has no internet connection but offline map tiles were previously downloaded, the map will display offline map tiles. Areas outside the downloaded region will be shown in gray.
- If a labeled test point does not have GPS coordinates assigned during testing, it will not appear on the map. You can add coordinates later by following Add or Edit GPS Coordinates.
Add or Edit GPS Coordinates
To add or correct coordinates:
- Enable Quick Add Mode, then tap on the map at the desired location.
- The Edit Label Information dialog will pop up.
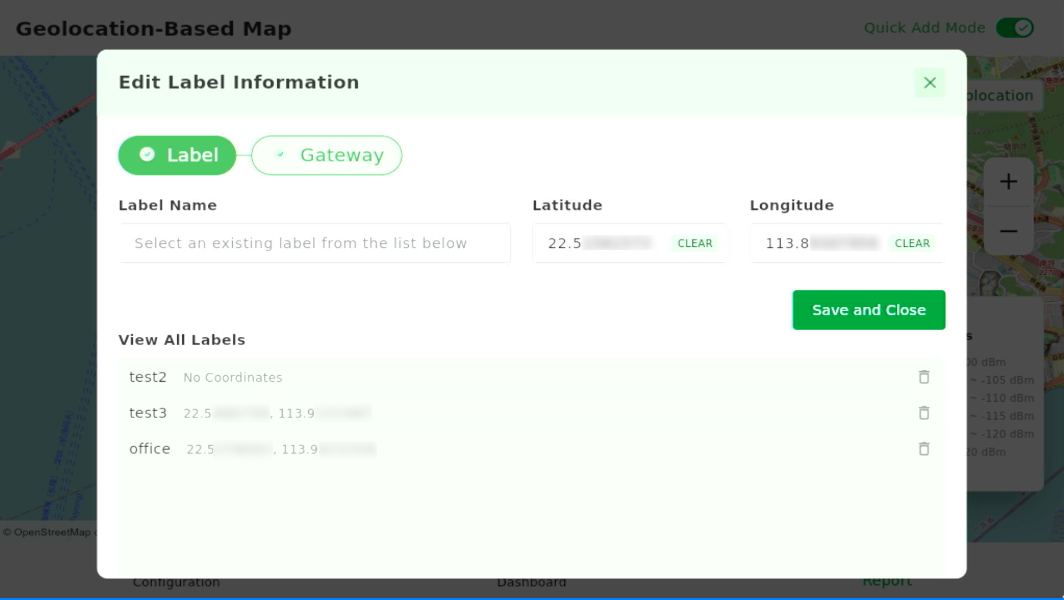 Figure 1: Edit Label Information
 - In View All Labels, select a label to assign coordinates.
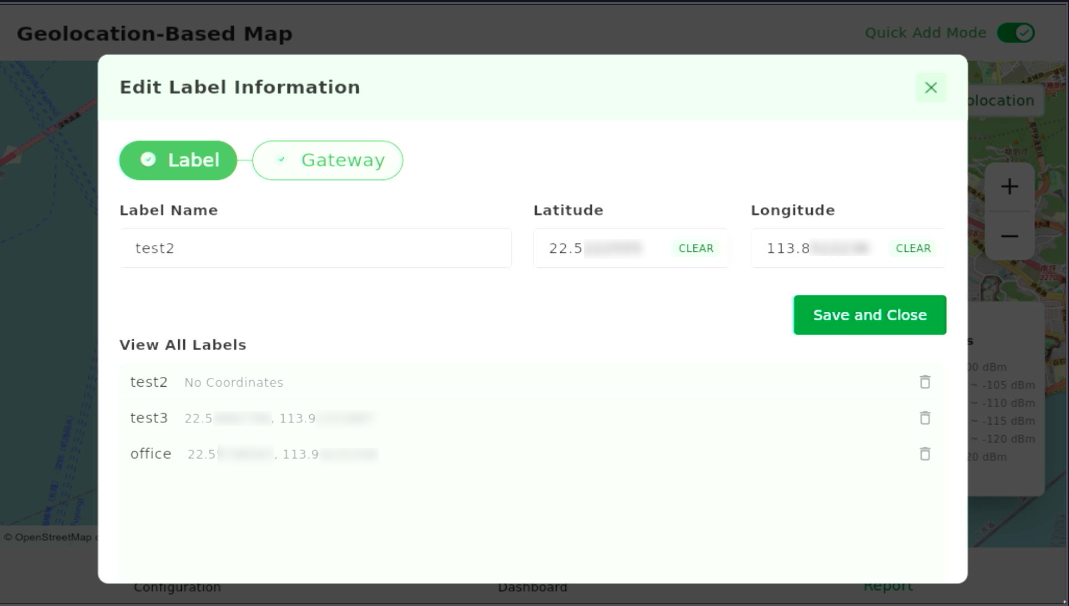 Figure 1: Assign Coordinates to LabelNOTE
You can also adjust the latitude and longitude for previously placed labels.
- Tap Save and Close. The test point will now appear correctly on the map.
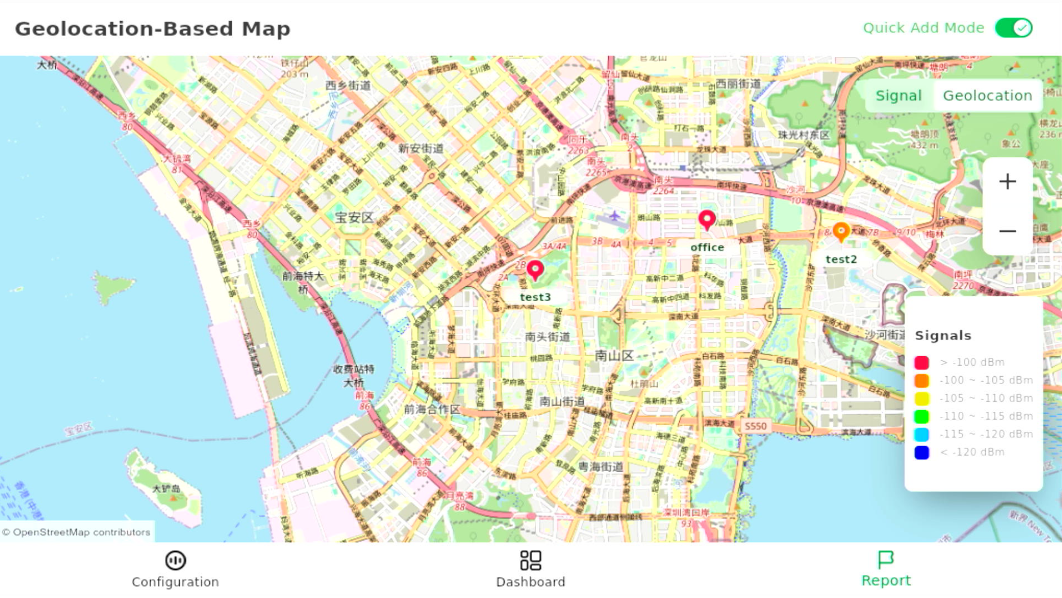 Figure 1: Label Coordinates Updated
Add Gateway Icon (Optional)
To visualize the gateway position relative to your test points, you can add a gateway marker on the map.
- Tap the desired location on the map.
- In the dialog, select Gateway.
- Enter a gateway name/identifier and choose an indoor or outdoor icon type.
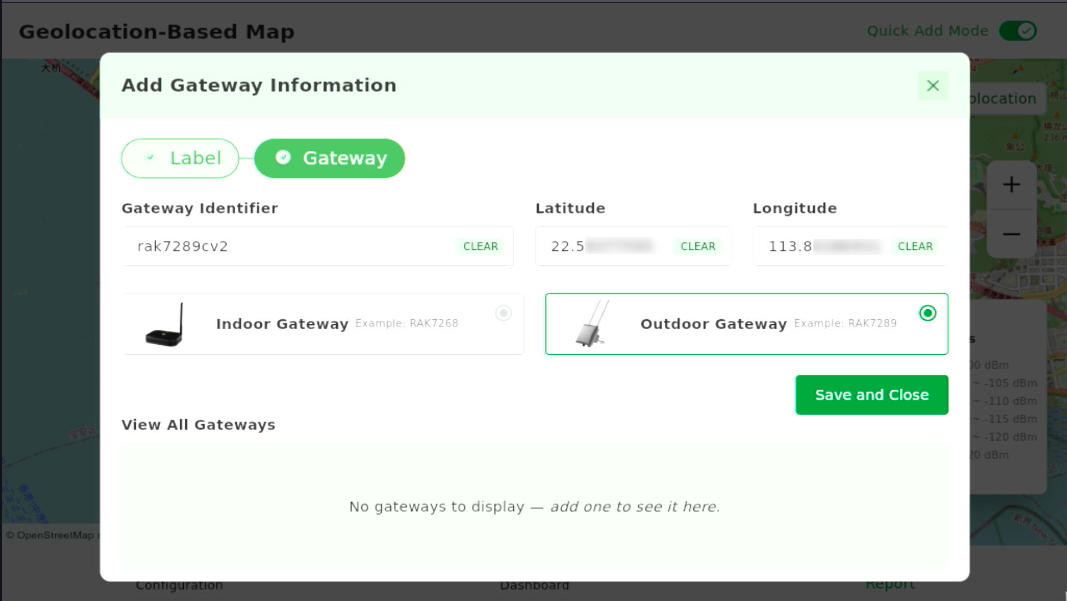 Figure 1: Add Gateway Information
 - Tap Save and Close to place the gateway icon on the map.
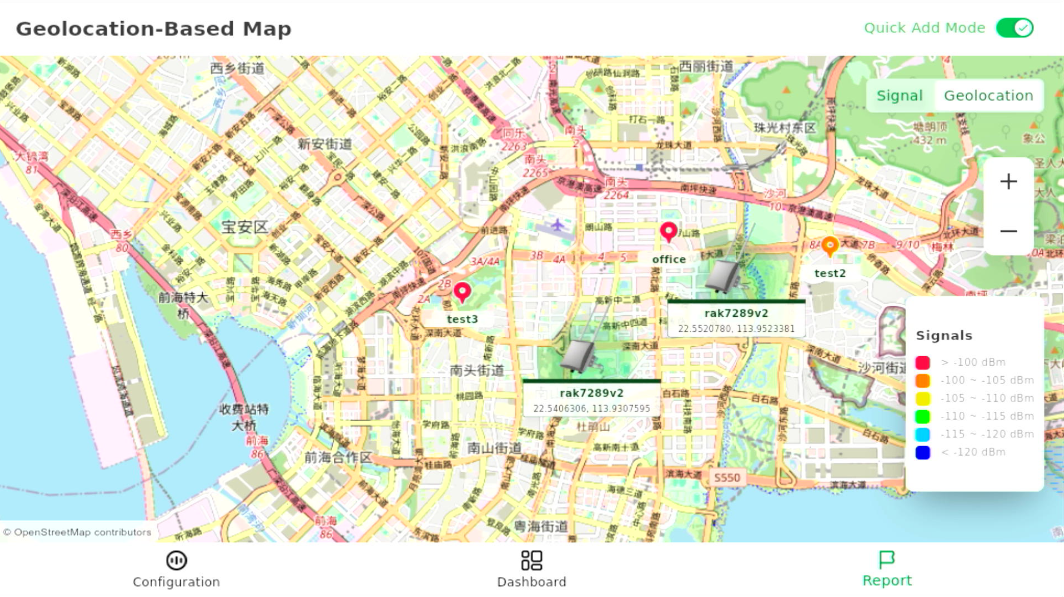 Figure 1: Gateway Location on Map
Historical Report Generation & Export
The Field Tester Pad can generate historical reports based on a selected time range. These reports include all test modes recorded during that period. You can then export the generated reports to a USB flash drive for:
- Trend analysis
- Formal network acceptance reporting
- Diagnosing fluctuating or intermittent issues
| File Type | Content |
|---|---|
| PDF Report | Contains summary results for labeled test points only, including average RSSI/SNR, packet loss, uplink/downlink statistics, the signal scatter chart, and the optional geolocation map. |
| Uplink CSV | Contains all raw uplink records, including both labeled and unlabeled data. This file provides full per-packet details for analysis. |
| Downlink CSV | Contains all raw downlink records, including labeled and unlabeled responses, useful for debugging gateway downlink behavior. |
Generate Historical Reports
- Navigate to the Report page. When the dialog appears, tap OK.
- Select a time range and tap OK.
- Tap Open Historical Report (top-right icon). The Pad will display the CSV and PDF logs generated for the selected time range.
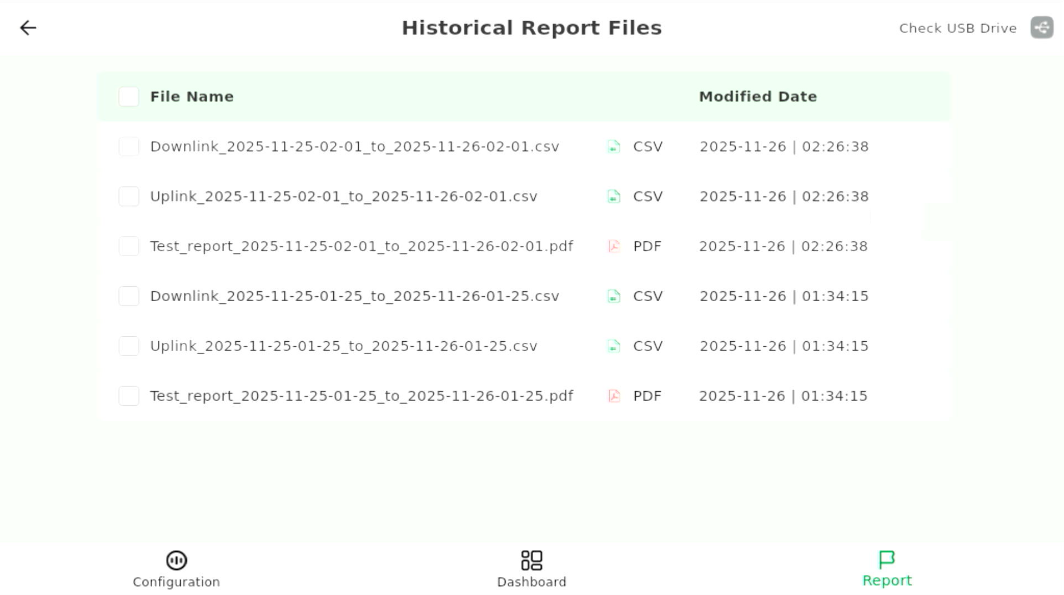 Figure 1: Historical Report Files
Export Reports
- Insert a USB flash drive into the Pad’s USB port.
- Tap Check USB Drive.
- When detected, tap Mount.
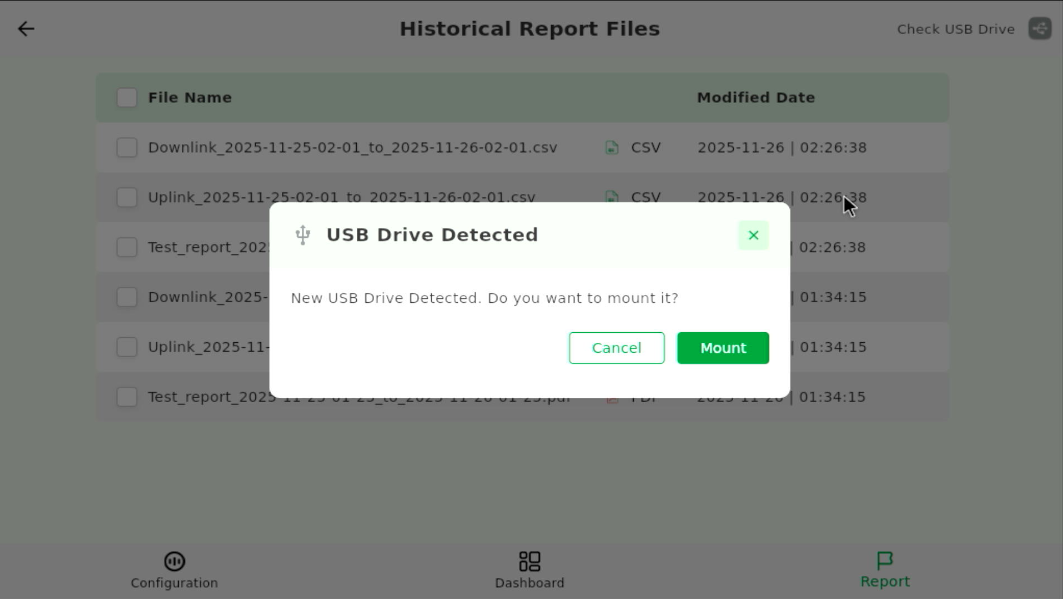 Figure 1: Mount USB Drive
 - Tap OK to confirm the USB drive is mounted.
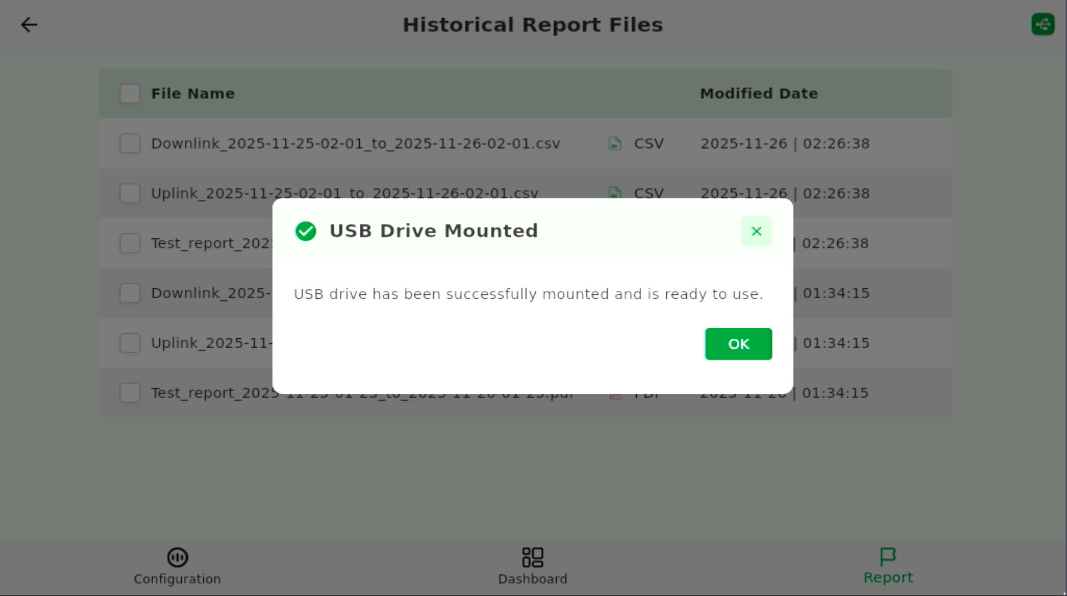 Figure 1: USB Drive Mounted
 - Select the report files you want to export.
- Tap the Download icon (top-right) to copy selected files to the USB drive.
- When the export completes, tap Yes to eject the USB device safely.
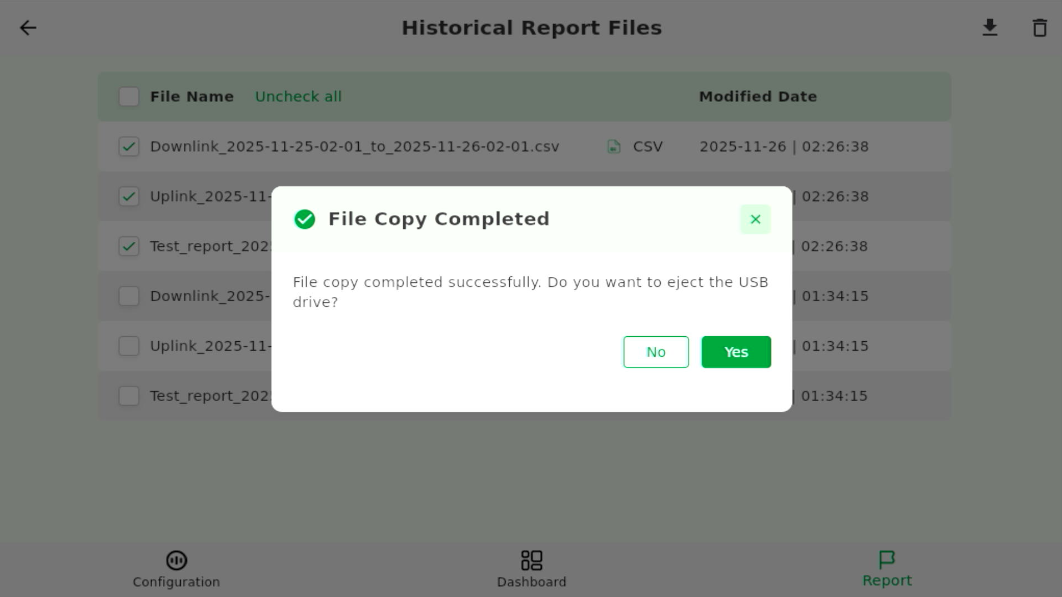 Figure 1: Eject USB Drive