Water Level Monitoring Solution LoRaWAN Network Server
Network Server and Visualization Configuration
This section outlines the operational steps for connecting the device to the network server in both the LoRaWAN and NB-IoT application scenarios.
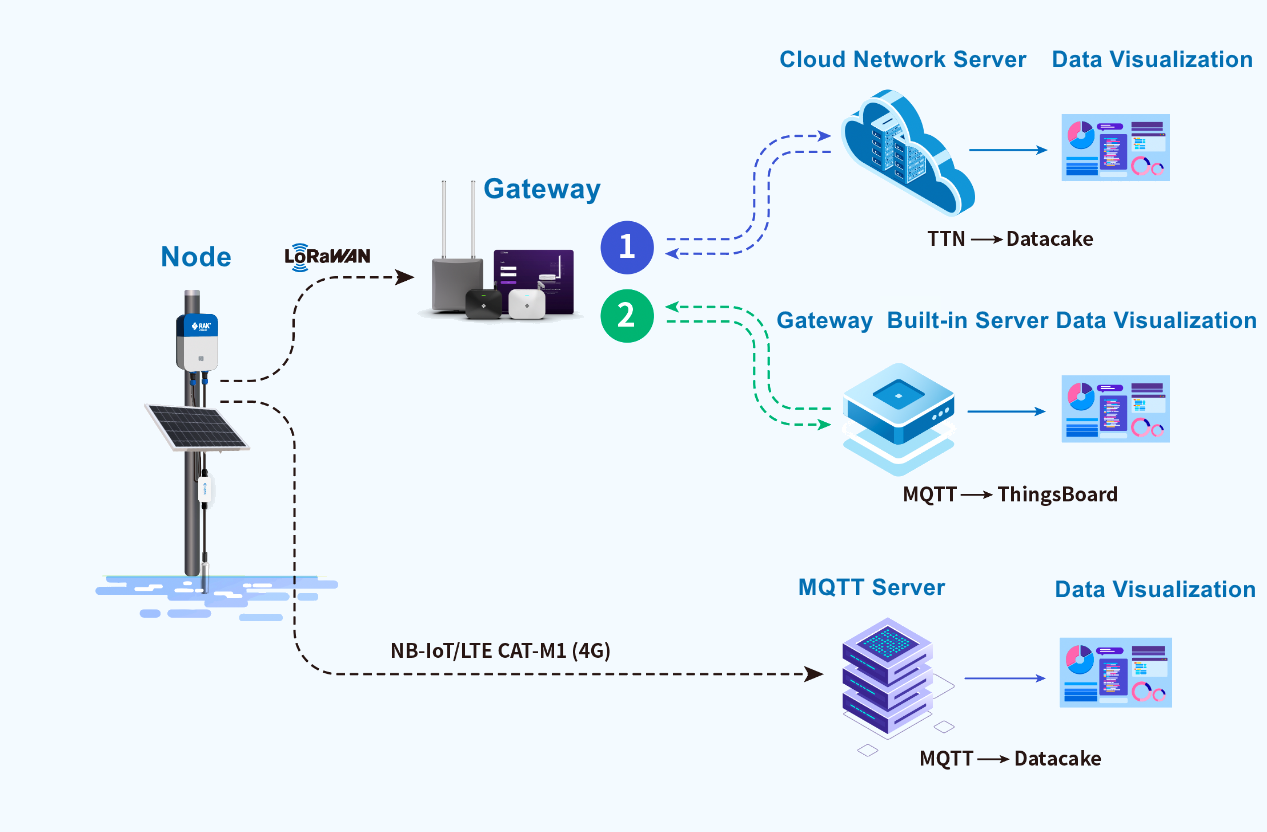 Figure 1: LoRaWAN application scenarios
LoRaWAN Application
Cloud Network Server Setup
The cloud network server deployment scenario involves connecting the gateway and devices to third-party cloud network servers. This setup integrates visualization applications to manage real-time water level data.
This section provides instructions on creating a Datacake visualization application using the TTN v3 cloud network server.
 Figure 1: Cloud network server deployment solution
Connect Gateway to TTN
For this example, you will use the TTNv3 cloud server and RAK7289 V2 WisGate Edge Lite 2 to demonstrate how to connect the RAK business gateway to a cloud server.
- Register the Gateway
- Register an account and log in to the TTN v3 website. If you already have a TTN account, you can log in with your The Things ID credentials.
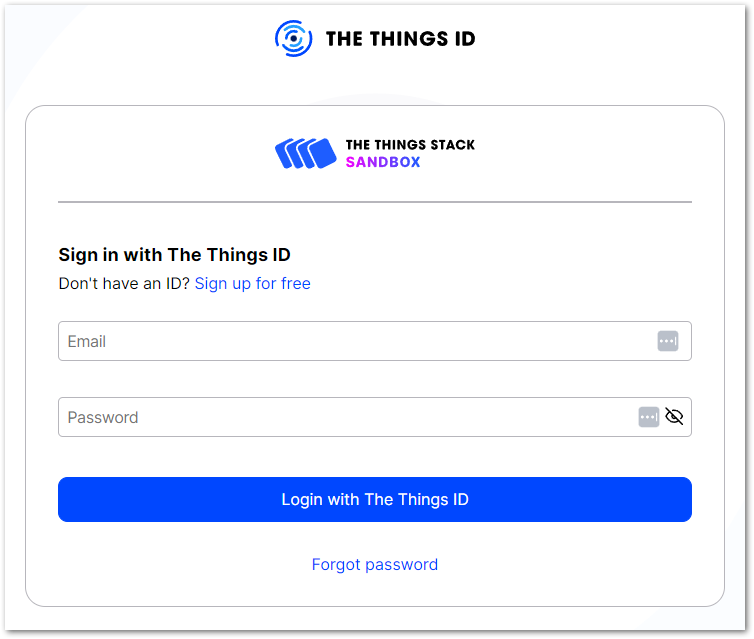 Figure 1: Log in to the TTN website
- Once logged into the site, click on Register a gateway to begin the registration process for a new gateway.
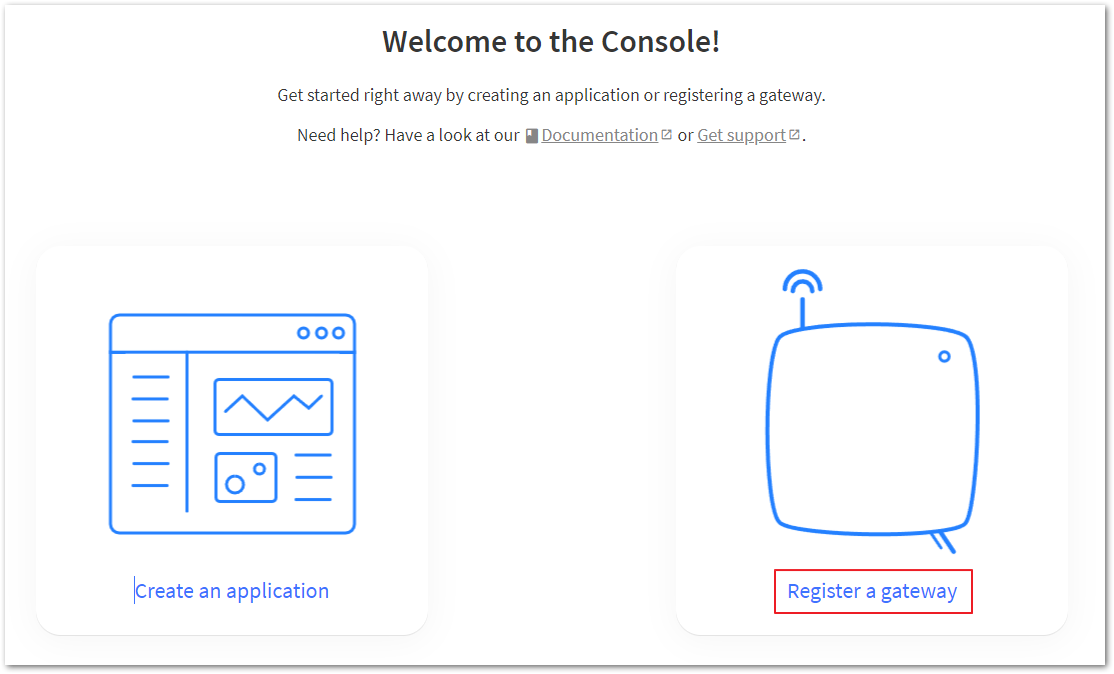 Figure 1: TTN home page
- Input the Gateway EUI and then click on Confirm to proceed.
The Gateway EUI serves as a distinct 64-bit extended identifier for the gateway, accessible from the Overview page of the gateway management platform or from the label situated behind the gateway.
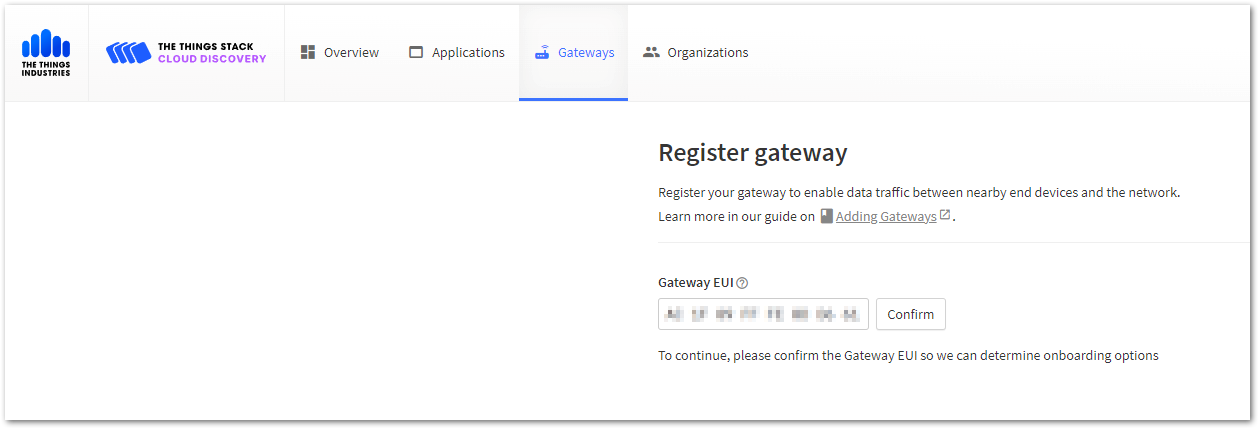 Figure 1: Enter the Gateway EUI
- Choose the appropriate frequency plan used by the gateway, and click Register gateway to complete the registration process of the gateway.
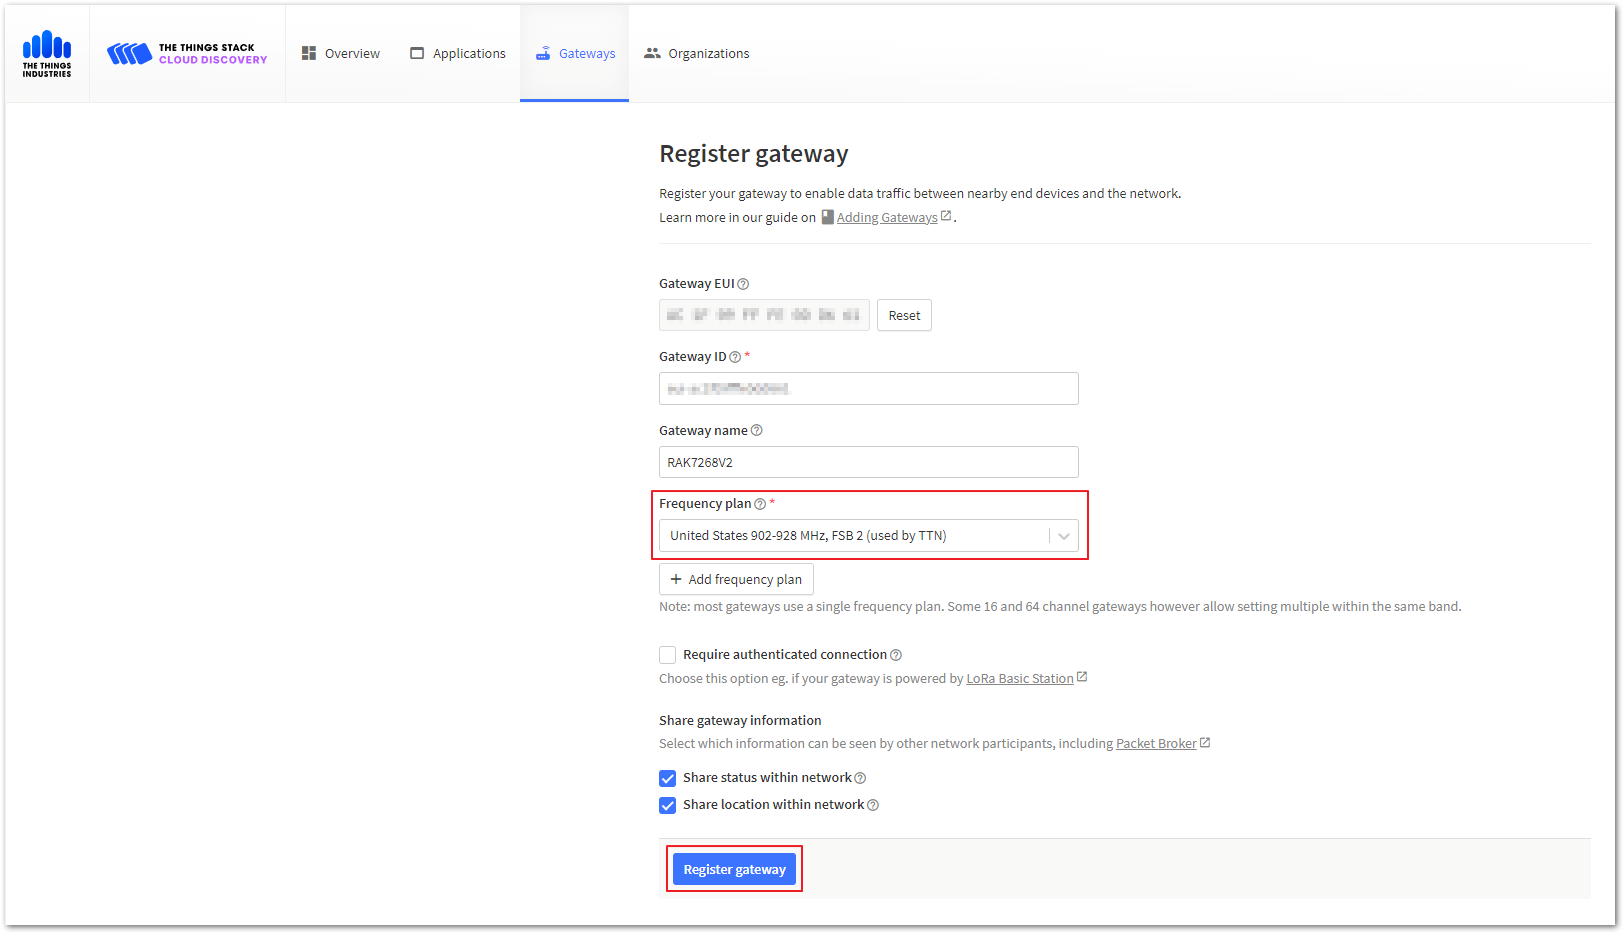 Figure 1: Configure the gateway frequency
Your gateway dashboard should look the same with Figure 7.
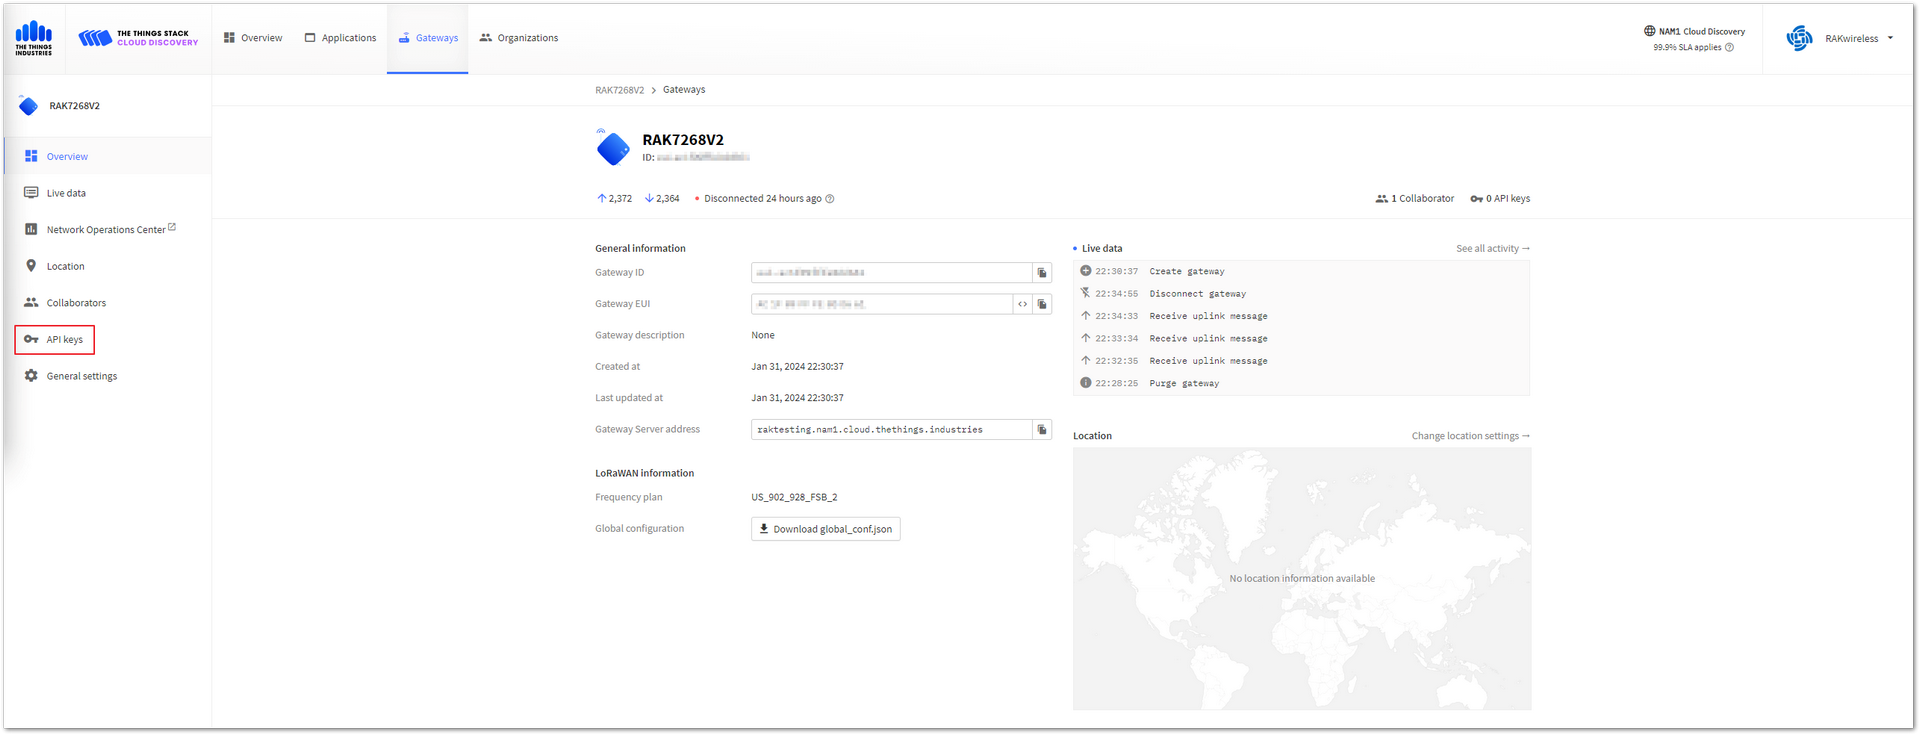 Figure 1: Adding API keys
TTNv3 supports TLS server authentication and client tokens, which require trust files and keys to configure the gateway and successfully connect to the network.
- To generate a key file, navigate to API keys from the Overview page of the registered gateway, then click on Add API key.
 Figure 1: Add API keys
- In the Add API key page, set the Name field, tick off the checkboxes, then click Create API key.
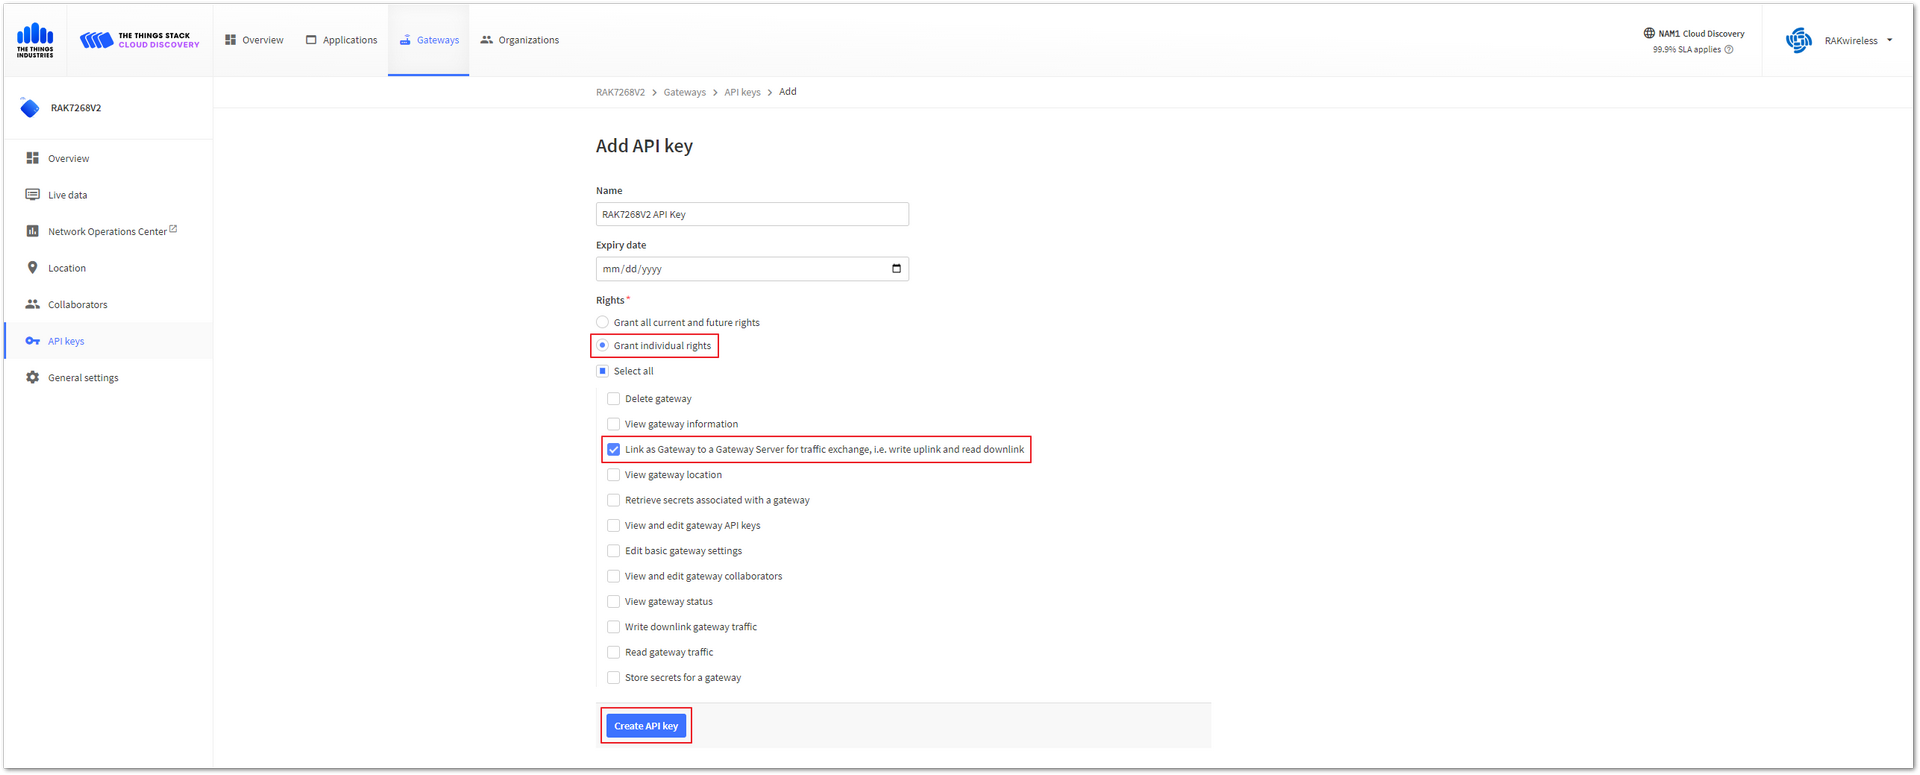 Figure 1: Configure the API Key
- A new window pops up with the generated key. Copy the new API key by clicking the icon and then the I have copied the key button.
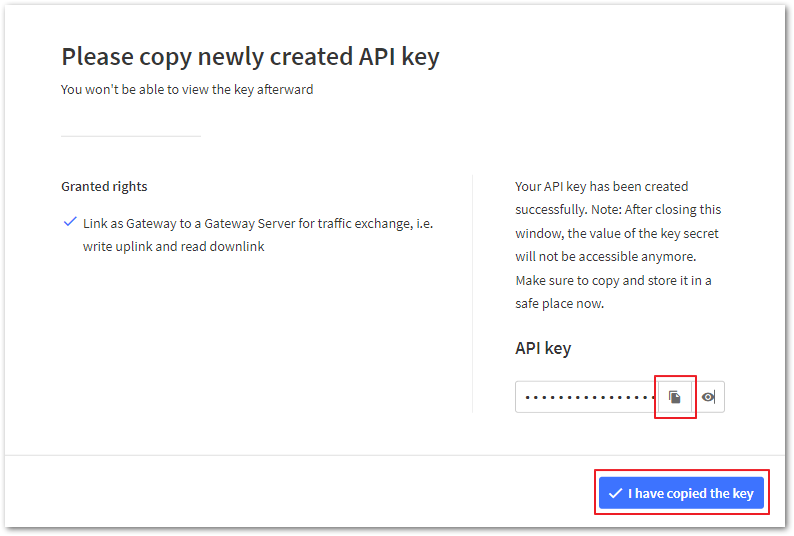 Figure 1: Copy and save the API Key
- Navigate back to the gateway management platform Web UI. Click on the left navigation bar to access the LoRa > Configuration tab. Complete the following settings and save them.
- Basics Station Server Type: LNS Server
- Server URL:
wss://eu1.cloud.thethings.network - Server Port:
8887 - Authentication Mode: TLS server & Client Token Authentication
- Trust (CA Certificate): Download the certificate.
- Client Token: Copied API Keys
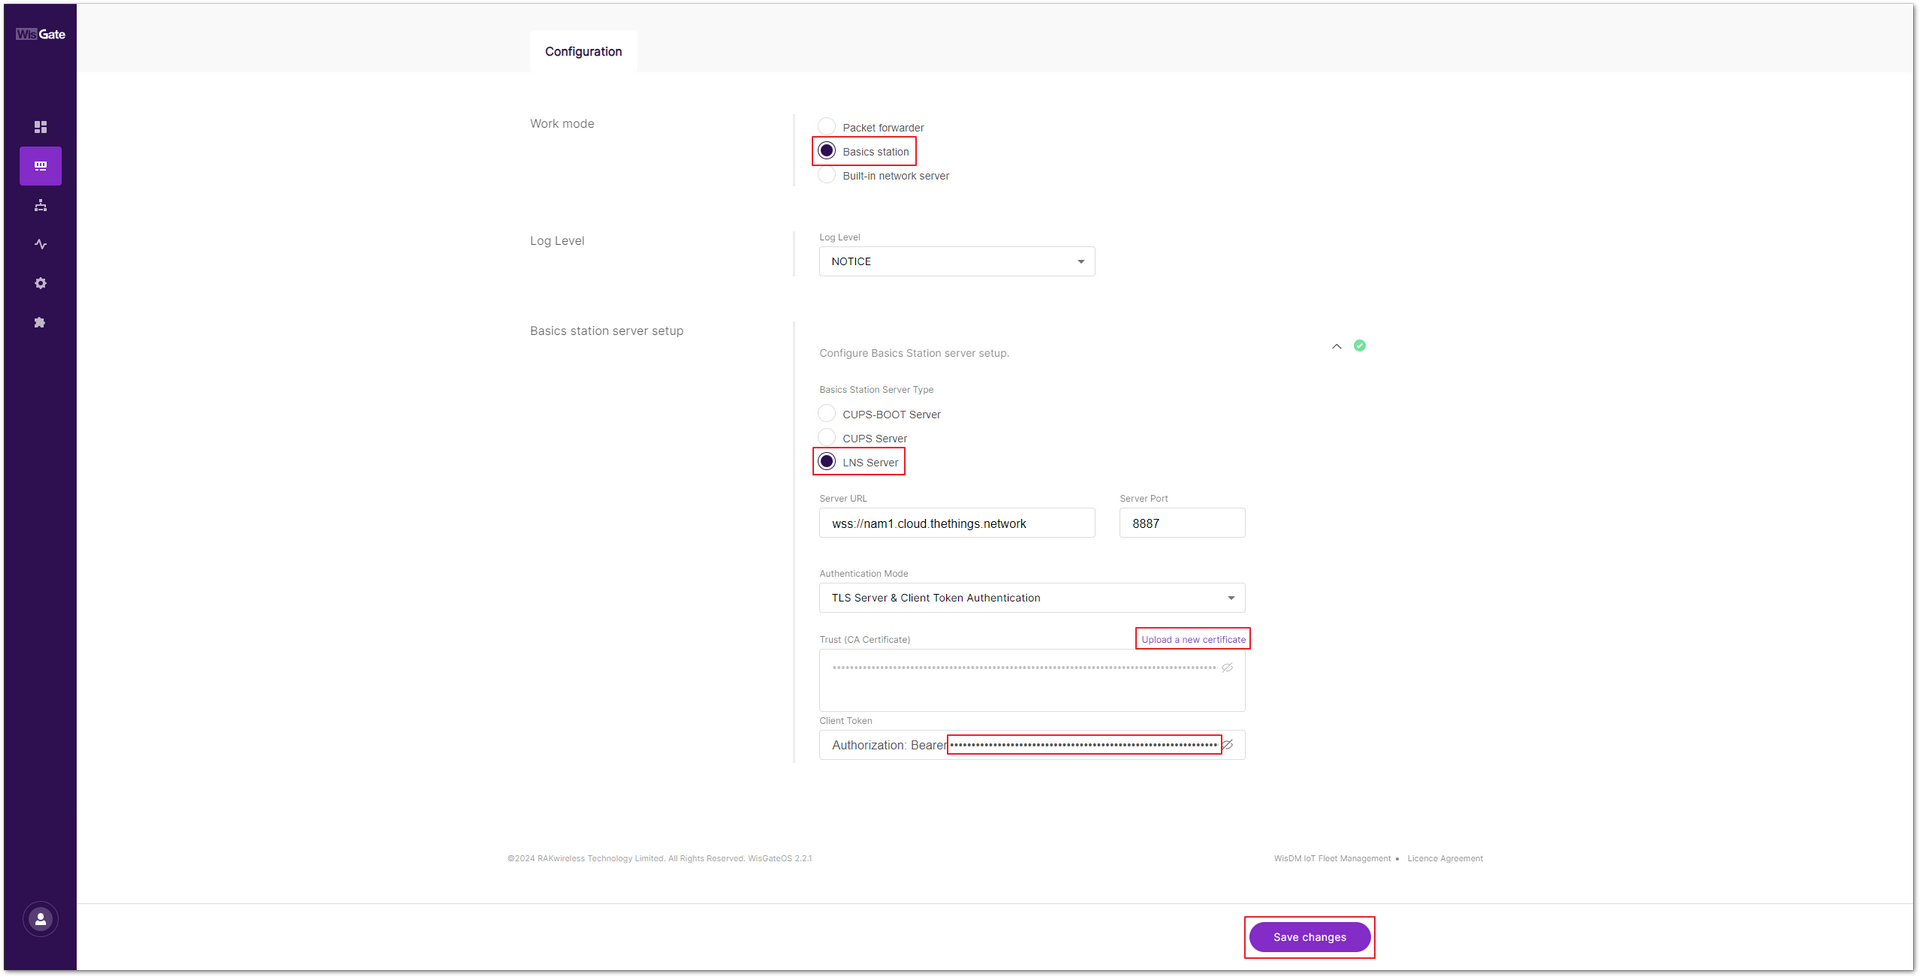 Figure 1: Configure the gateway
- After saving the changes, return to the TTN gateway interface, and navigate to the Gateways tab to confirm that the gateway is now connected to TTNv3 as a Basics Station.
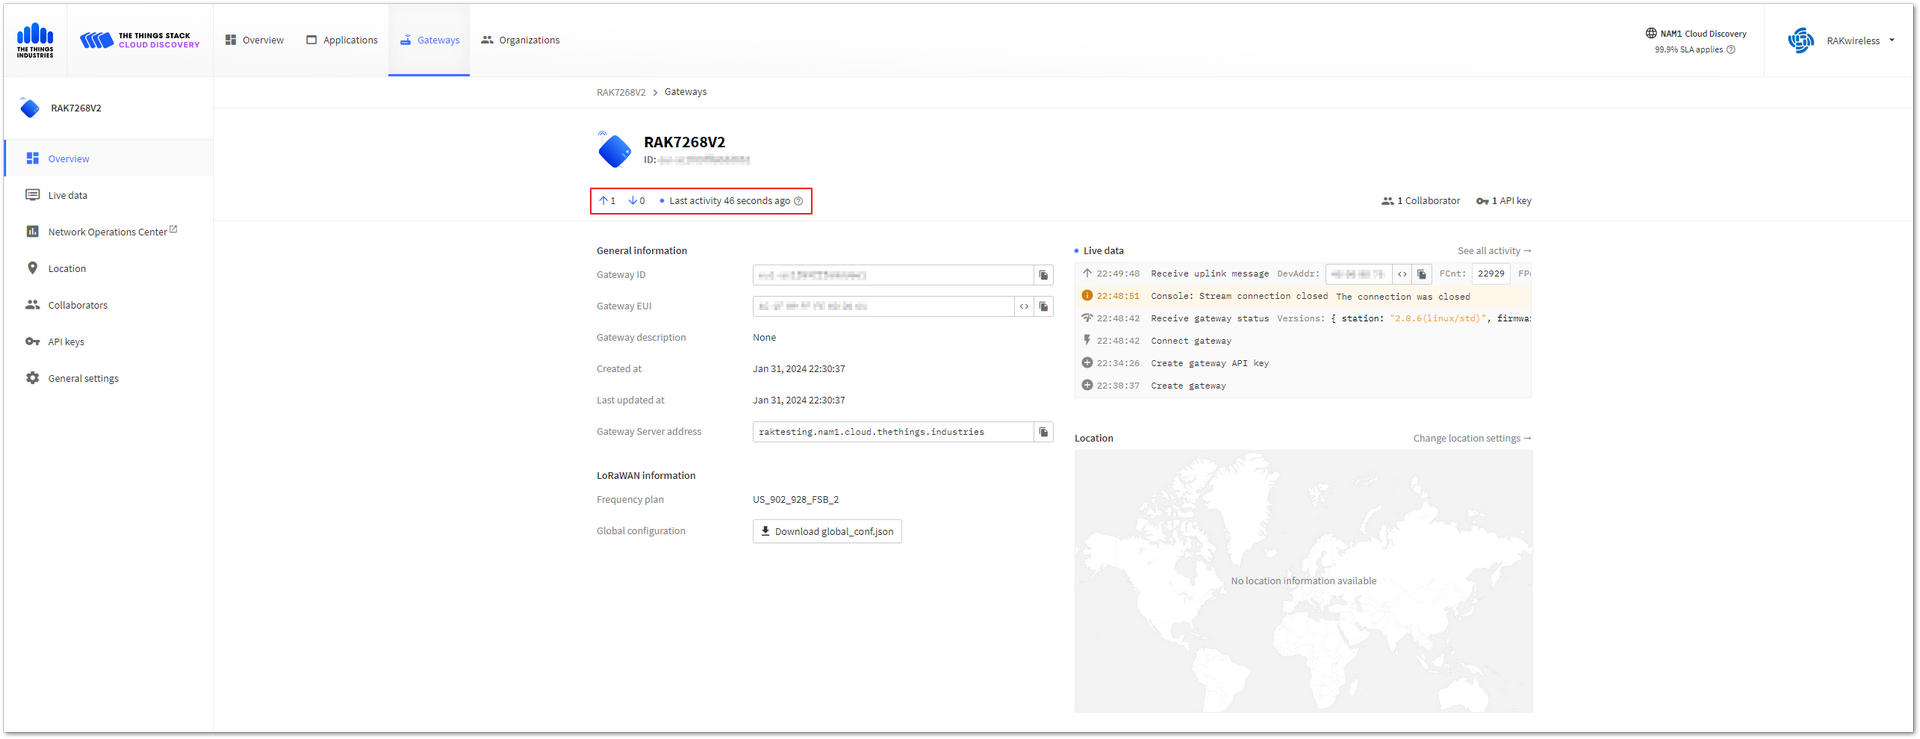 Figure 1: Gateway connected successfully
Connect Sensor Hub to TTN
- Return to the TTNv3 homepage and select Create an application to add a node.
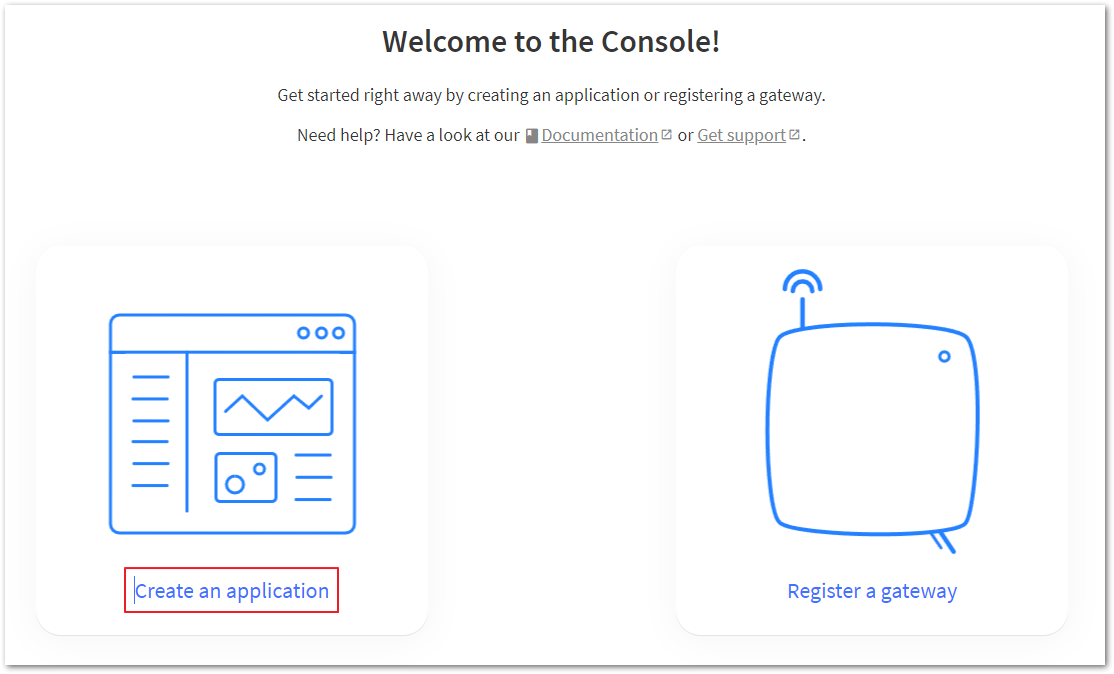 Figure 1: Select Create application
- Click +Create application to initiate the creation of a node.
 Figure 1: Create a new application
- Enter the desired Application ID in the provided field, then click on Create application.
 Figure 1: Enter the application ID
- Click on the +Register end device button to add a new end device to the application.
 Figure 1: Add the end device
- Set the parameters of the end device, as shown in Figure 17.
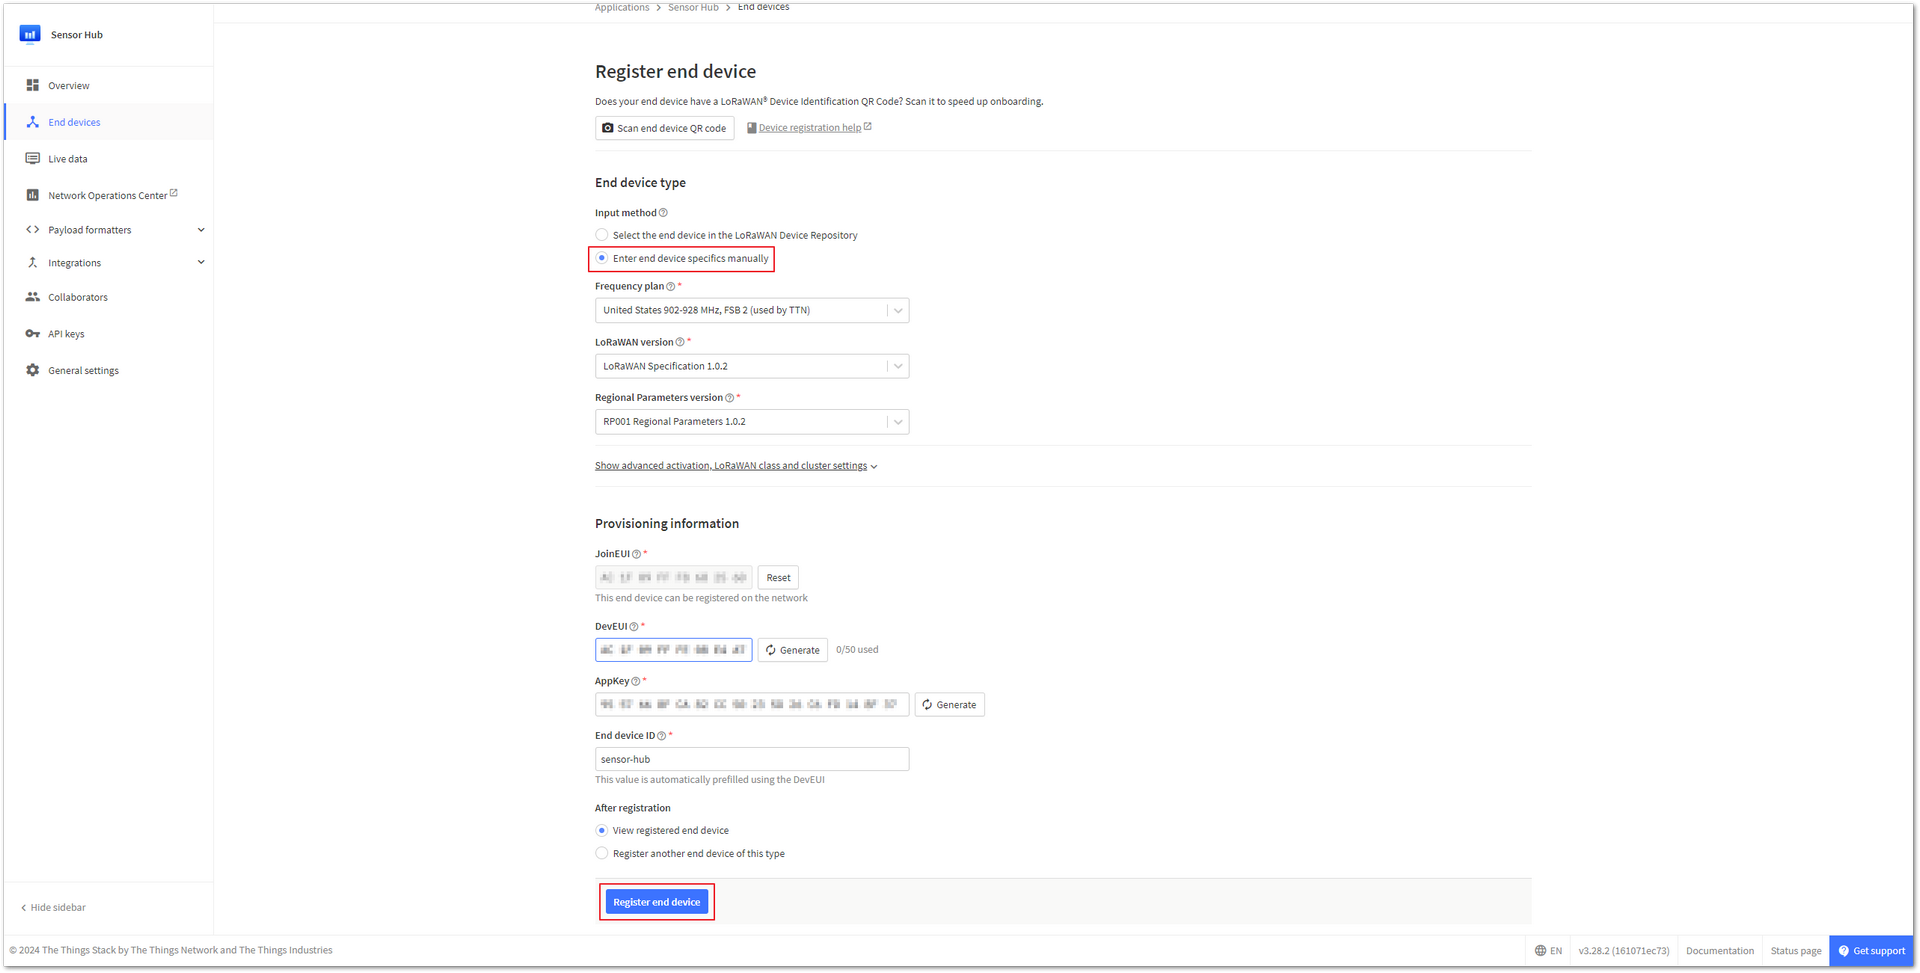 Figure 1: End device parameters
- JoinEUI, DevEUI, and AppKey can be automatically generated by clicking Generate on the TTN web page or customized by the user.
Ensure that the three parameters - JoinEUI, DevEUI, and AppKey - are consistent with the parameters set in the WisToolBox application.
- After completing the settings, return to the WisToolBox app, and click JOIN NETWORK to send the end device network access request.
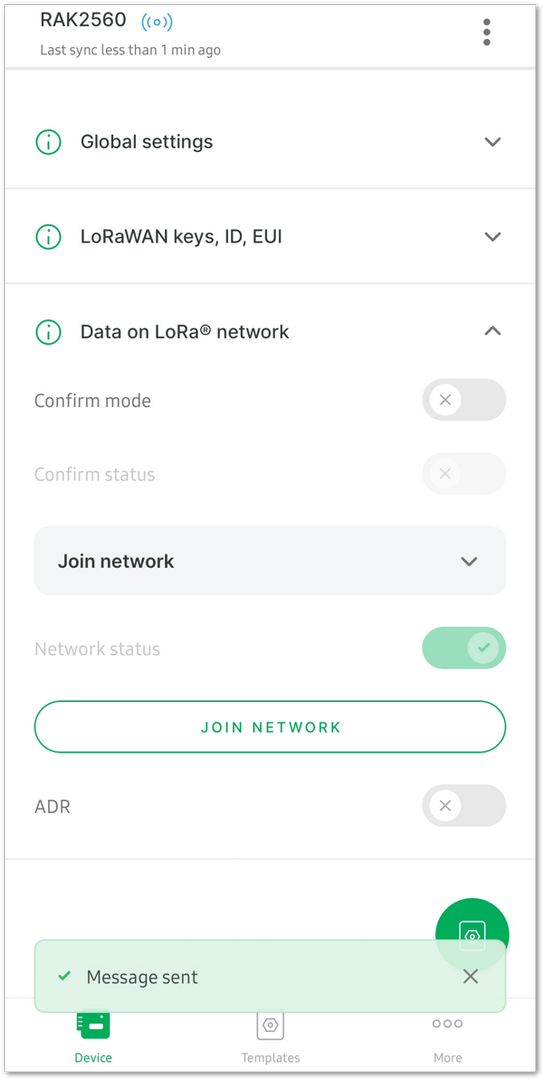 Figure 1: Sending end device network join request
- As shown in Figure 19, the Sensor Hub has successfully joined the TTNv3 network server.
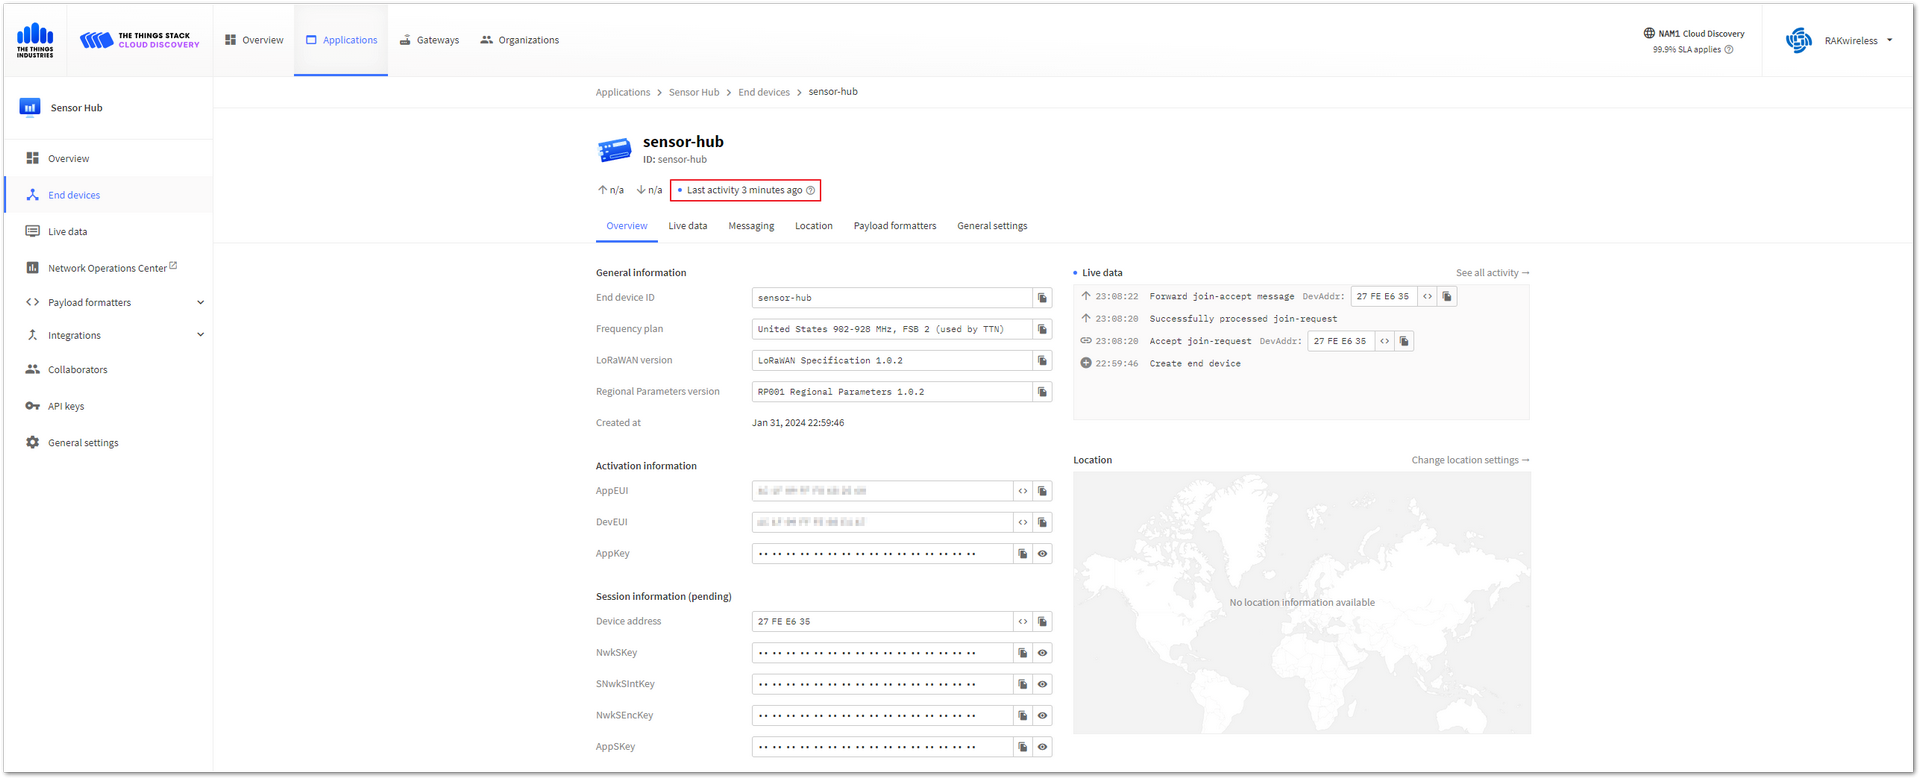 Figure 1: Successfully joined the TTNv3 network server
Visualize Data Through Datacake
Datacake is a versatile IoT platform. It offers a range of features tailored for effective data visualization and management, making it a preferred choice for IoT projects requiring efficient monitoring and analysis.
Create Datacake Integration- In the TTN console, navigate to Integrations on the sidebar, proceed to the Webhooks section, and then click +Add webhooks to set up an integration.
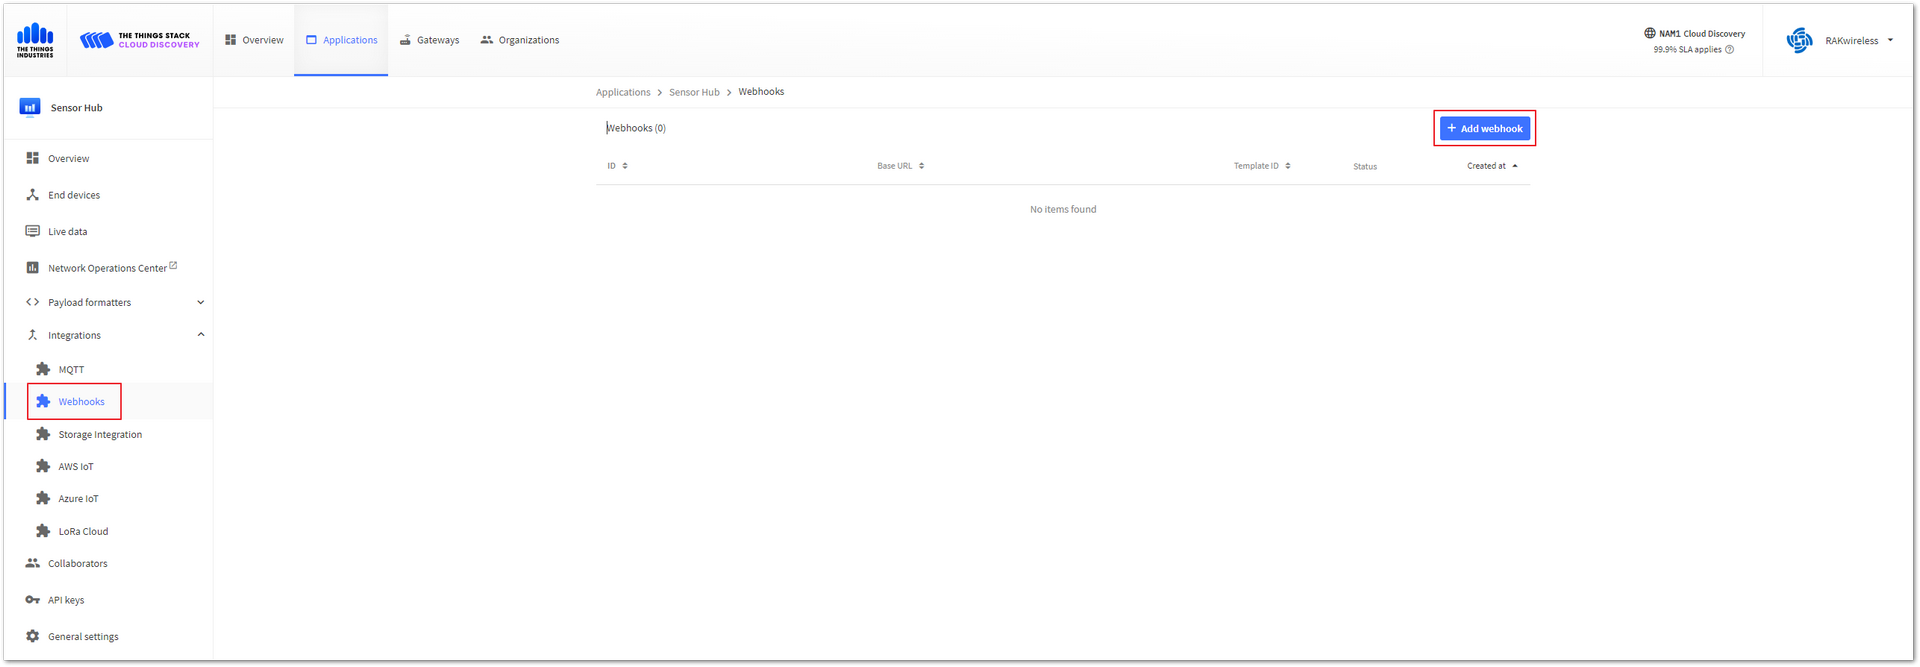 Figure 1: Adding an integration
- From the list of webhook templates, select the Datacake template.
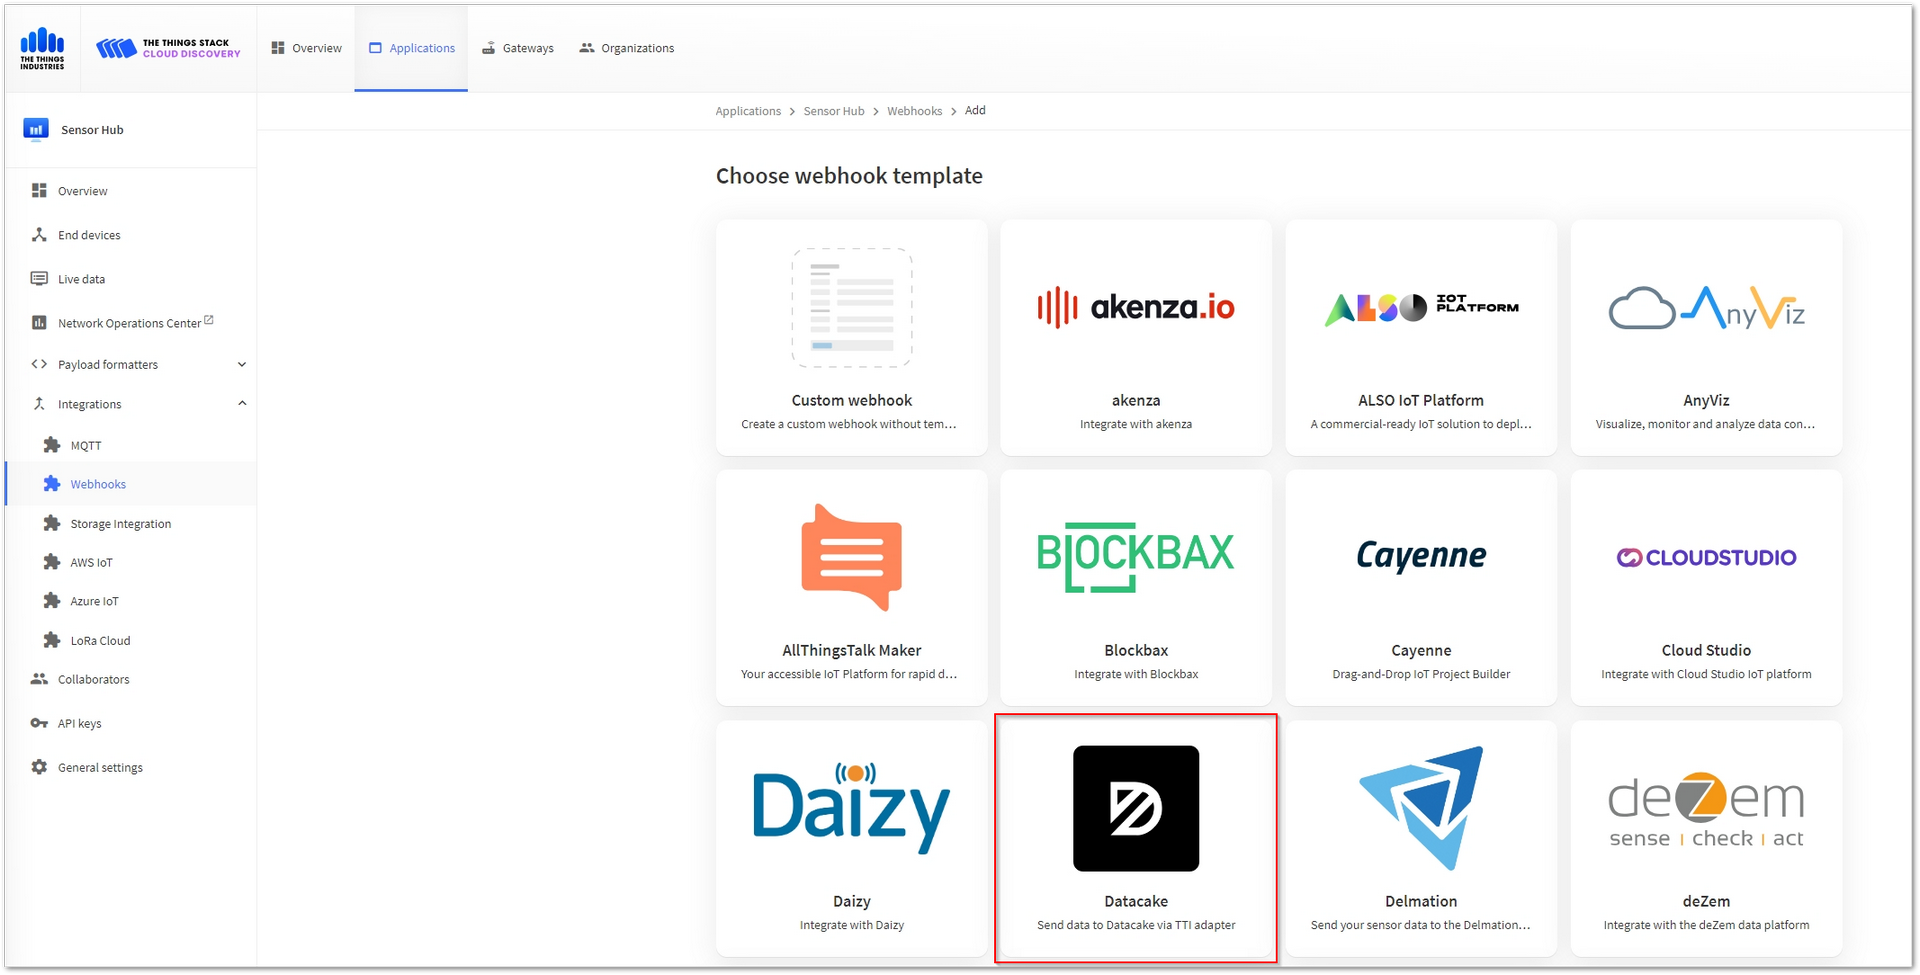 Figure 1: Select the Datacake template
- Generate an API key for webhook authentication on Datacake. To get started, register a Datacake account, and then log in.
 Figure 1: Log in to the Datacake IoT platform
- Navigate to the Datacake workspace. Select Members on the sidebar, and switch to the API Users, and then click the Add API User button.
 Figure 1: Add API User
- Enter the name of the API User, for instance, TTS API. Set the relevant parameters accordingly and click Save to finalize the creation process.
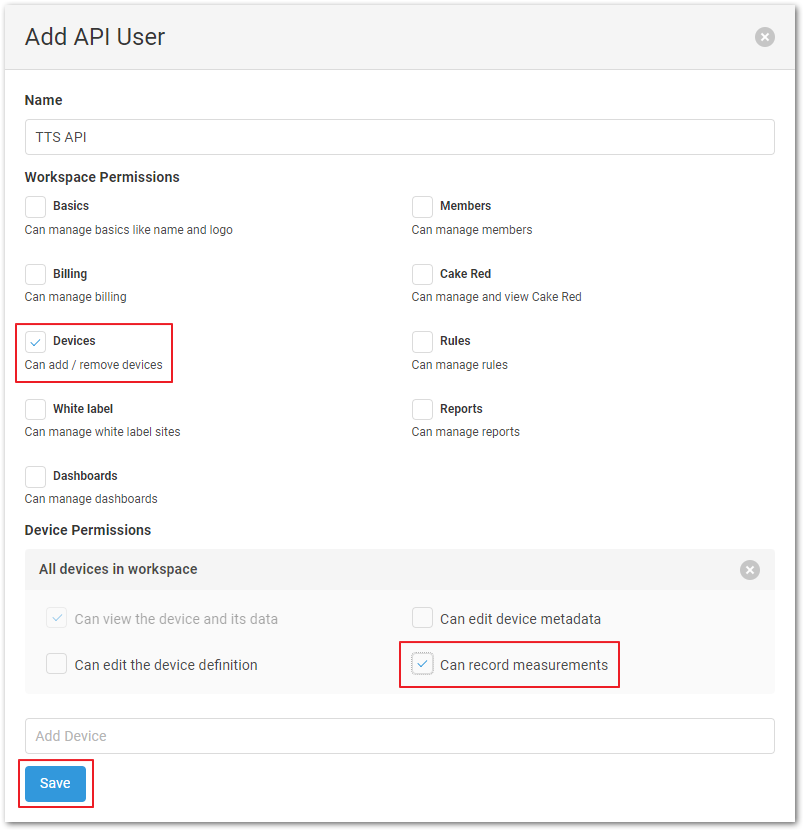 Figure 1: Set Parameters
- Click the Copy button to copy the generated Datacake API Token.
 Figure 1: Copy the generated Datacake API Token
- Back on the TTN website, enter sensorhub in the Webhook ID field (as an example), and paste the Datacake API Token you previously copied into the Token field. Click the Create Datacake Webhook button to generate the Datacake Webhook.
 Figure 1: Create the Datacake Webhook
- To add a new device, select Devices in the sidebar and click the +Add Device button.
 Figure 1: Add a device
- Choose LoRaWAN from the options and click Next to proceed.
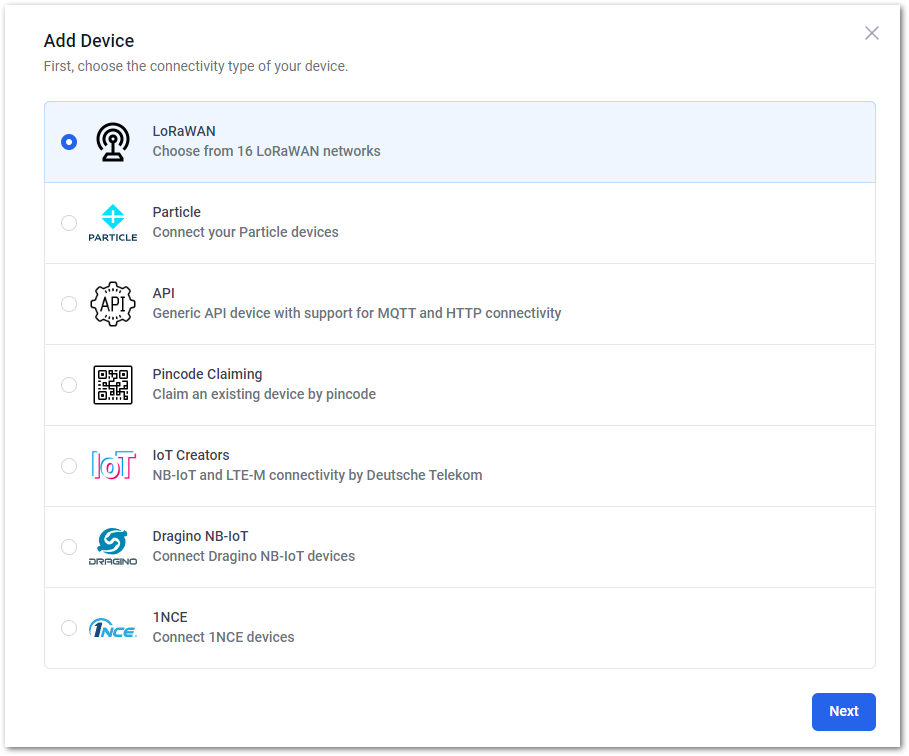 Figure 1: Choose LoRaWAN connectivity
- As the Sensor Hub is a new device, there is no pre-existing template. Create a template by clicking New Product, enter the Product Name, and click Next to proceed.
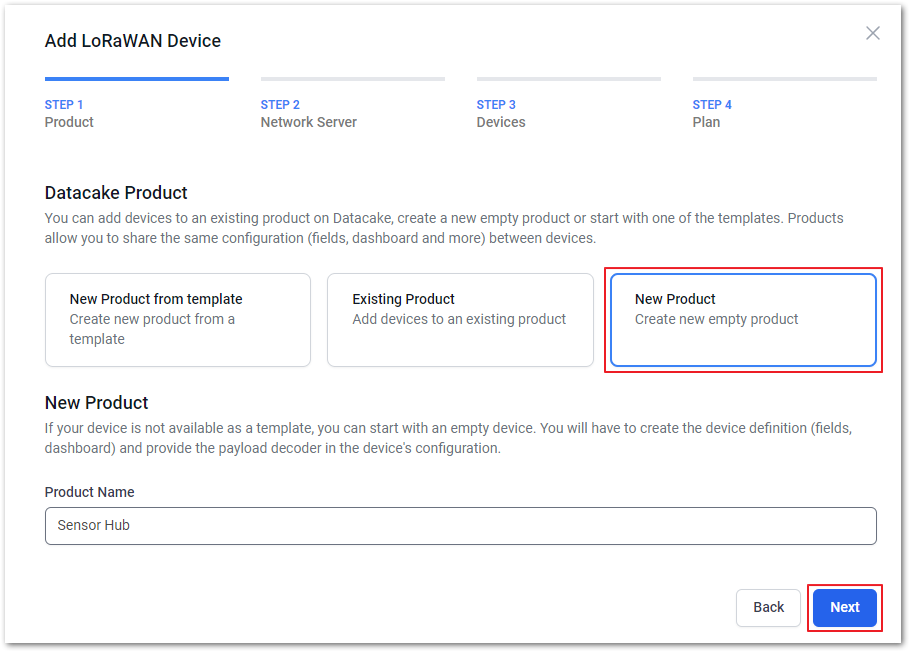 Figure 1: Create a New Product
- Choose a network server for your device. In this guide, select The Things Stack V3, then click Next to continue.
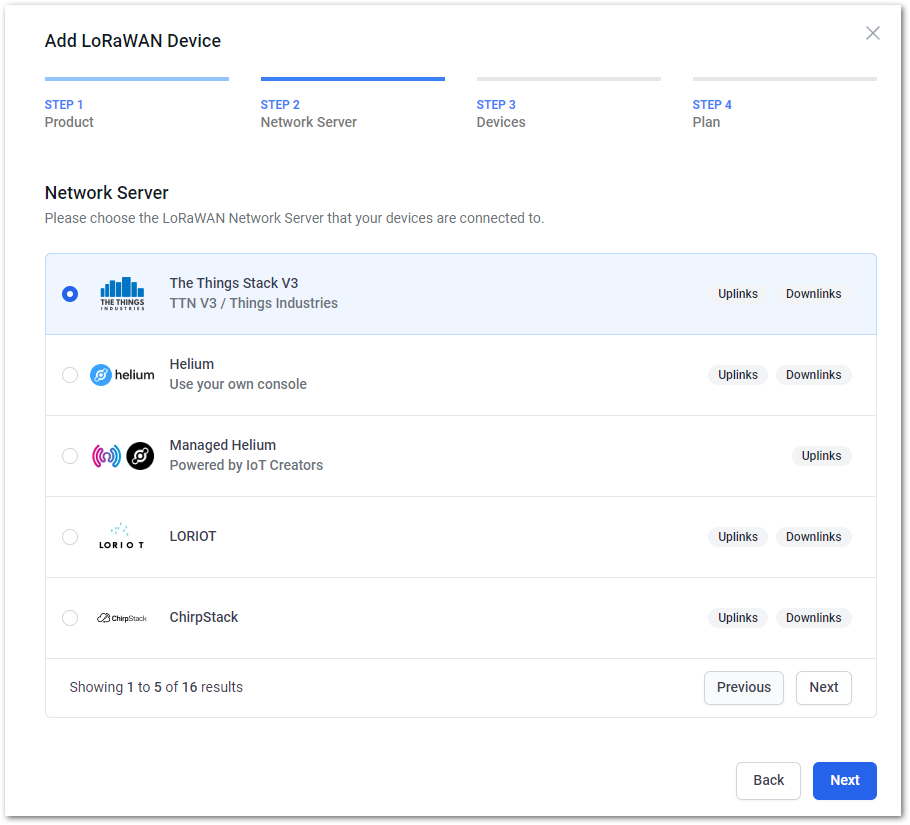 Figure 1: Select the Things Stack V3
- In the Step 3 Devices tab, enter the device DEVEUI and NAME fields, and click Next to continue.
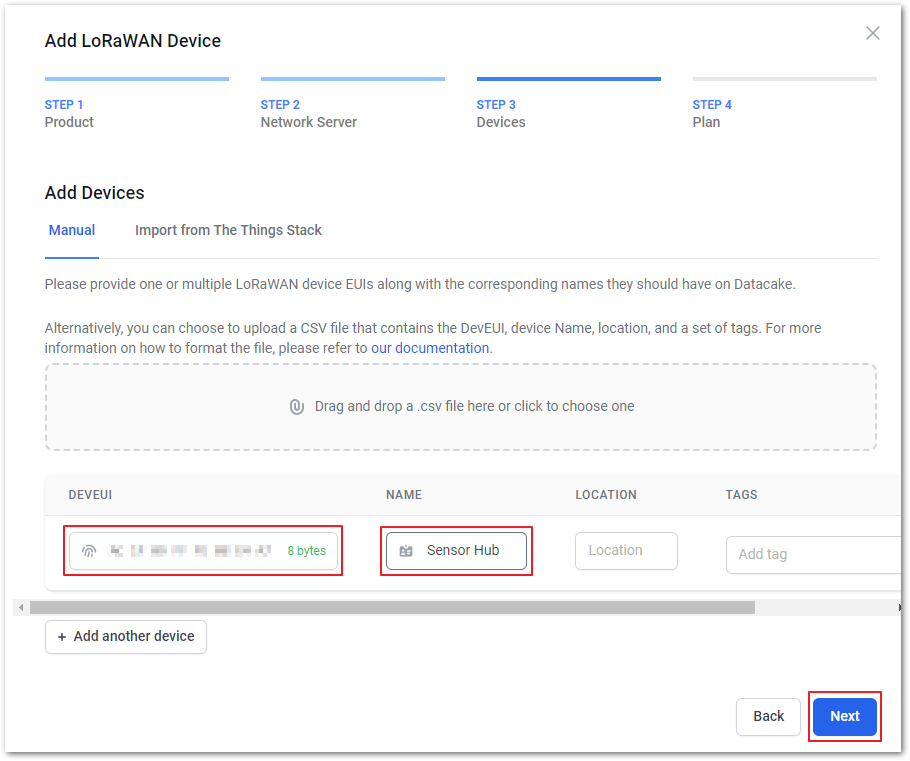 Figure 1: Add DEVEUI and Name
- In Step 4 Plan, select the preferred subscription plan, and click Add 1 device to add the device. For this example, choose Free.
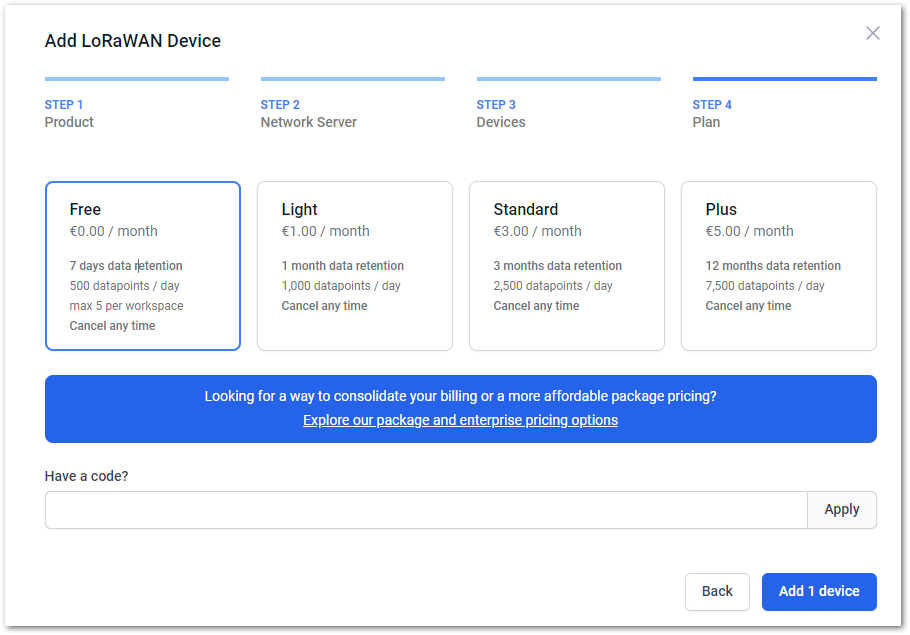 Figure 1: Select a subscription plan
- The registered device can now be viewed on the Devices tab.
 Figure 1: Registered device
Create a Payload Decoder
- Click the successfully registered device and go to the Configuration tab. Scroll down to the Payload Decoder field, then copy and save the decoder code.
 Figure 1: Configuration tab
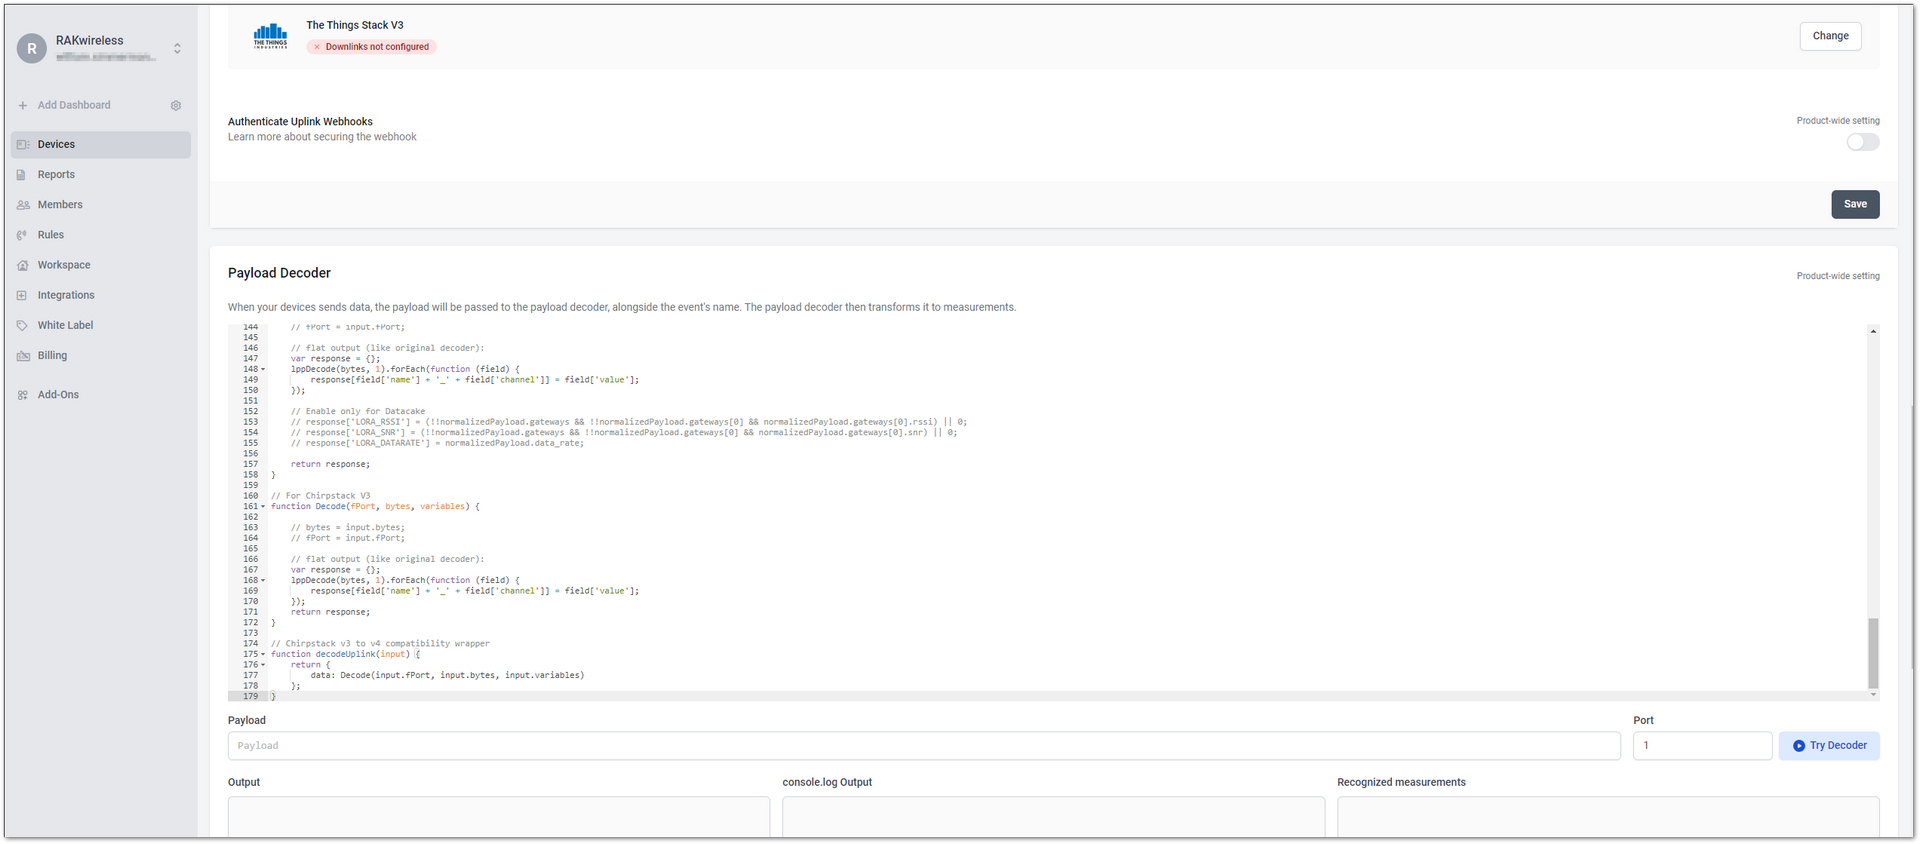 Figure 1: Decoder code
details Click to view the decoder code
function Decoder(bytes, port) {
    var decoded = {};

    function value(bytes) {
        var value = (bytes[1] << 8) | bytes[0];
        value = twosComplement (value, 16);
        return value;
    }

    var offset = 0;
    while (offset < bytes.length ) {
        var channel_id = bytes[offset++];
        var channel_type = bytes[offset++];
        if ( channel_id === 0x01 && channel_type === 0x02) {
            var current = (bytes[offset++] * 256 + bytes[offset++]) / 100;
            // Measuring ranges: 0-5m, output signal: 4-20mA
            decoded.water_level = (0.3125 * current - 1.25). toFixed (3) ;
        }
        else {
            break;
        }
    }

    return decoded;
}
- Displace the menu bar to the +Add Field section and click +Add Field.
 Figure 1: Add Field
- The Add Field window appears. Fill out the fields shown in Figure 37 to configure the stored data in the device.
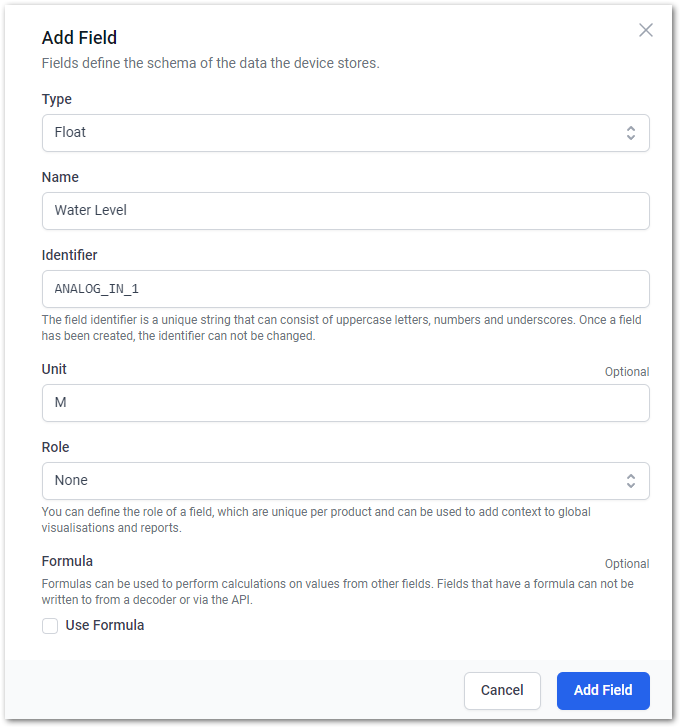 Figure 1: Configuration fields
- Enter an appropriate name in the Name field.
- The Identifier field will be automatically filled in based on the name.
- When an uplink is received, refresh the page and the CURRENT VALUE field will be updated.
- Leave everything else as default, and click Add Field to complete the setup.
- When completed, it will look the same, as shown in Figure 38.
 Figure 1: Successfully added fields
- To create a dashboard, toggle the edit mode (
 ) on the device Dashboard tab.
 Figure 1: Turn on the edit mode switch
- Click +Add Widget to add a visualization widget.
 Figure 1: Add visualization widget
- Select Value from the menu to create a new dashboard.
 Figure 1: Select Value to create a new dashboard
You can select different types of widgets to accommodate various data formats.
- In the Title field under the Basics tab, name the widget as Water Level.
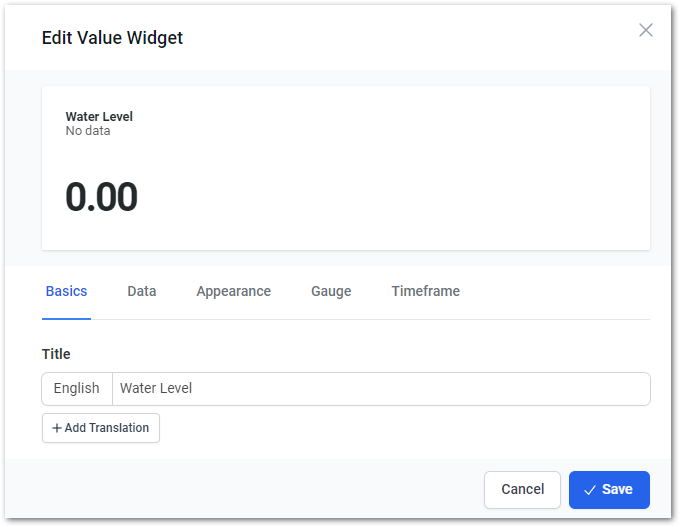 Figure 1: Name the widget
- Under the Data tab, click the Field dropdown arrow, select Water Level, and set the unit to M.
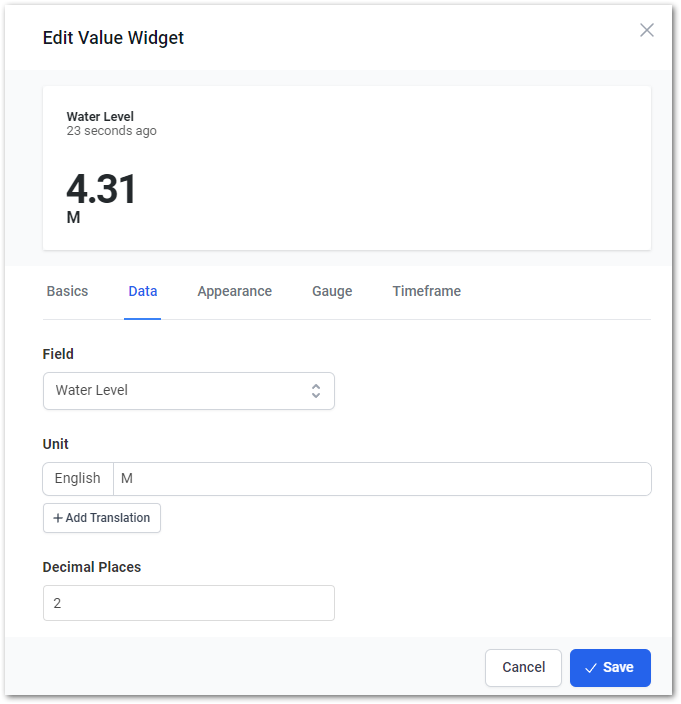 Figure 1: Setting Parameters
- Under the Gauge tab, select the gauge type and color, set the range of values for the widget, and then click Save.
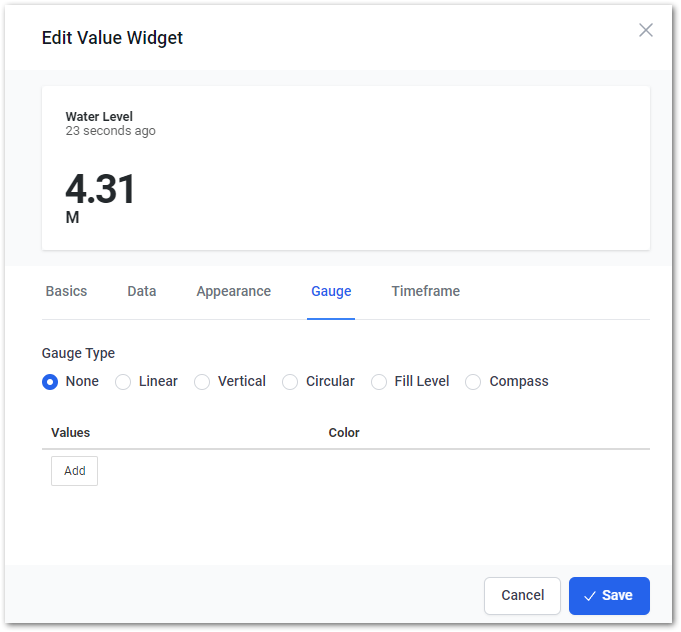 Figure 1: Set Gauge
- When you finish adding the widgets, turn off the edit mode switch to save the edits.
 Figure 1: Added Widget
Built-In Network Server Setup
The RAK gateway comes with a built-in NS, which eliminates the need to deploy NS in the cloud or locally. This gateway is suitable for small-sized industrial application scenarios and offers various advantages such as cost savings, reduced R&D investment, high execution efficiency, and shorter delays.
The built-in network server of the RAK gateway provides MQTT and HTTP integration that allows for post-processing data and implementing solutions based on the needs.
This section will use the public MQTT broker integration as an example to demonstrate how to use the built-in network server to create a visualization application on ThingsBoard.
 Figure 1: Gateway built-in NS application scenario
Configure the ThingsBoard
- Log in to ThingsBoard. If you don't have an account yet, create one before proceeding.
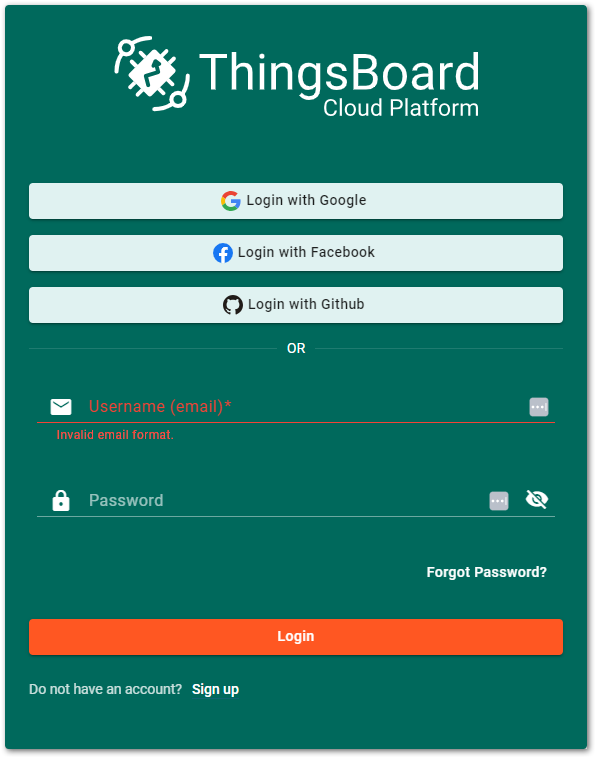 Figure 1: ThingsBoard authentication page
- After successfully logging in, you will be directed to the ThingsBoard homepage.
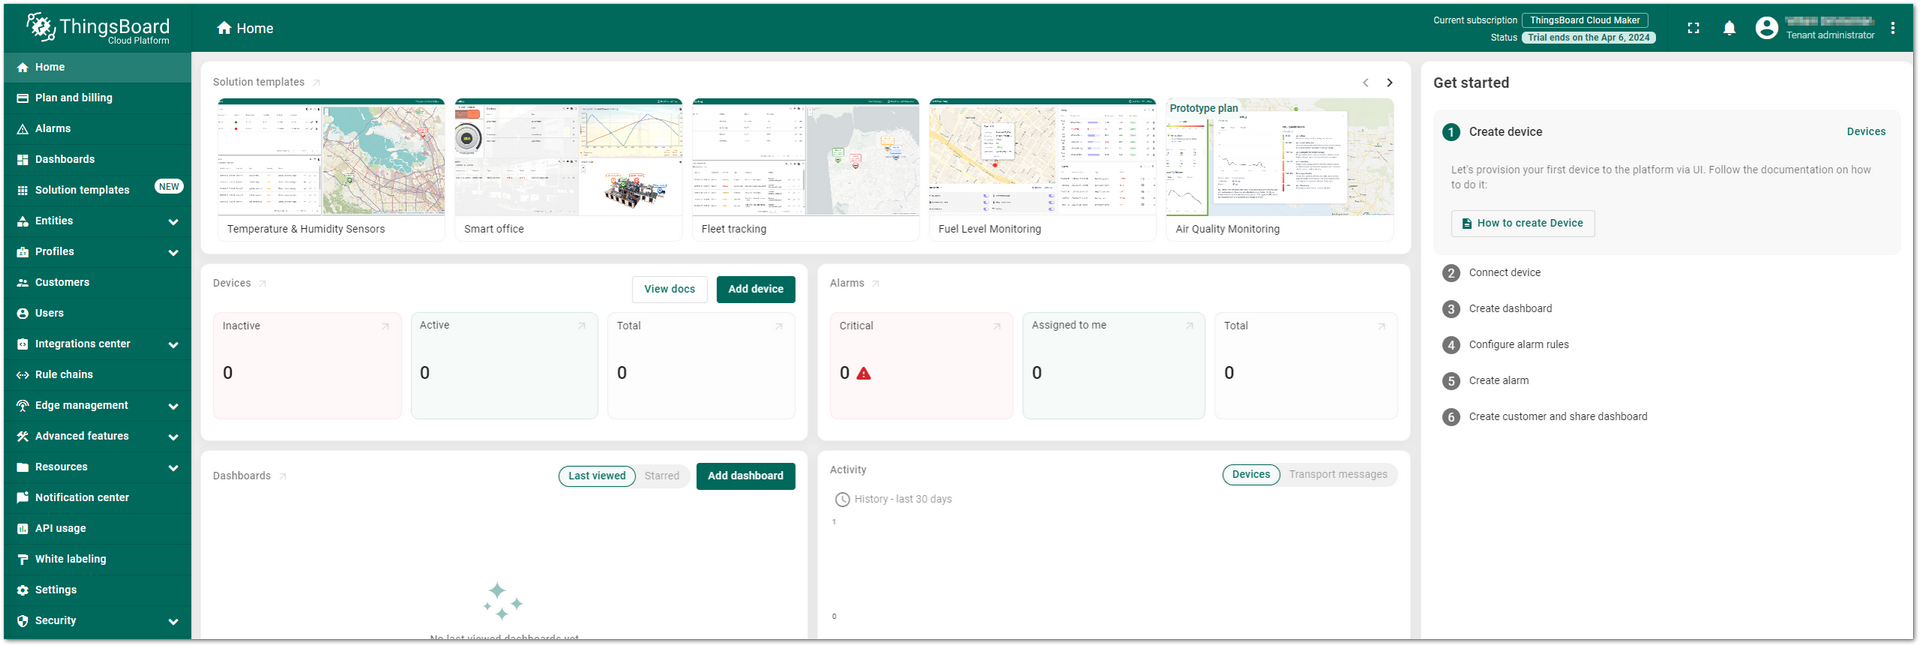 Figure 1: ThingsBoard homepage
- Navigate to Integration center > Data converters in the left navigation tree to create a data converter for the uplink.
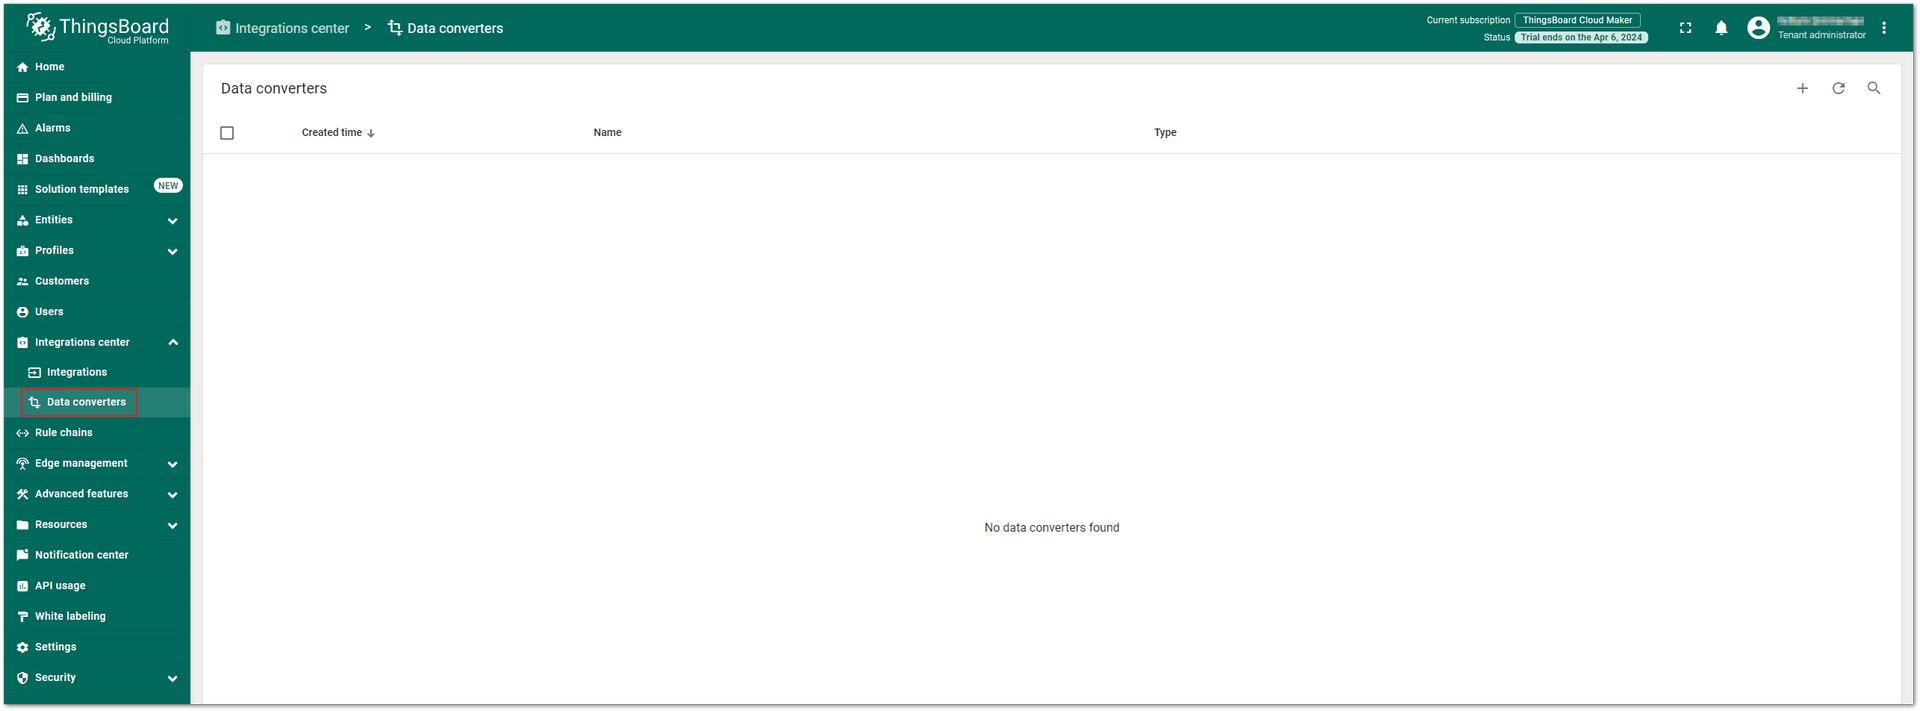 Figure 1: Create a data converter
- Click the Add Data Converter icon (
 ) and choose the Create new converter option.
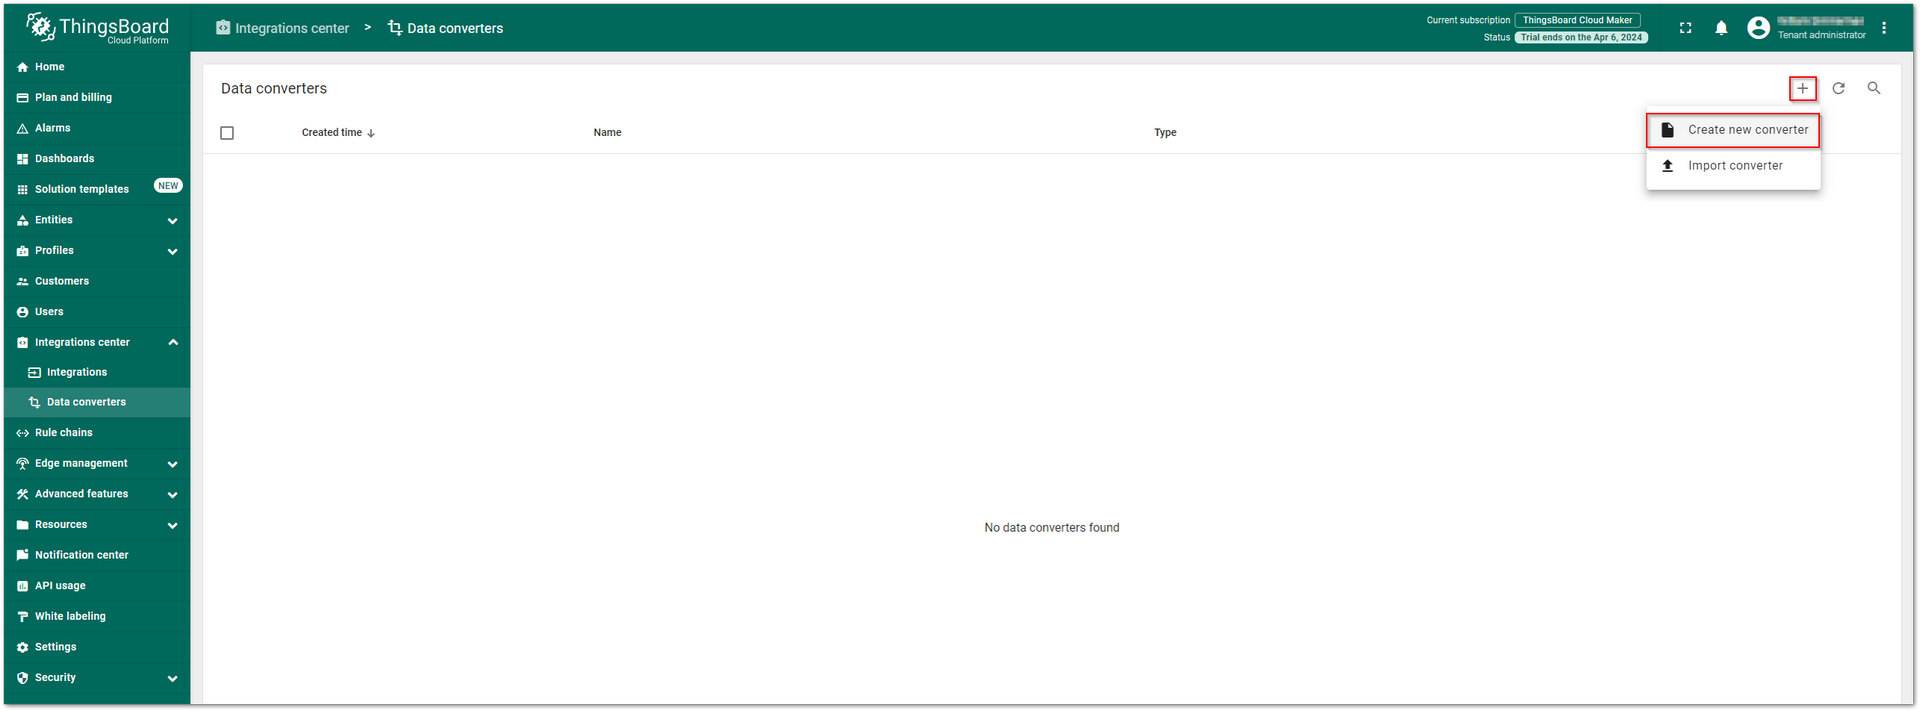 Figure 1: Create a data converter
- Enter the name of the decoder in the Name field (for example, Uplink decoder), leave the Type field as Uplink, and select the JavaScript option.
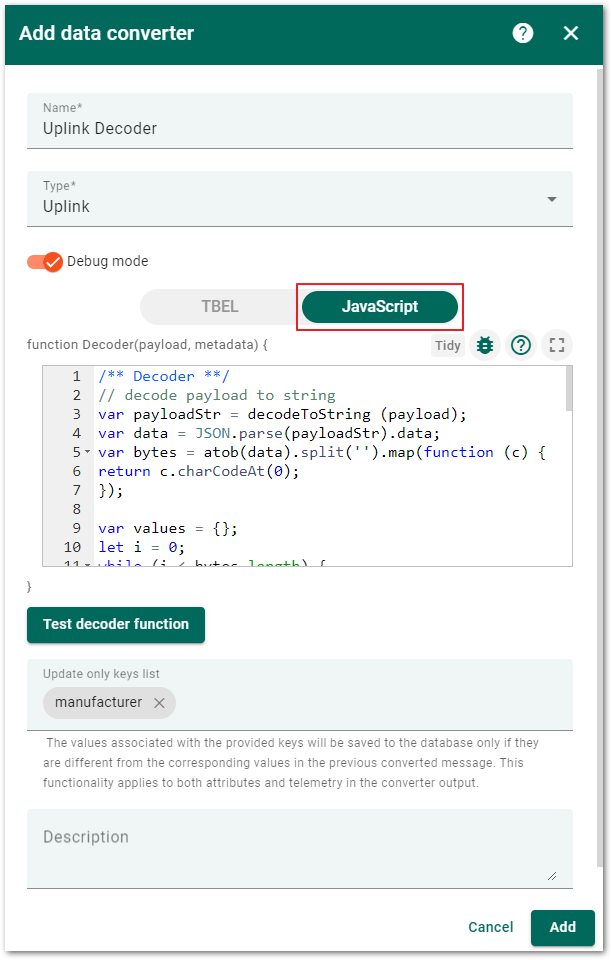 Figure 1: Add the decoder code
- Edit the decoder code by copying the following code into the edit box. Then, click Add to include the uplink decoder.
details Click to view the decoder code
/** Decoder **/
//decode payload to string
var payloadStr = decodeToString (payload);
var data = JSON.parse ( payloadStr ).data;
var bytes = atob (data).split('').map(function (c) {
    return c.charCodeAt (0);
});

var values = {};
let i = 0;
while ( i < bytes.length ) {
    var channelId = (bytes[ i ] << 8) | bytes[ i + 1];
    var value = (bytes[ i + 2] * 256 + bytes[ i + 3]) / 100;
    i += 4;
    switch ( channelId ) {
        case 0x0102:
        values.waterlevel = (0.3125 * value - 1.25). toFixed (3);
        break;
        default:
        break;
    }
}
var integrationName = 'MQTT Integration';
var deviceName = ' water_level ';
var result = {
    deviceName : deviceName ,
    attributes: {
        integrationName : metadata[' integrationName '],
        waterlevel : values.waterlevel ,
    },
};

/** Helper functions **/

function decodeToString (payload) {
    return String.fromCharCode.apply (String, payload);
}

return result;
- Navigate to the Integration Center > Integrations menu and click the Add Integration icon (
 ) to add the MQTT integration.
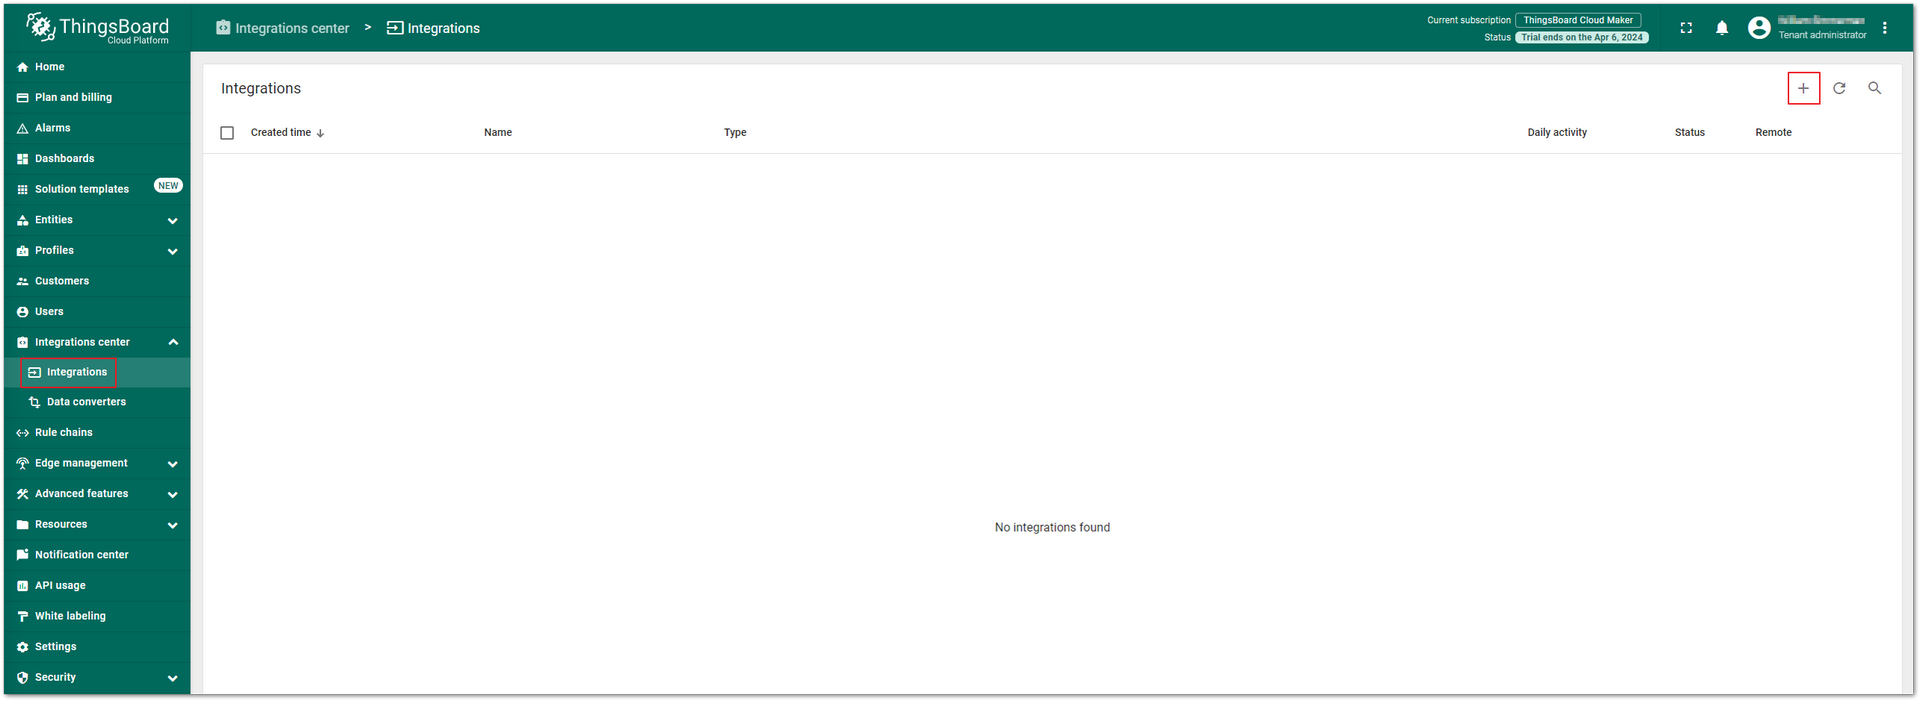 Figure 1: Add the MQTT integration
- Enter the name of the integration (for example, MQTT Integration) in the Name field and select MQTT in the Type drop-down menu. Click Next to continue.
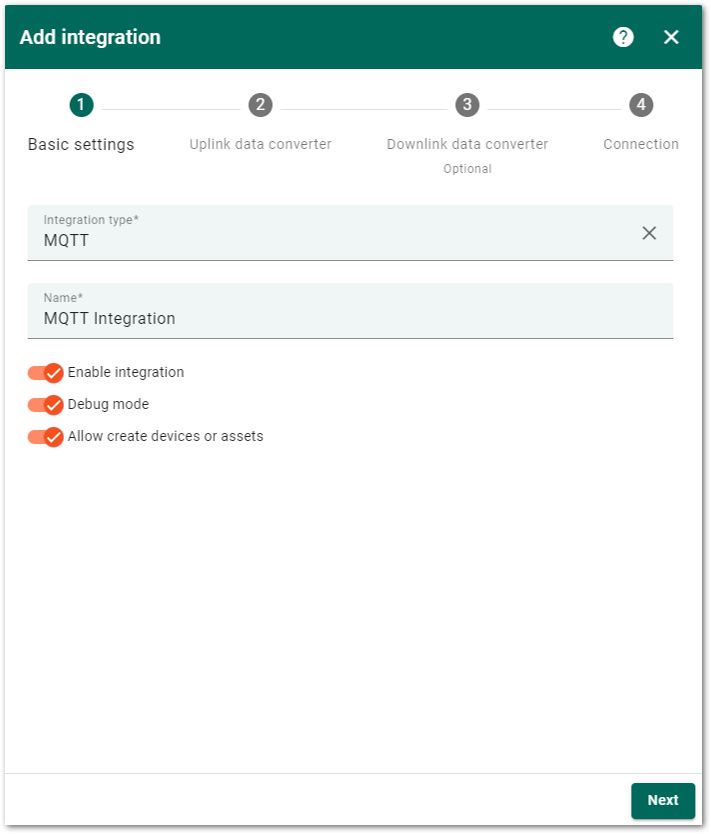 Figure 1: Basic Settings
- In the Uplink data converter options, click Select existing to choose the previously created decoder (Uplink Decoder), then click Next.
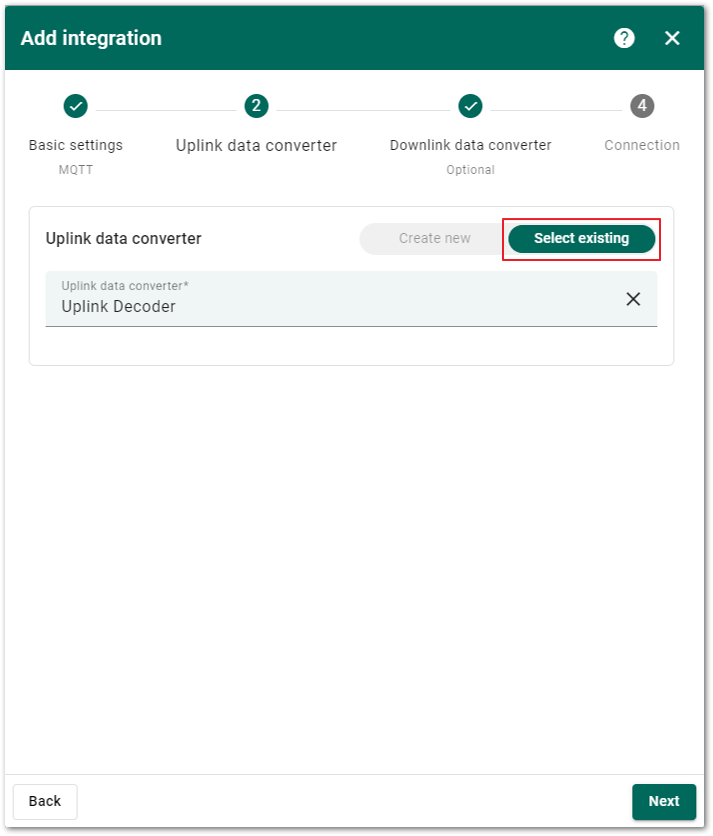 Figure 1: Select the created decoder
-
In the Downlink data converter interface, no configuration is necessary and just click Skip to bypass this setup.
-
Configure connection options. Host is the MQTT broker address used for messages. The Host of the external MQTT broker used in this example is
broker.hivemq.com. You can choose to use other brokers with a different Host. -
Enter the address
broker.hivemq.comin the Host field, with the port number1883. Click the Add topic filter button to configure the subscription topic.
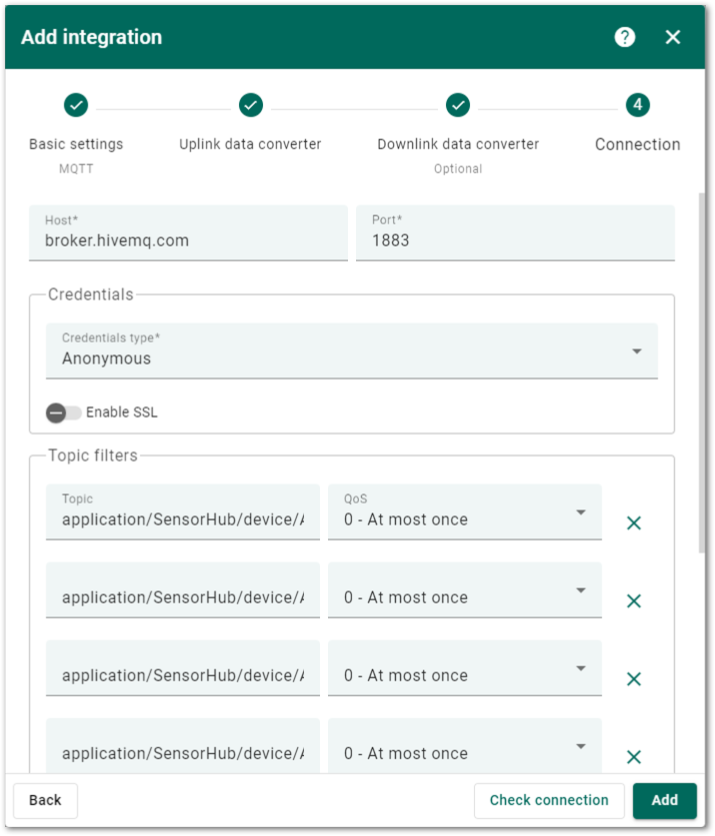 Figure 1: Configure the connection options
application/{{application_name}}/device/{{device_EUI}}/join
application/{{application_name}}/device/{{device_EUI}}/rx
application/{{application_name}}/device/{{device_EUI}}/tx
application/{{application_name}}/device/{{device_EUI}}/ack
application/{{application_name}}/device/{{device_EUI}}/status
- application_name: The application ID created in the gateway.
- device_EUI: The device EUI of the end device.
- Modify the parameter values corresponding to the topics based on the actual application created and the device used. After configuring the details, click the Add button to save and complete the settings.
The values in the subscription topic must be all lowercase. For example, application/1/device/0123456789abcdef/join.
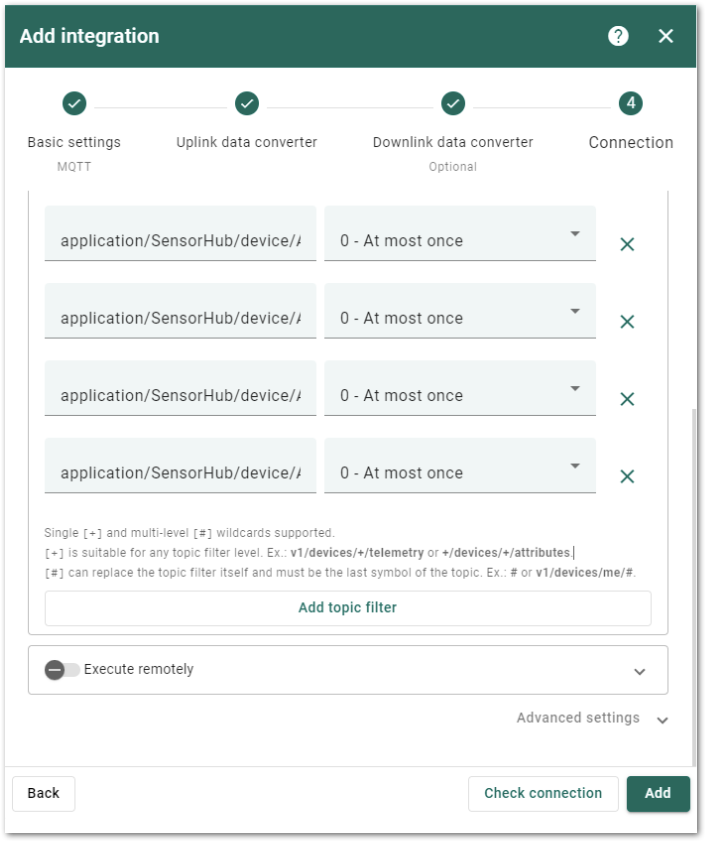 Figure 1: Add Integration
Configure the Gateway
This section will use the RAK7268 V2 WisGate Edge Lite 2 as an example.
- To access the gateway web management platform, refer to the WisGateOS V2 user manual for details.
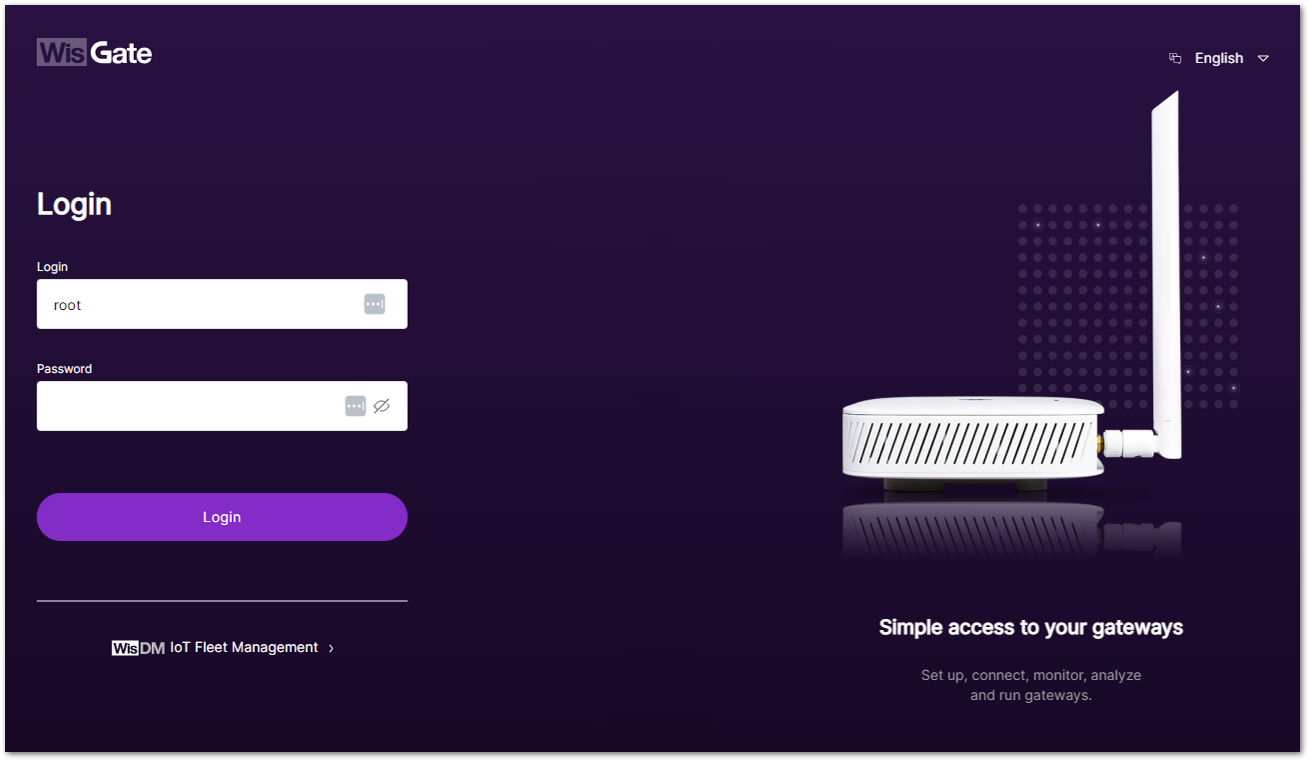 Figure 1: WisGate OS Web Management Platform
- After successfully logging in, navigate to the LoRa® menu in the left navigation tree. Set the Work mode of the gateway to Built-in network server.
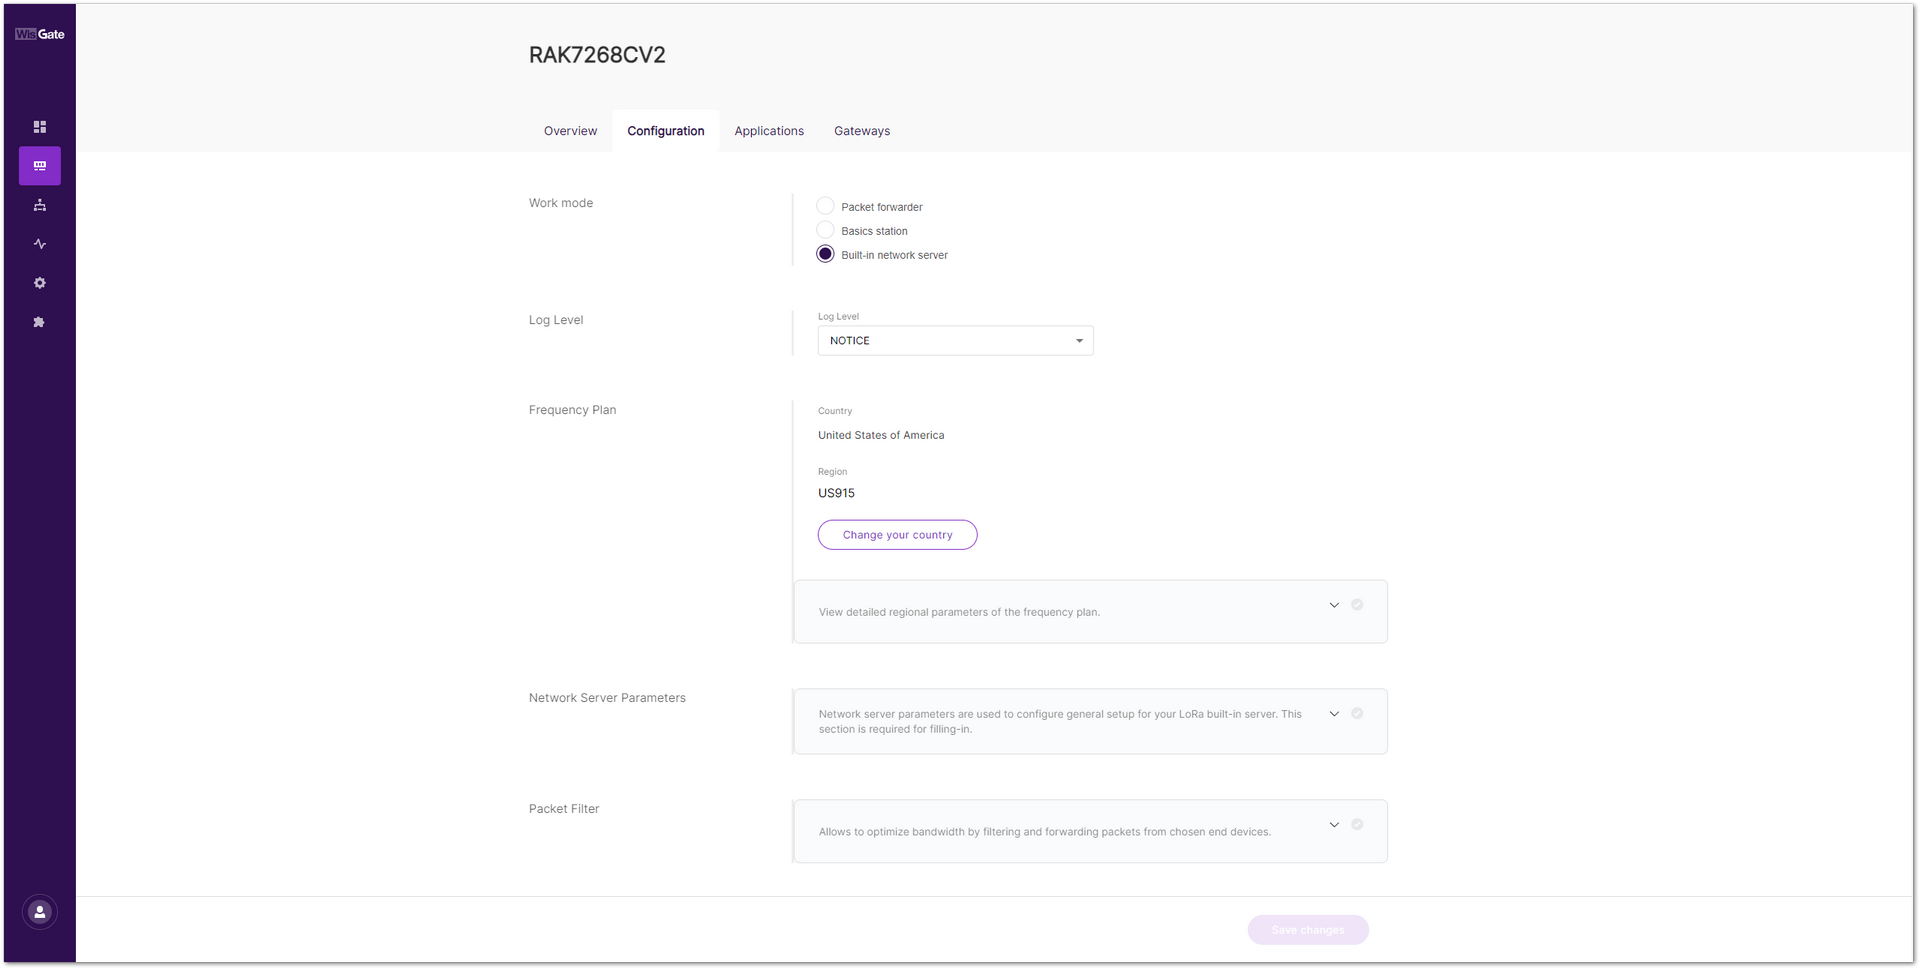 Figure 1: Set the Work mode of the gateway
- Once done with the setting, click the Applications tab, then the Add application button. You can also click add one now text link to add a new application.
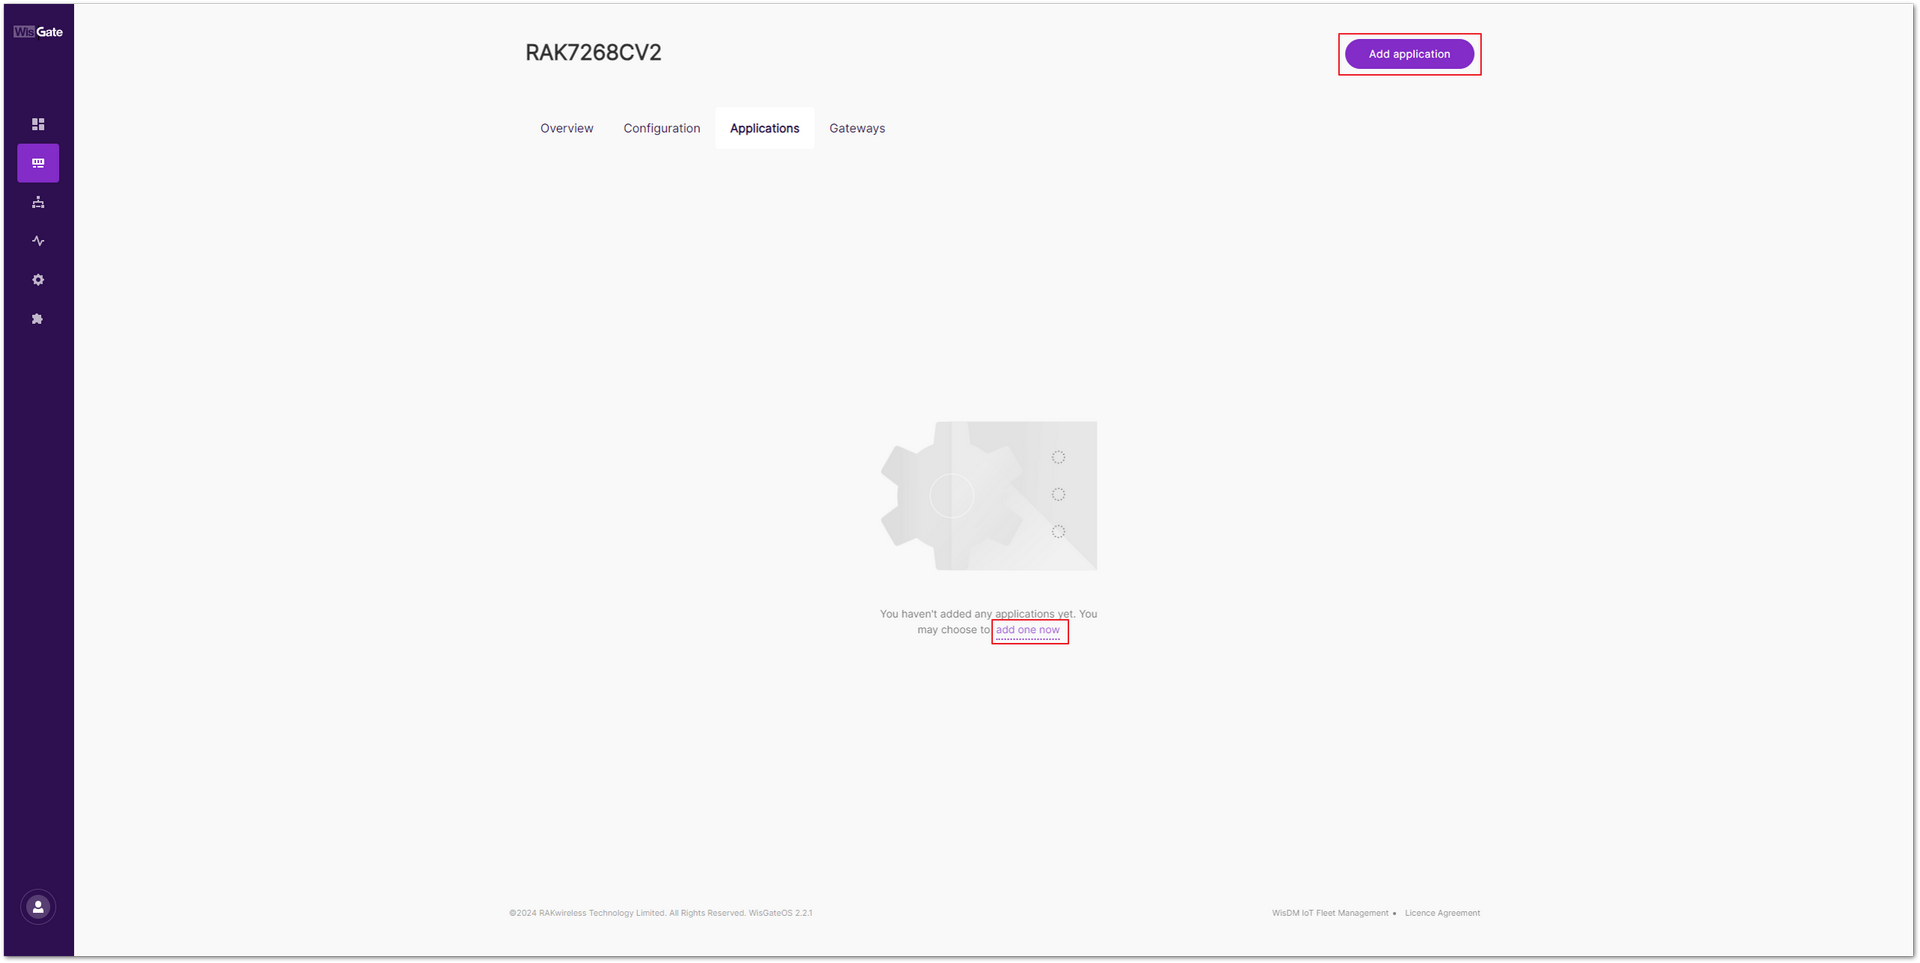 Figure 1: Applications tab
- Configure the following information: Application name, Application Description, and Application Type.
- Unified Application key: Choose this option if all devices will use the same application key. Once selected, a field for the application key appears, where you can manually type in an application key or click the Autogenerate button to generate one.
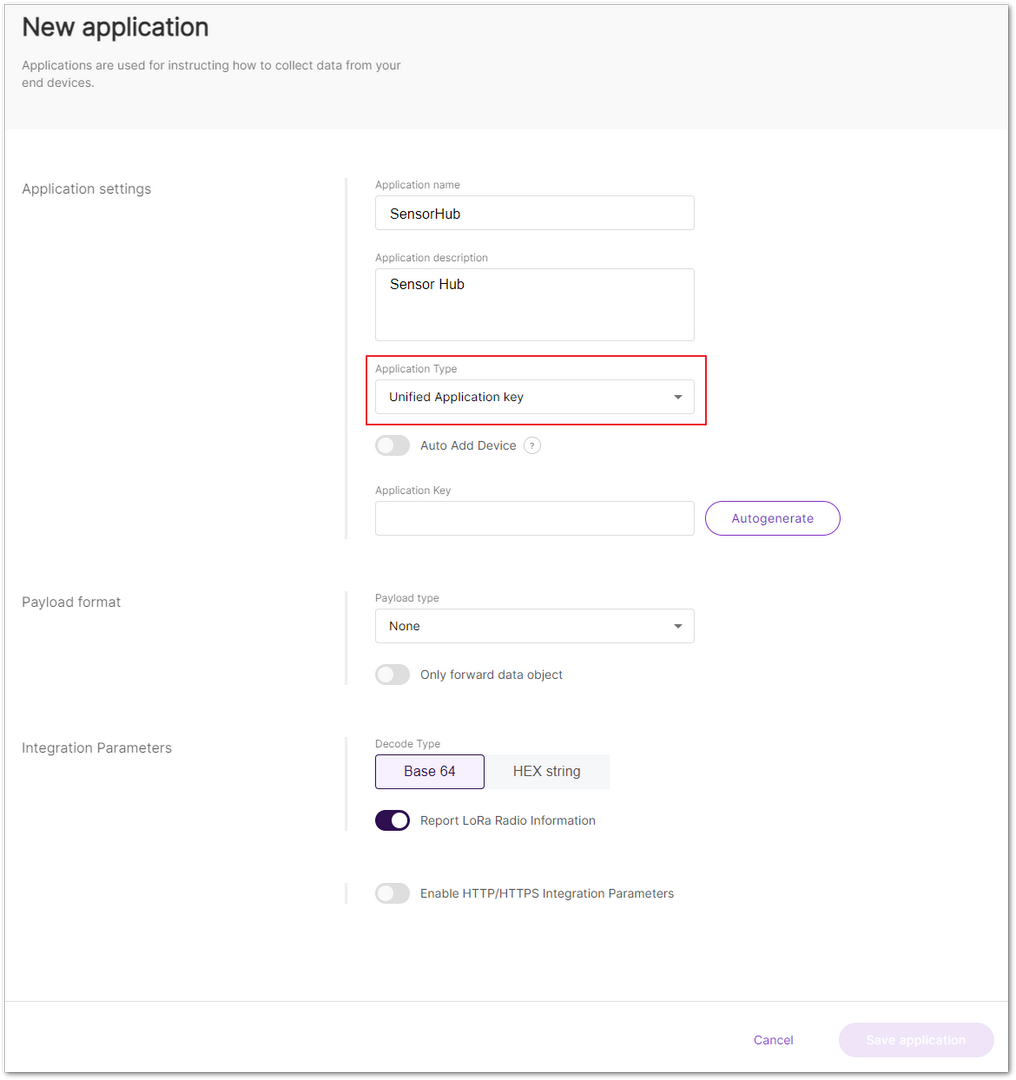 Figure 1: Unified Application Key
- After enabling the Auto Add Device option, configure the Application EUI option. The value needs to be consistent with the node value. Once you have verified the application EUI and key, the device will be added automatically to the application.
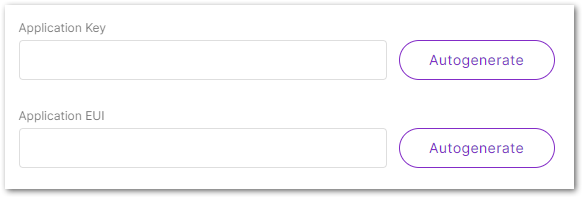 Figure 1: Auto Add Device
You can obtain the values by either querying the end device or generating it automatically and modifying the corresponding value of the device synchronously.
- Separate Application keys: Each device has its own application key. Add the key when registering the device.
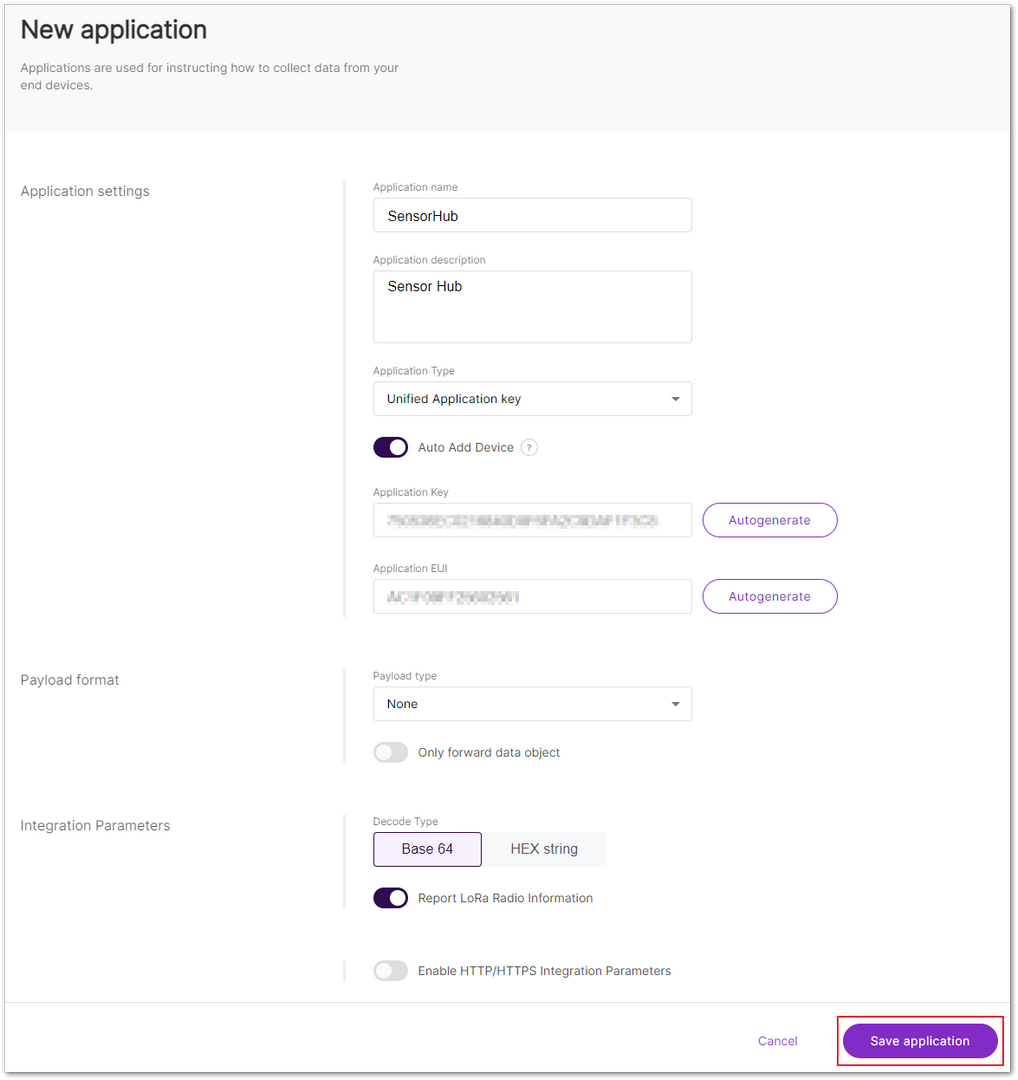 Figure 1: Add Application Key
-
Once you've completed the configuration, click on Save Application to add the new application.
-
In the application list, locate the newly created application and navigate to the End devices tab. If you've enabled the Auto Add Device function, the device will be automatically registered upon the addition request.
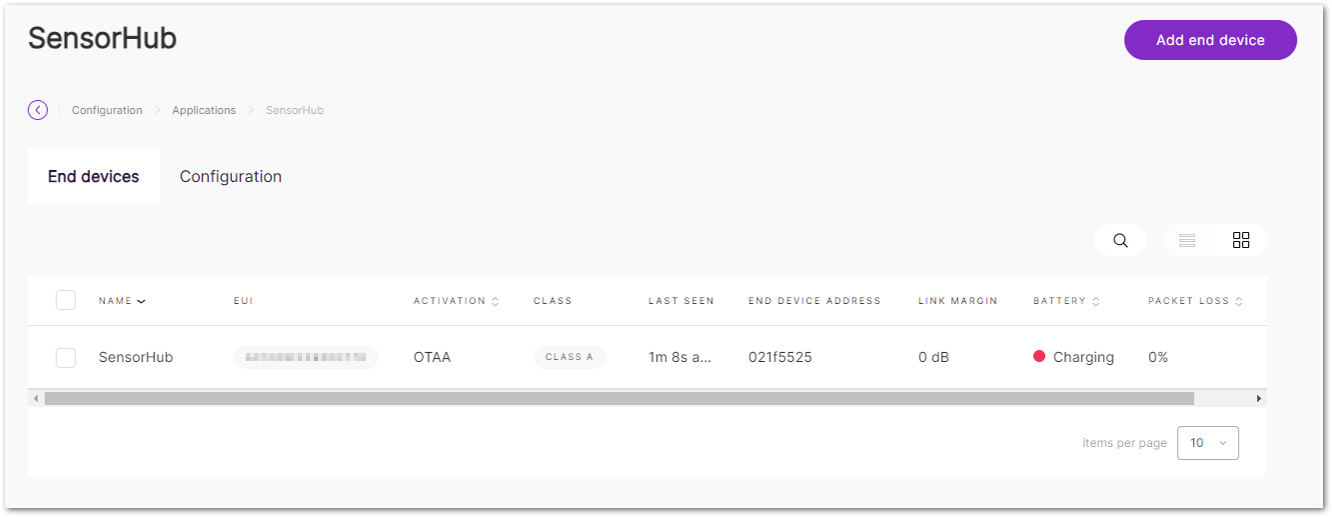 Figure 1: End devices tab
- Click the Add end device button. In the End device information interface, fill in the following information:
- Activation Mode: Select the activation mode of the device: OTAA or ABP.
- Choosing ABP mode creates two additional fields: Application Session Key and Network Session Key.
- In this example, use OTAA activation mode.
- End device (group) name: Enter the name of the end device or the group it belongs to.
- End device description (optional): Optionally provide a description for the end device.
- Class: Select Class A for the device's operating mode.
- Frame Counter Width: Keep the default value.
- LoRaWAN MAC Version: The protocol version (v1.0.3) of the node.
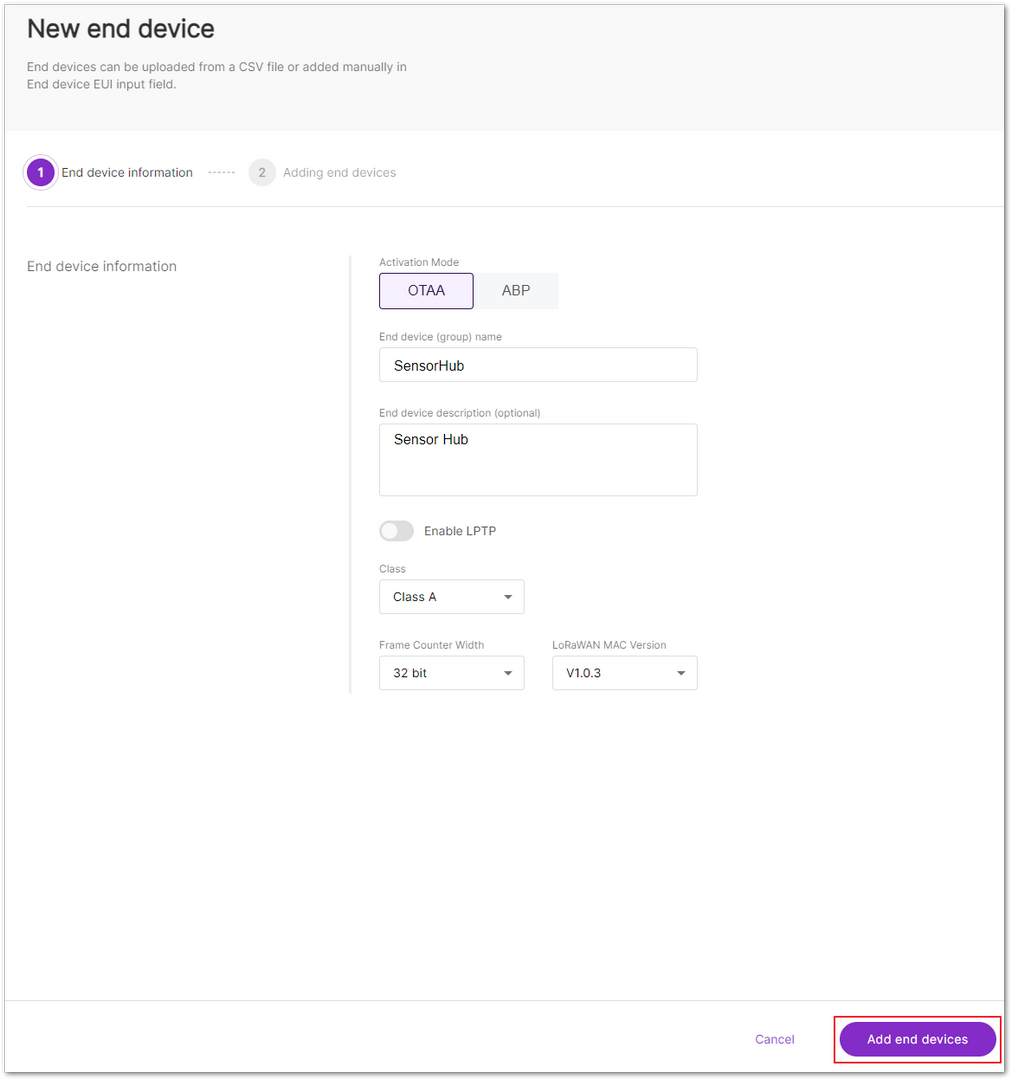 Figure 1: Add new end devices
- After completing, click Add end devices to proceed to the next step.
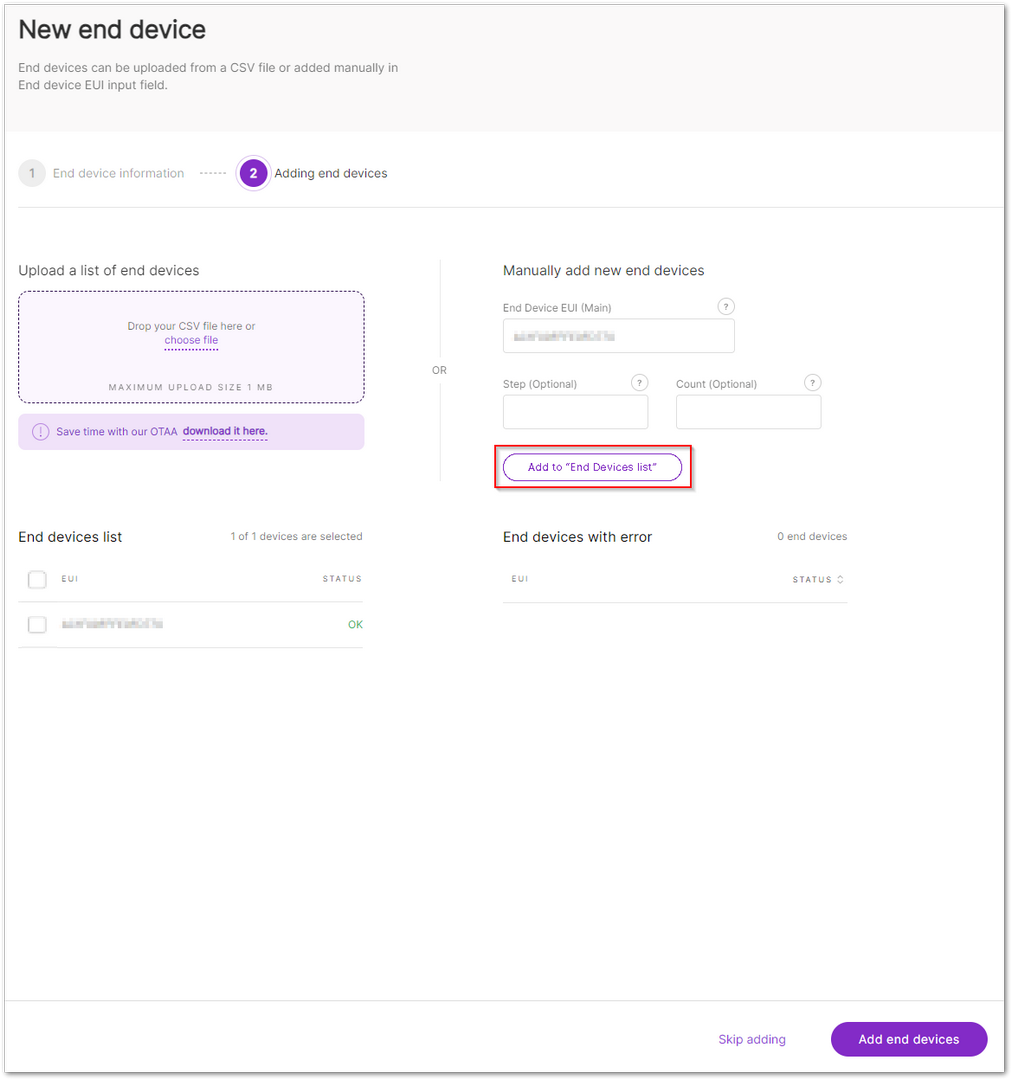 Figure 1: Add the device to the device list
- In the Adding end devices interface, enter the device EUI in the End Device EUI (main) field and select the Add to End Devices list button. Then click Add end devices to complete adding the end device.
- The device EUI configured here must match the end device. You can either obtain it by querying the end device or entering one (1) EUI and synchronously updating the corresponding value of the end device.
- If the EUI is correct, the device will be displayed in the End devices list.
- If the EUI is incorrect, the device will be displayed in the End devices with an error.
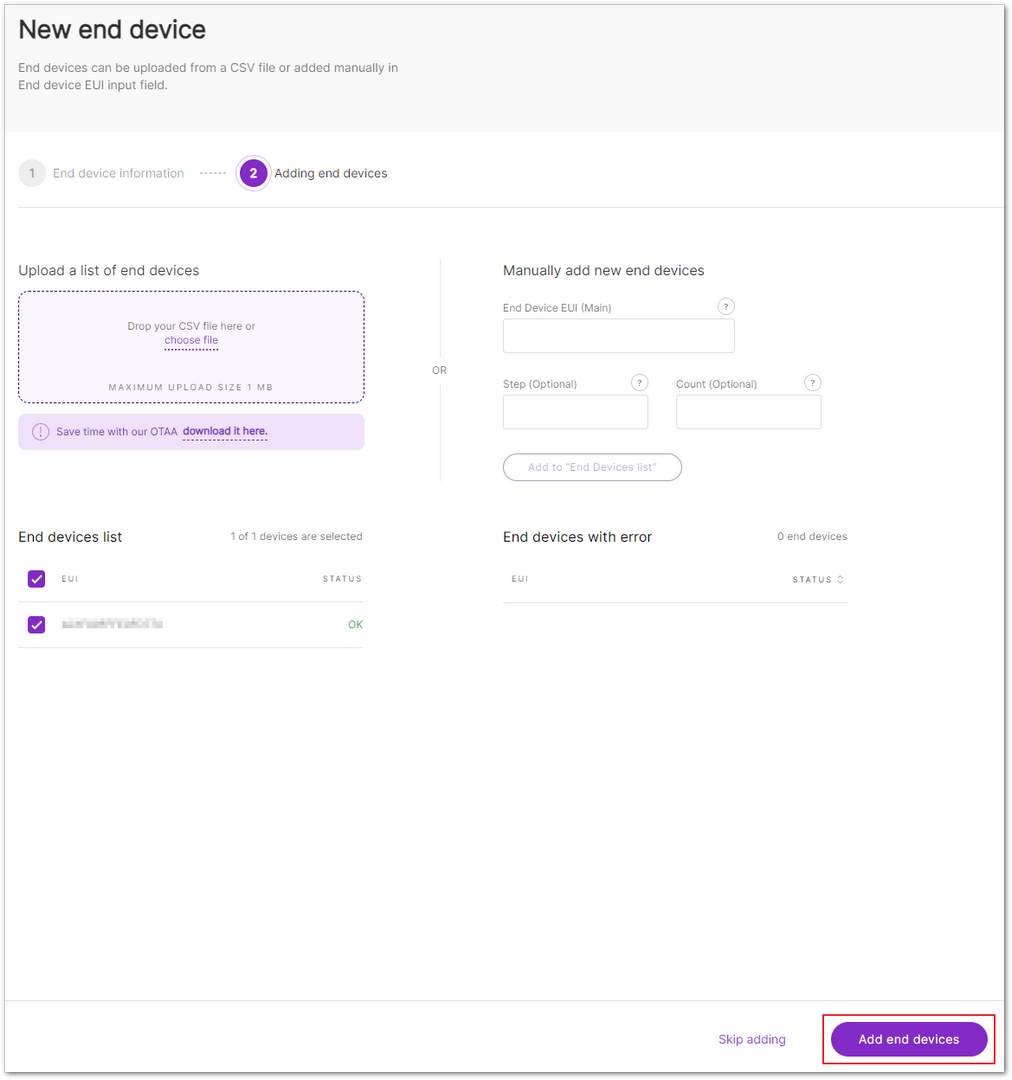 Figure 1: Complete the end device addition
- Click the Add button to confirm adding the device.
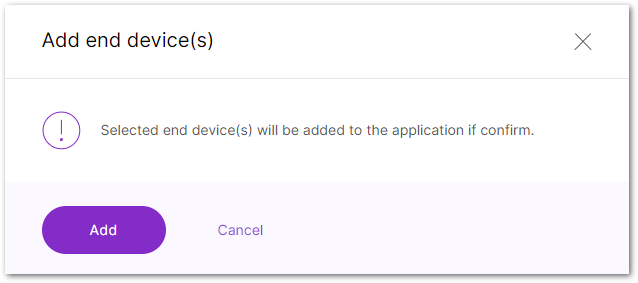 Figure 1: Confirm to add the end device
- When finished, enter the End devices interface, where you can see the created end device.
Connect Sensor Hub to Built-In Network Server
For specific configuration on how to connect SensorHub to the server, refer to SensorHub Network Configuration > LoRaWAN Application Scenario.
Once completed, the device will join the network. As shown in Figure 68, the end device SensorHub has successfully connected to the gateway's built-in server.
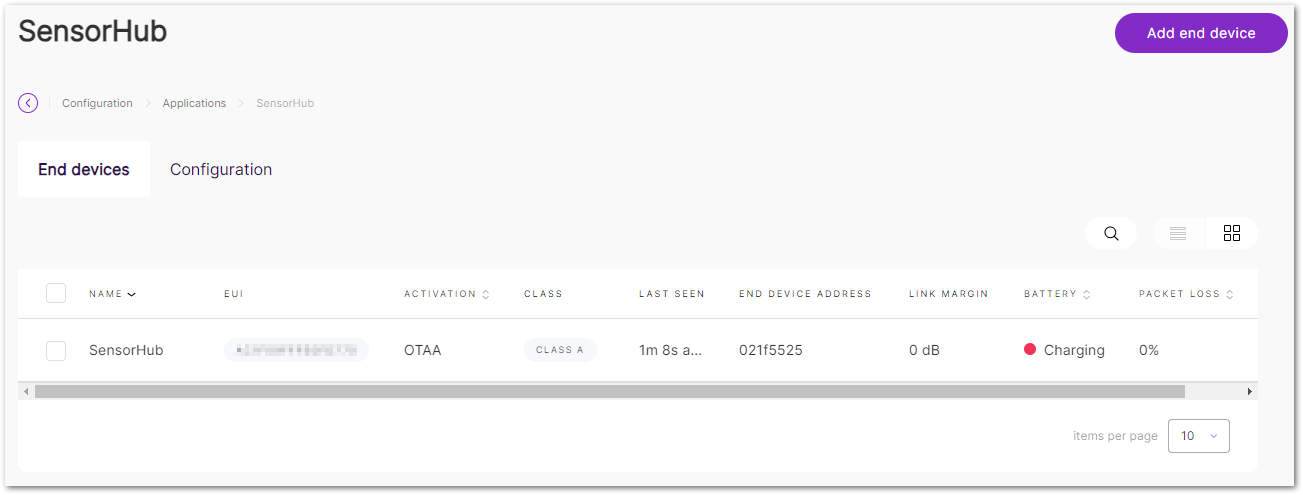 Figure 1: End device SensorHub has been connected
Configure MQTT Integration
- Navigate the LoRa® > Configuration > Integration Interface Parameters section.
- Toggle the Enable Integration Interface option and select Generic MQTT as the Integration mode.
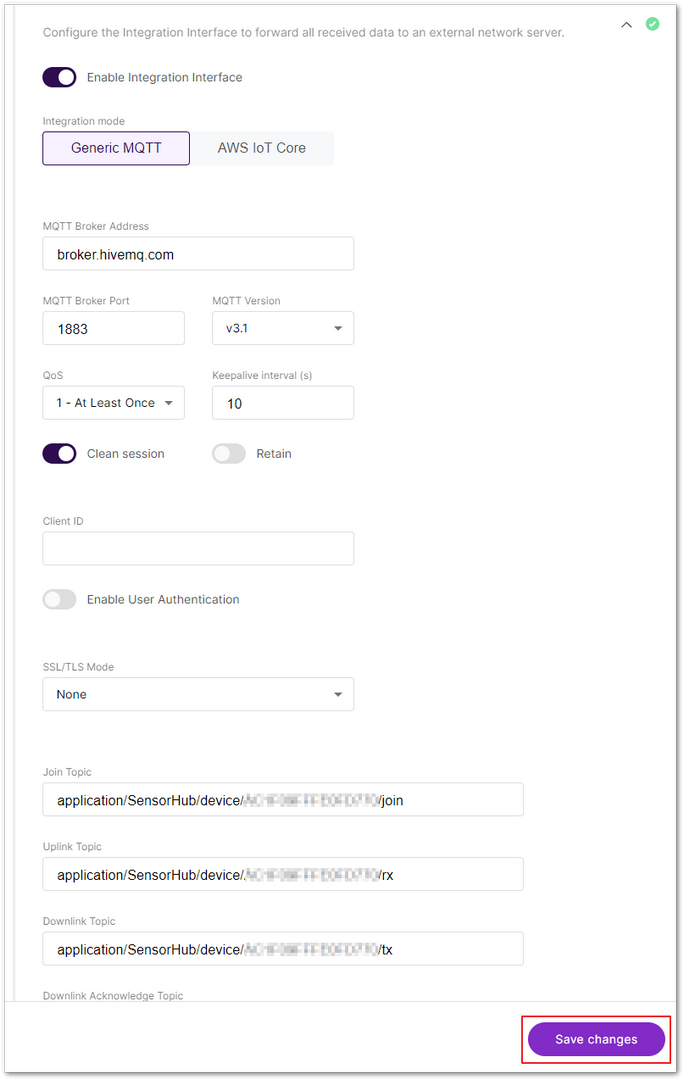 Figure 1: Set up MQTT integration
-
In the MQTT Broker Address option, enter
broker.hivemq.com, then click Save changes. -
After the device has joined and has been sending uplink data, check the uplink data in ThingsBoard > Integrations > Your Integration > Events.
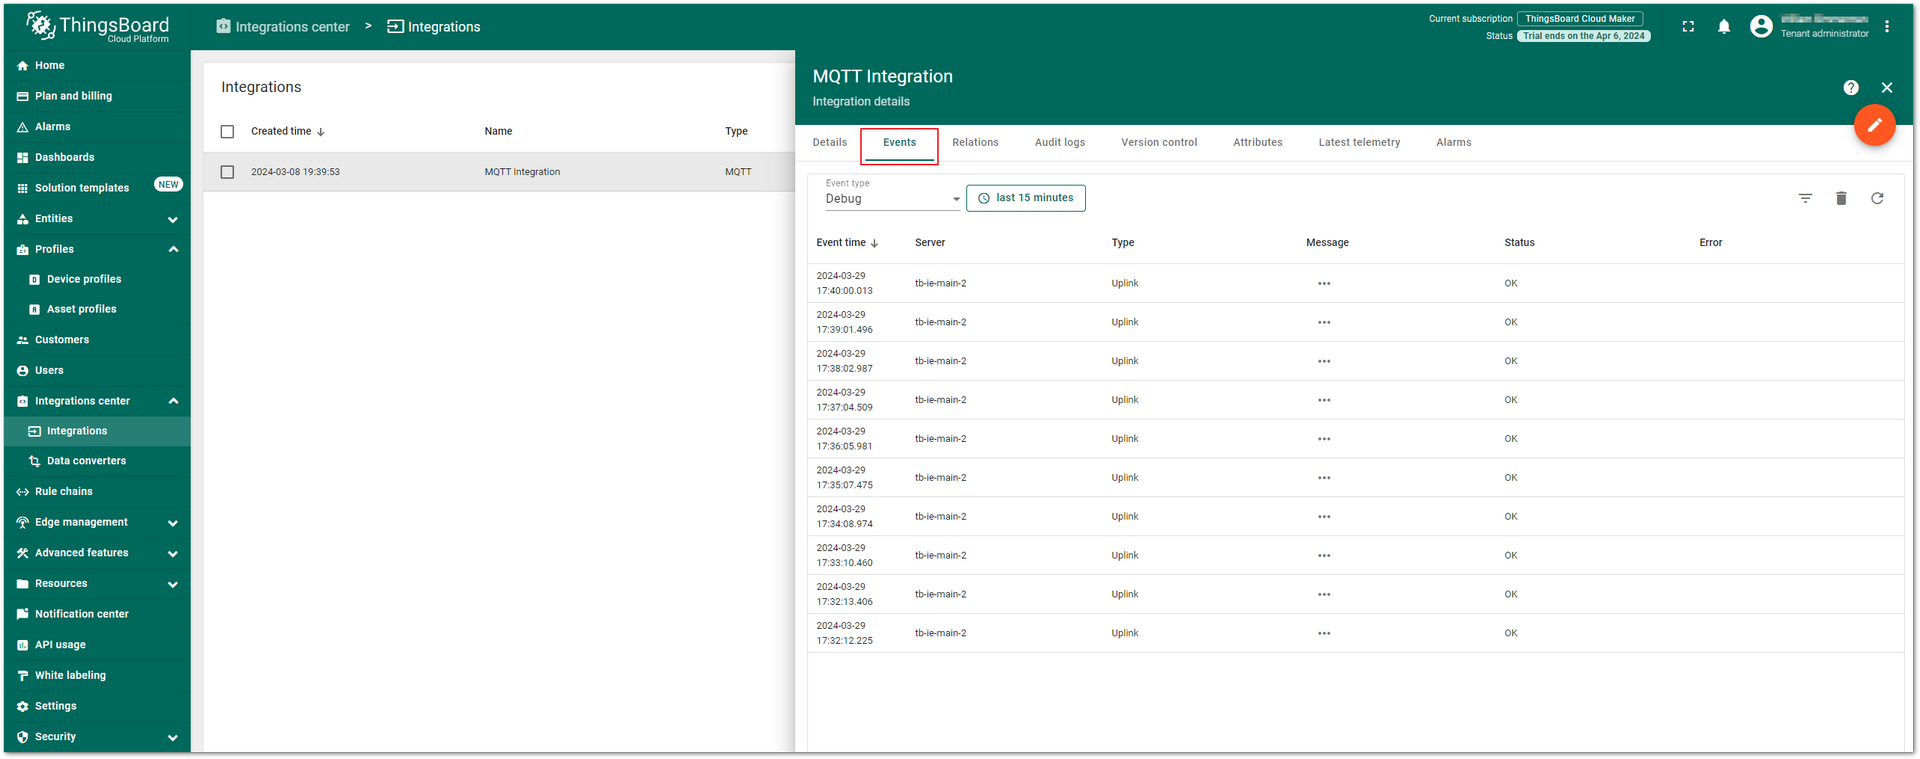 Figure 1: View the gateway uplink data
Visualize Data Through ThingsBoard
- After creating the data converter, integrating, and obtaining some data in the Event tab, check the automatically created devices based on the decoder in the Entities > Devices > Groups tab.
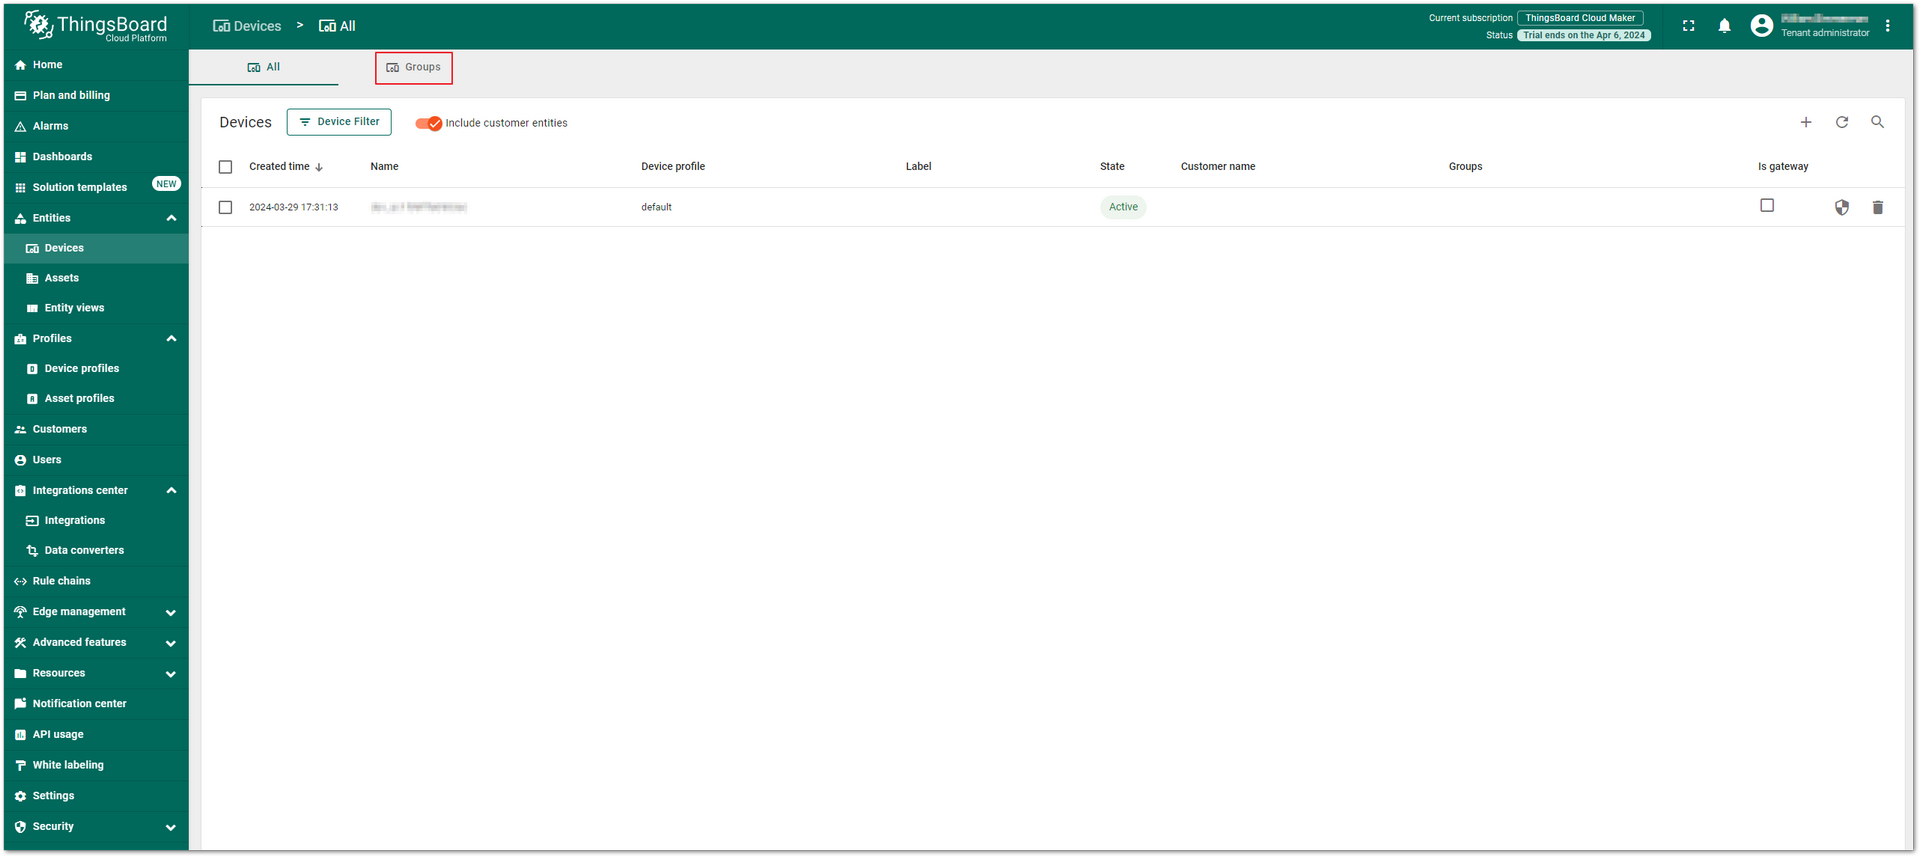 Figure 1: Check the device
- Click the group named All in the Device groups menu to automatically create a decoder device.
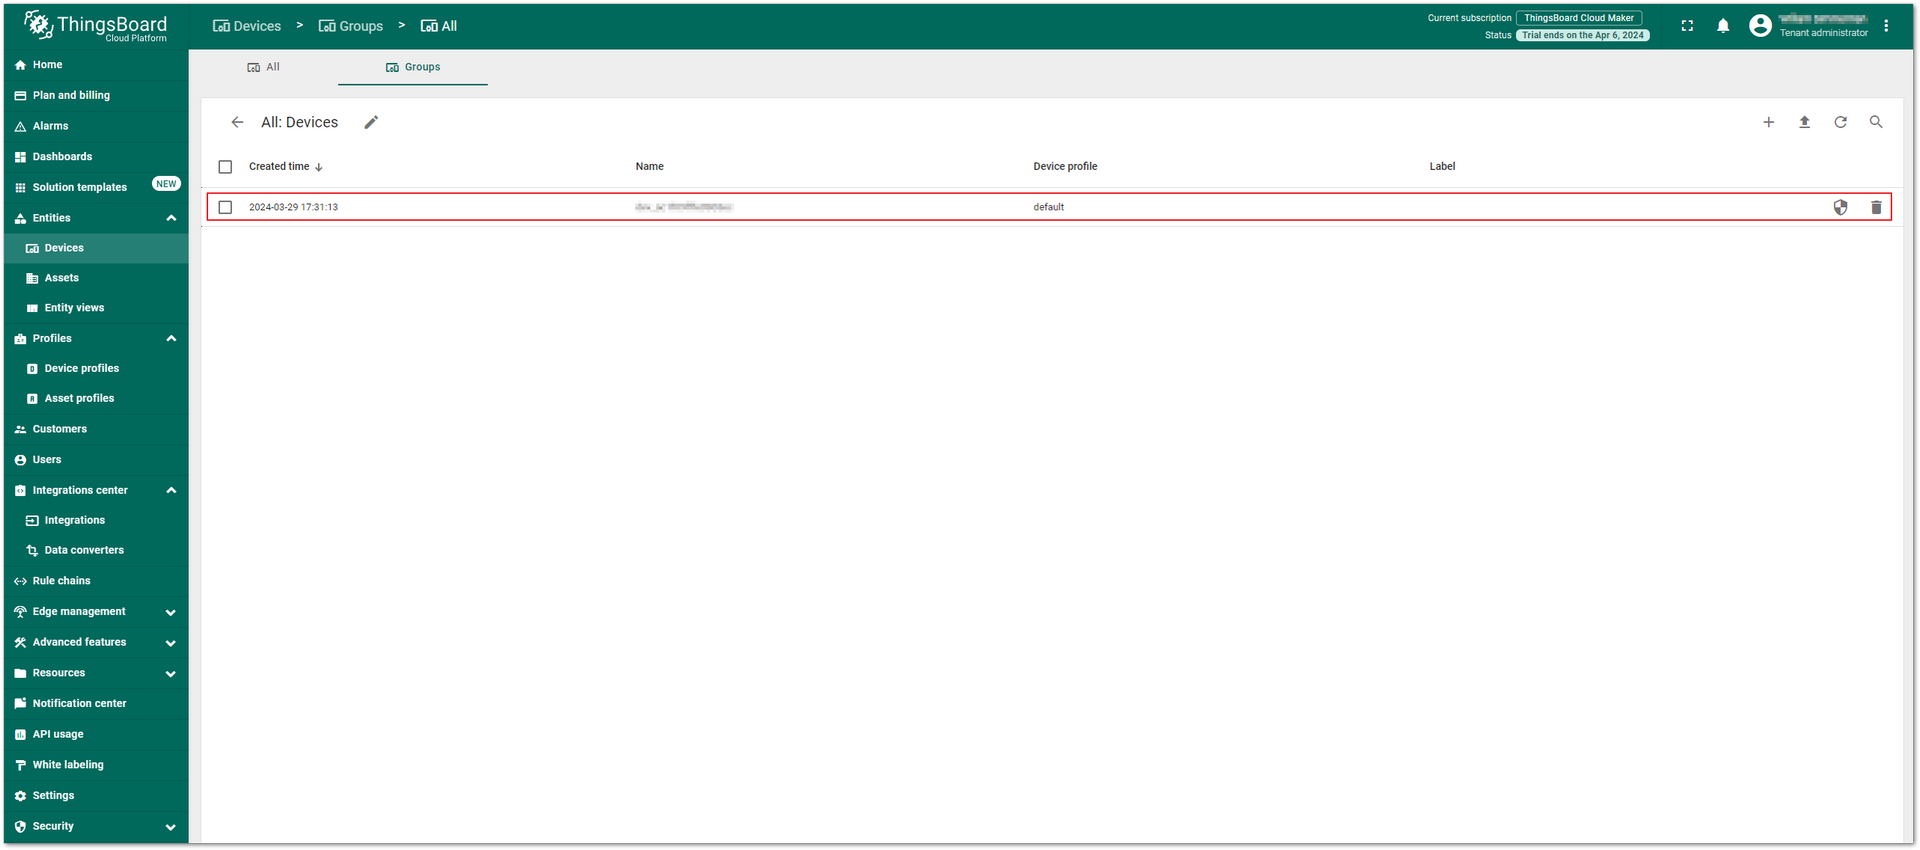 Figure 1: Automatically created decoder device
- Click the device, and navigate to the Attributes tab, and check on the node data.
 Figure 1: Node data
-
To visualize the data, simply select the values you wish to display, then click the Show on widget button.
-
On the next page, choose the desired widget for your data from the Current bundle drop-down menu. In this example, select Tables.
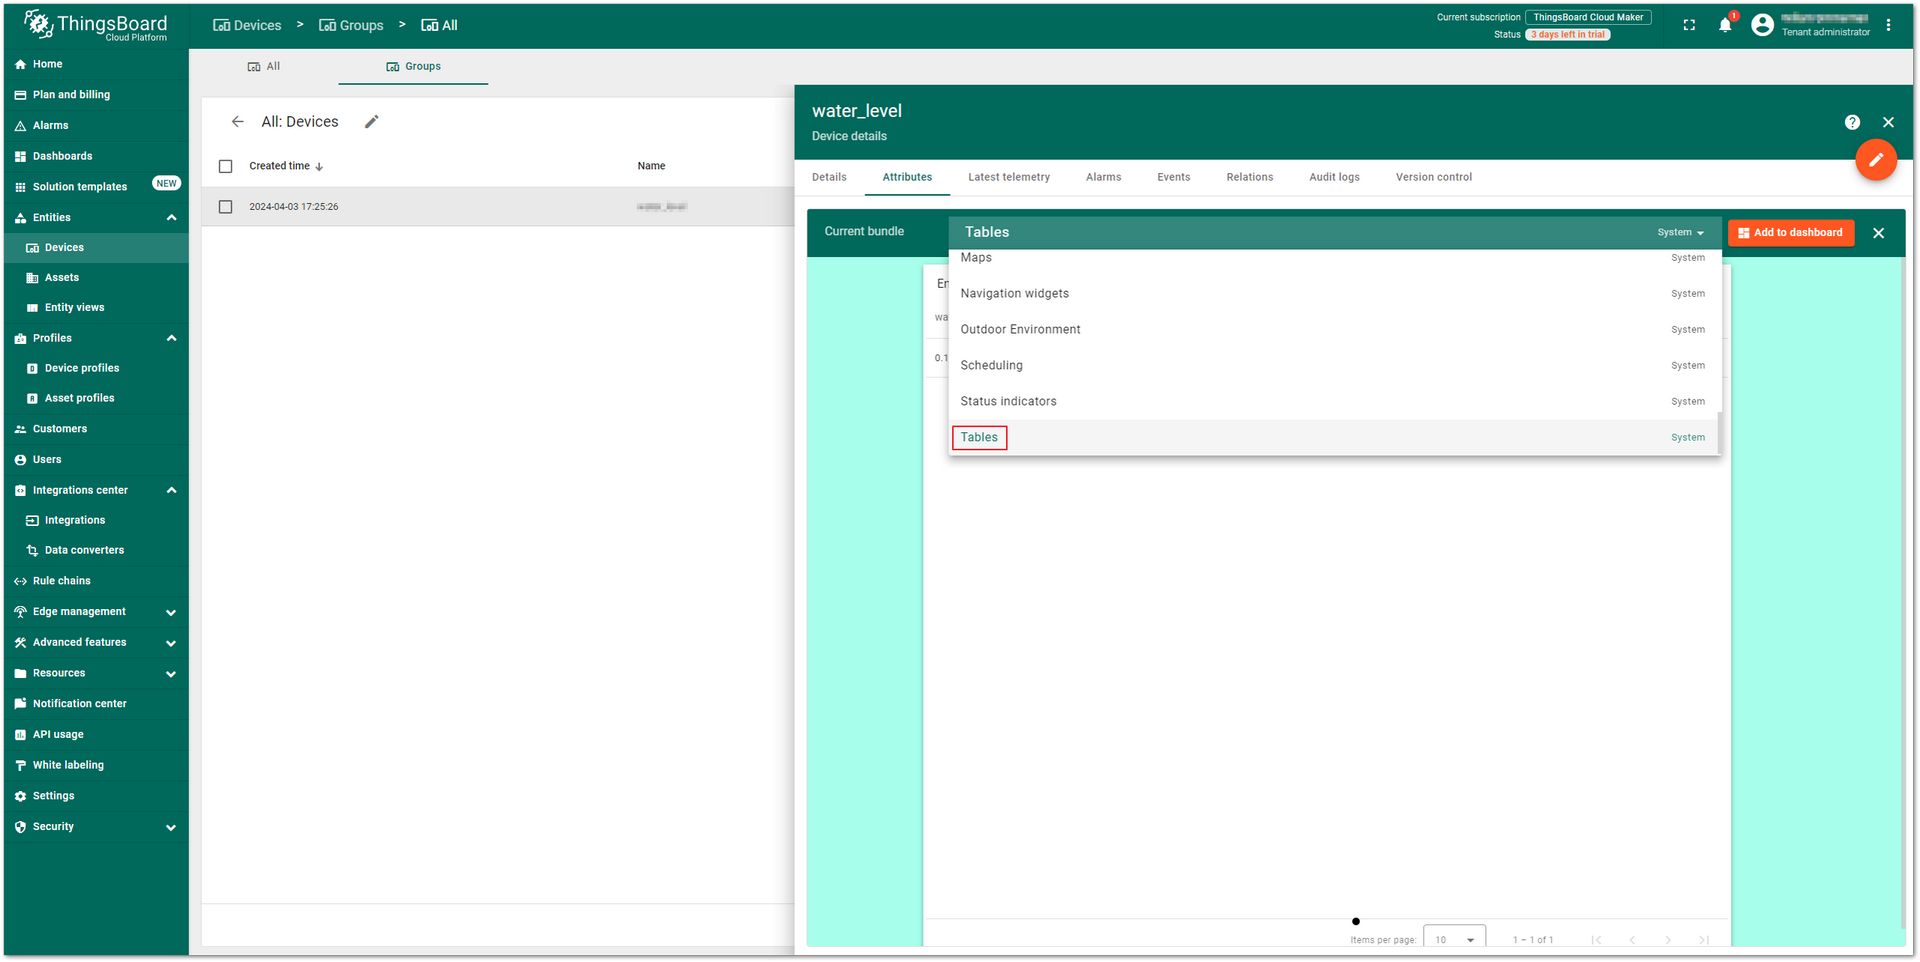 Figure 1: Select Widget
- After selecting the widget, click Add to dashboard to proceed. By default, the profile does not have a dashboard, so you need to select Create new dashboard and enter a name for the dashboard in the New dashboard title field.
- In this guide, name the dashboard SensorHub_Waterlevel.
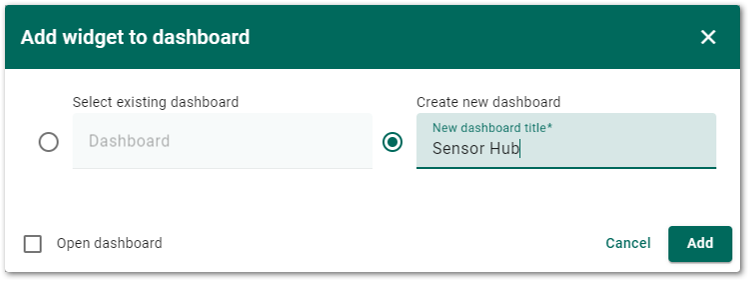 Figure 1: Enter the dashboard name
- After setting the dashboard name, click the Add button to add more widgets. Alternatively, check the Open dashboard option to automatically open the created dashboard after adding the widget.
If the Open dashboard option is not selected, users can still easily view the added widgets via Dashboard groups > All > [Group Name].
 Figure 1: Dashboard created
NB-IoT/LTE CAT-M1 Application
Connect Sensor Hub to MQTT Server
In the Network Server and Visualization Configuration section, the server in the example has been set as a public MQTT broker: broker.hivemq.com. Refer to the corresponding section for details. Users can also choose other brokers or servers, such as AWS IoT Core (optional), according to actual usage scenarios.
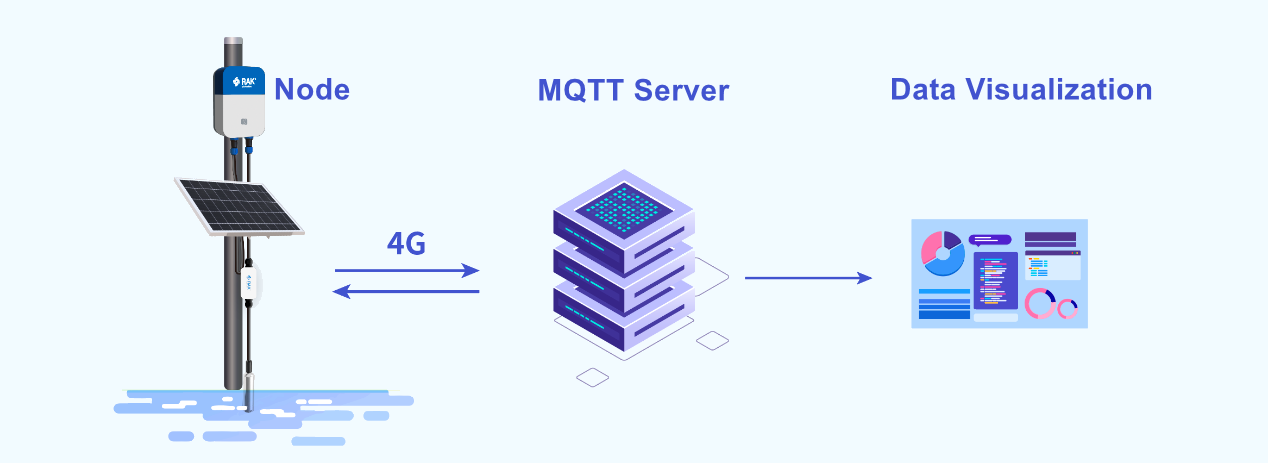 Figure 1: NB-IoT/LTE CAT-M1 application scenario
Visualize Data Through Datacake
In this example, you will use Datacake as the visualization platform. Datacake is a versatile IoT platform designed to visualize data from nodes in a user-friendly manner.
To get started, create an account on the official website and log in.
Add Sensor Hub to Datacake
- After logging in to your account, navigate to the Devices tab and click + Add Device to proceed with adding the Sensor Hub end device.
 Figure 1: Devices page
- Select the API option and click Next to proceed.
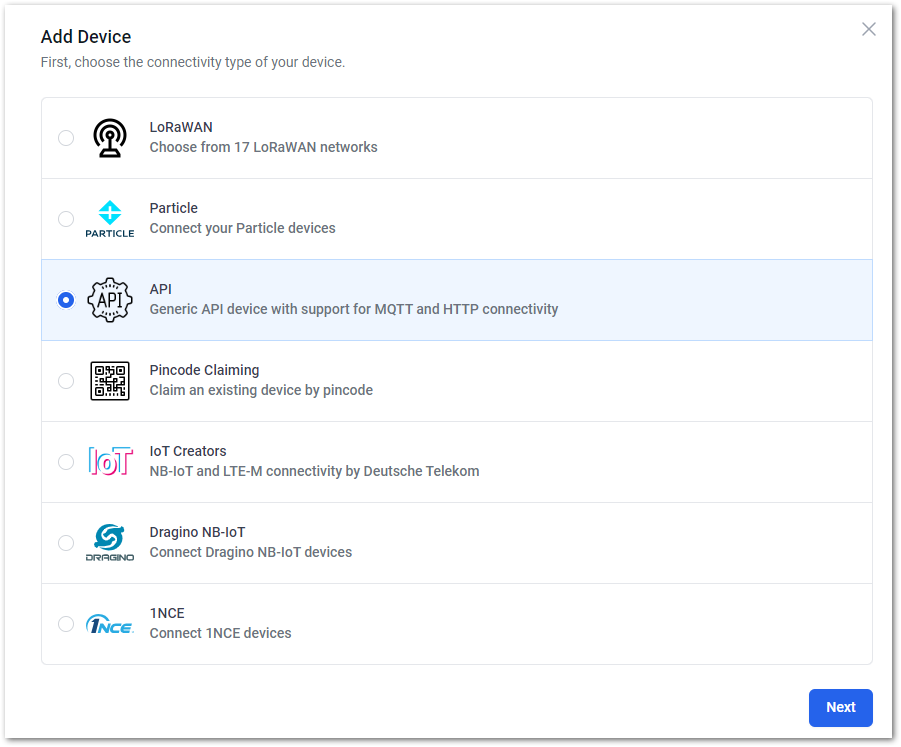 Figure 1: Select API
- As the device is new and there's no ready-made template, choose New Product from the Datacake Product options. Enter the device name in the Product Name field, then click Next to proceed.
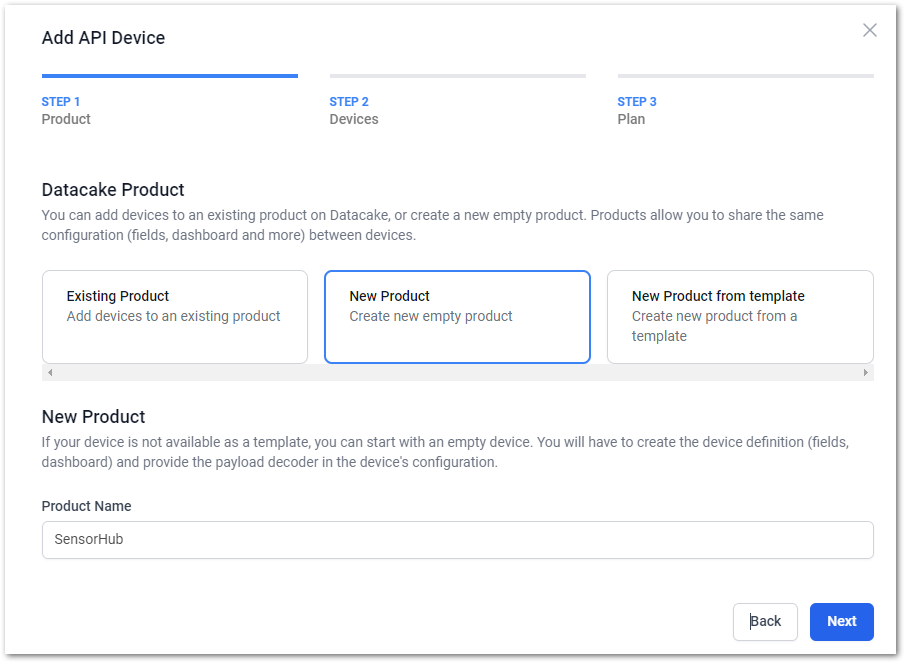 Figure 1: Select New Product
- The SERIAL NUMBER field can be left blank. Datacake will randomly generate a serial number for the device, then click Next.
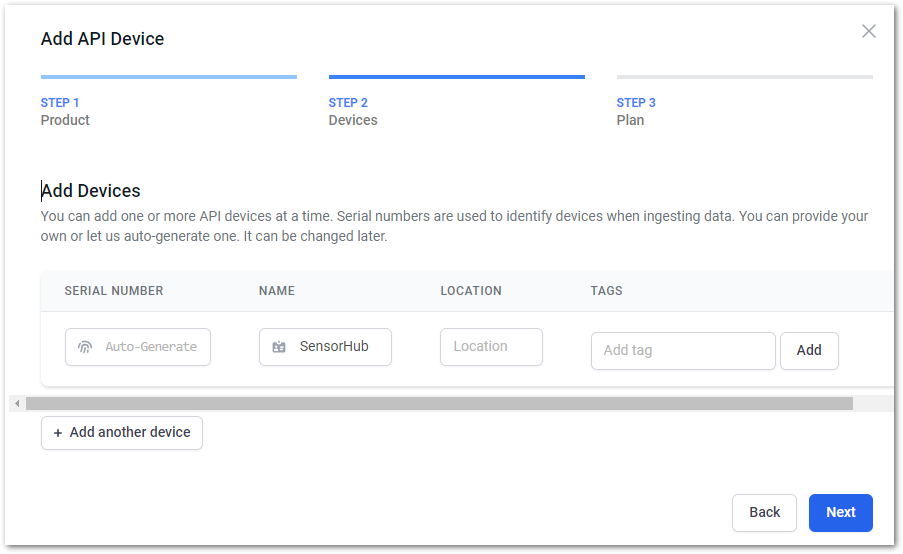 Figure 1: Add Devices
- Select the preferred subscription plan, then click Add 1 device. For this example, choose Free.
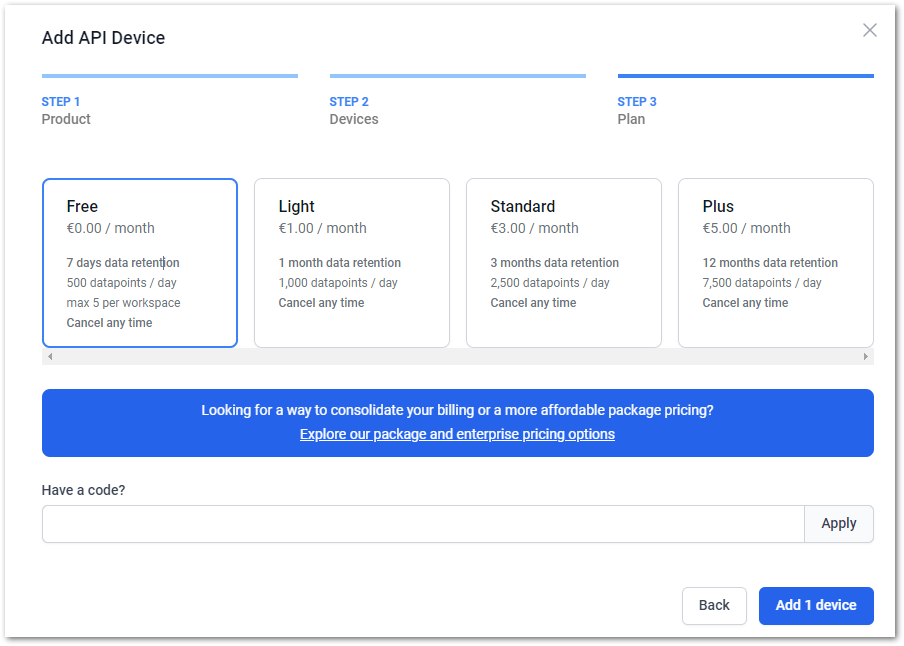 Figure 1: Select a subscription plan
- The registered device can now be viewed on the Devices tab.
 Figure 1: Registered device
MQTT Configuration
- Click the name of the device you just created in the list to enter the interface, then select the Configuration tab.
 Figure 1: Configuration tab
- Scroll down to the API Configuration option and copy the Serial number. Save it locally for later use.
 Figure 1: Copy the serial number
- Continue scrolling down to the MQTT Configuration option and configure the external MQTT Broker.
- Click +Add new MQTT server and configure the relevant parameters.
 Figure 1: Configure the external MQTT Broker
- Fill in the relevant information based on the actual server used, then click Test Connection to verify whether Datacake can successfully connect to the MQTT Broker.
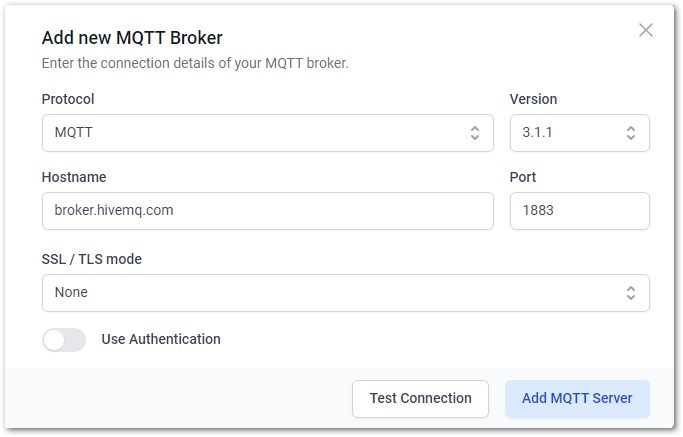 Figure 1: Configure the external MQTT Broker
If SSL/TLS encryption and authentication are set for more secure communication, ensure to configure them accordingly in this section. However, for this example, you can skip this option.
- If the connection is successful, you will see the message Connection successful. Click Add MQTT Server to complete the addition of the MQTT server.
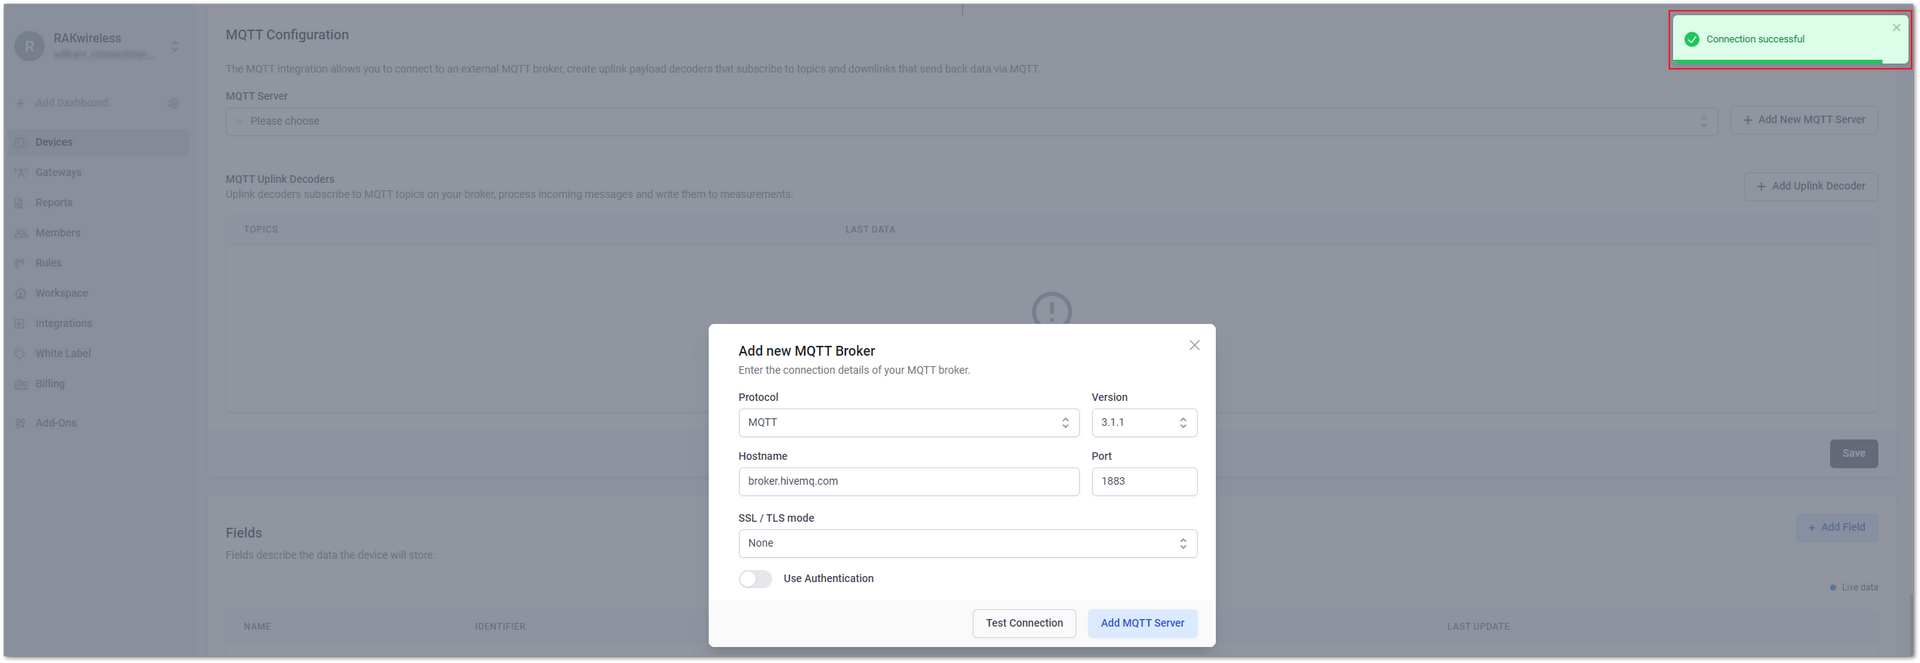 Figure 1: Connection established successfully
- After successfully adding the MQTT server, click on +Add Uplink Decoder to add a decoder.
 Figure 1: Add MQTT Server
- A new window will appear, and fill in the fields according to your project.
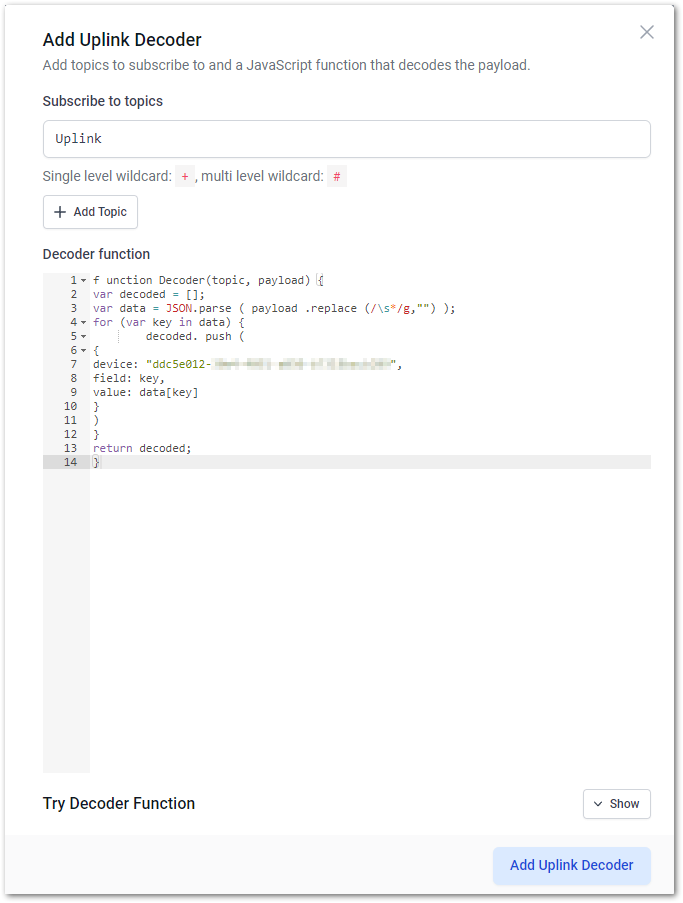 Figure 1: Add Uplink Decoder
- Subscribe to topics: Configure the subscription topics, that is, the value of the Publish Topic configured in the Network Server and Visualization Configuration section.
- Decoder function: Copy the following decoding code and paste it into the Decoder function space.
function Decoder(topic, payload) {
    var decoded = [];
    var data = JSON.parse ( payload .replace (/\s*/g,"") );
    for (var key in data) {
        decoded. push (
        {
            device: "cfdac42a-b7ac-4a94-ab77-fb5090150aa6",
            field: key,
            value: data[key]
        }
        )
    }
    return decoded;
}
In the above code, make sure that the parameter serial_number (device: cfdac42a-b7ac-4a94-ab77-fb5090150aa6) matches the serial number saved locally earlier.
- Once completed, click Add uplink decoder.
- In the Fields option, click +Add Field to show the monitoring values of the devices. Each device can create a certain number of fields, also known as a data point.
 Figure 1: Add Field
- Set the necessary parameters of the Fields. For Fields with multiple data points, add them one by one. Once done, click Add Field.
 Figure 1: Set the related parameters of the field
The Identifier field will be automatically filled based on the name.
- Once the uplink data is received, the Current value column in the Fields list will display the current monitoring value from the sensor.
 Figure 1: Added sensor monitoring values
Create a Dashboard to Visualize Data
Dashboards can be customized depending on the specific needs and preferences of a project. Follow the steps below to add widgets and visualize the data.
-
On the device details page, navigate to the Dashboard tab, then toggle on the edit mode switch (
 ).
). -
Click on the + Add Widget button to add a widget for visualizing data.
 Figure 1: Open the edit mode
- Choose what type of widgets you want to display. For this example, select Value.
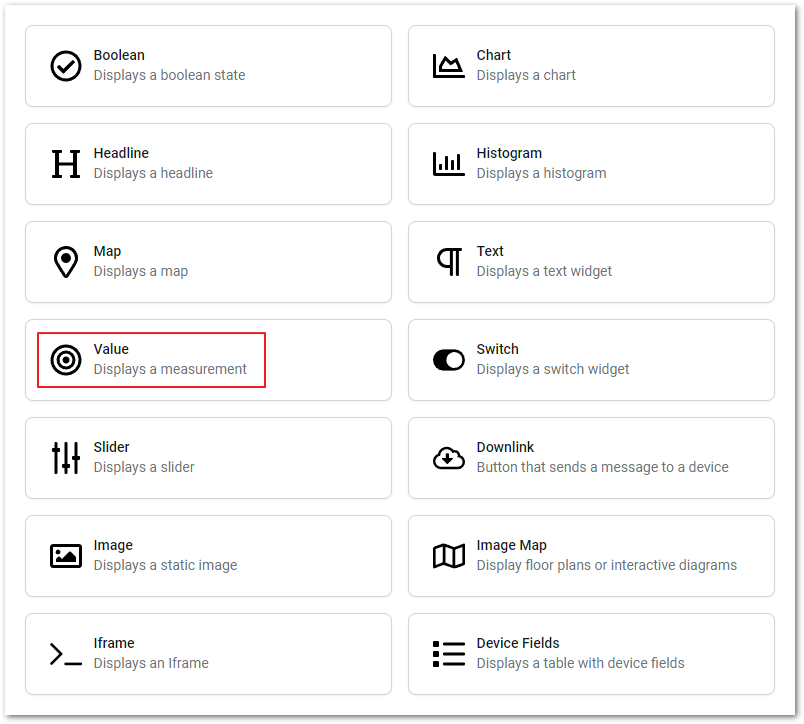 Figure 1: Choose type of the Widgets
- Go to the Data tab and choose the data you want to visualize from the available Field options. For this example, select Water Level and set the unit to m.
 Figure 1: Select the visualization data field
-
After configuring the widget, click Save. You should now see the successfully created water level widget on the Dashboard interface.
-
Once done with the dashboard configuration, turn off the edit mode switch (
 ) to save the settings.
 Figure 1: Close edit mode to save the settings