Metrics Dashboard Examples
Metrics Dashboard Examples provide ready-to-use dashboard templates for common gateway monitoring, operation review, and troubleshooting scenarios. Each example includes the recommended widget type, metric, operation, filter, and reading guidance so that you can build useful dashboards without starting from a blank page.
The examples in this section are recommended starting points. You can adjust the selected time range, filters, widget type, and operation based on your project size, data retention period, and troubleshooting purpose.
How to Use These Examples
Use this page when you already know what you want to monitor but need guidance on which dashboard template, widget type, metric, operation, and filter to use.
Before you configure a widget, you may need to check the metric meaning and the recommended operation:
- For metric meanings, units, value interpretation, and recommended operations, see Metrics Reference.
- For steps to create projects, dashboards, widgets, filters, and operations, see Configure Metrics Dashboards.
A typical workflow is:
- Choose a dashboard template based on your monitoring scenario.
- Review the recommended time range and filters.
- Check the metric meaning and recommended operation in Metrics Reference if needed.
- Create the widget by following the steps in Configure Metrics Dashboards.
- Retrieve the metric result and adjust the time range, filter, or widget type if needed.
Recommended Review Time Range
The dashboard time range defines the time period used to retrieve and display metric data. The selected time range applies to all widgets on the current dashboard.
| Review Purpose | Recommended Time Range |
|---|---|
| Daily operation review | Last 24 hours |
| Short-term issue review | Last 24 hours or Last 7 days |
| Trend review | Last 7 days or longer, depending on your subscription plan and data retention period |
Daily Gateway Health Overview
Use this dashboard when you need to quickly review the current health status of your gateway fleet during daily operations.
This dashboard is intended for Last 24 hours review. It helps you quickly check gateway availability, system resource usage, WAN connectivity, LoRaWAN® packet reporting quality, GPS status, and storage readiness.
Total Online Gateways
Use this widget to quickly check how many gateways are reporting online in the selected review scope.
| Configuration Item | Recommended Setting |
|---|---|
| Widget name | Total Online Gateways |
| Widget type | Single value |
| Metric type | System |
| Metric | Gateway Count |
| Operation | LAST VALUE |
| Filter labels | Gateway Status = Online |
 Figure 1: Total Online Gateways
What it helps you check
This widget gives you a quick view of gateway availability. Use it together with Total Offline Gateways to understand the overall fleet status.
How to act on the result
If the value is lower than expected, check whether the missing gateways are concentrated in the same Location, firmware version, or WAN interface. This helps you distinguish between an individual gateway issue and a site-level issue.
Total Offline Gateways
Use this widget to quickly check how many gateways are reporting offline in the selected review scope.
| Configuration Item | Recommended Setting |
|---|---|
| Widget name | Total Offline Gateways |
| Widget type | Single value |
| Metric type | System |
| Metric | Gateway Count |
| Operation | LAST VALUE |
| Filter labels | Gateway Status = Offline |
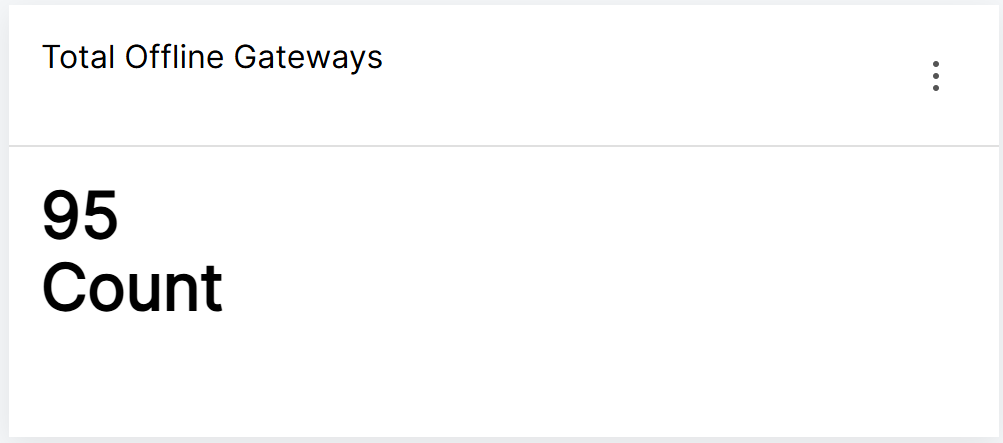 Figure 1: Total Offline Gateways
What it helps you check
This widget helps you understand whether part of the fleet is unavailable. If the offline value is higher than expected, check offline records, reboot status, WAN connectivity, and gateway details.
How to act on the result
If the value increases suddenly, review Top Gateways by Offline Records, WAN Connection Breakdown, and Interface Traffic Daily View to determine whether the issue is caused by gateway failure, site network interruption, or backhaul connectivity loss.
Gateway Status Breakdown
Use this widget to show the latest distribution of gateway status in the selected dashboard scope. It helps you quickly understand how many gateways are currently in Online, Offline, Provisioning, or PreProvisioning status.
| Configuration Item | Recommended Setting |
|---|---|
| Widget name | Gateway Status Breakdown |
| Widget type | Pie chart |
| Display legend | Enabled |
Metrics to Display
Add multiple metrics based on different gateway status values.
| Metric Name | Type | Metric | Operation | Filter Label |
|---|---|---|---|---|
| Online | System | Gateway Count | LAST VALUE | Gateway Status = Online |
| Offline | System | Gateway Count | LAST VALUE | Gateway Status = Offline |
| Provisioning | System | Gateway Count | LAST VALUE | Gateway Status = Provisioning |
| Preprovisioning | System | Gateway Count | LAST VALUE | Gateway Status = Preprovisioning |
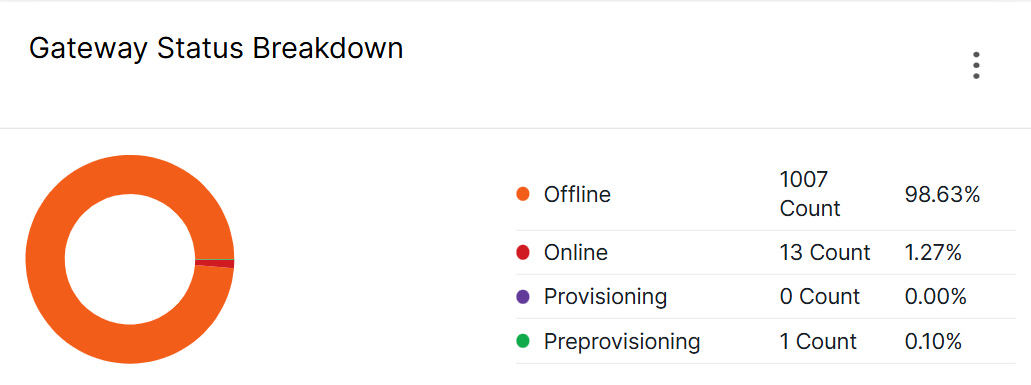 Figure 1: Gateway Status Breakdown
What it helps you check
This widget helps you quickly understand how many gateways are currently in Online, Offline, Provisioning, or PreProvisioning status.
How to act on the result
If Offline takes a large portion of the chart, use table widgets to identify the affected gateways.
Gateways Reporting Reboot Detected
Use this widget to identify gateways that reported the Reboot detected state during the selected time range.
| Configuration Item | Recommended Setting |
|---|---|
| Widget name | Gateways Reporting Reboot Detected |
| Widget type | Table View |
| Metric type | System |
| Metric | Gateway Rebooted |
| Operation | COUNT |
| Recommended filter | Gateway Rebooted = Reboot detected |
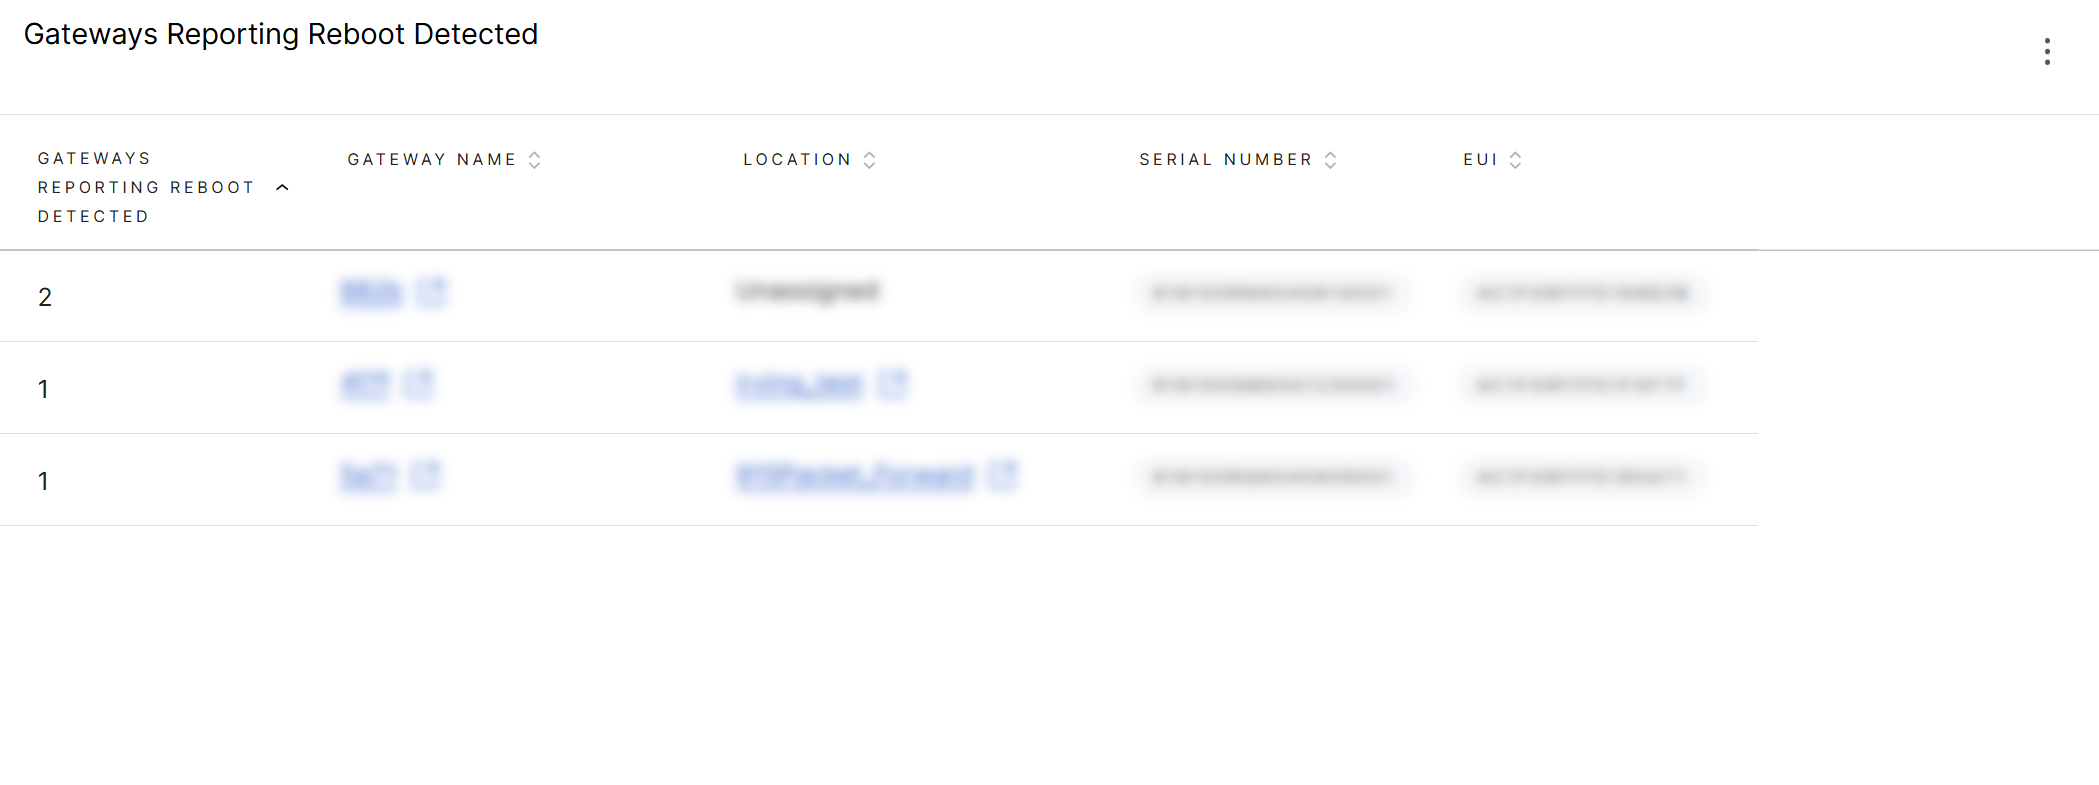 Figure 1: Gateways Reporting Reboot Detected
What it helps you check
This widget helps you identify gateways that reported a reboot-detected state during the selected time range.
A higher value means the gateway reported Reboot detected more often. It may indicate repeated restarts, power instability, firmware stability issues, or site-level environmental problems.
COUNT counts reboot-detected state records. It does not necessarily represent the exact number of reboot events.
How to read the result
Use this widget to prioritize gateways that may need reboot-related investigation. Gateways with higher values should be checked first.
Recommended follow-up checks
- Compare the result with System Uptime to confirm how long the gateway has been running since the last startup.
- Check whether the same gateways also have low uptime in Gateways with Lowest System Uptime.
- Check whether reboot-detected records appeared after an OTA update, scheduled maintenance, or configuration change.
- Check whether multiple gateways reported reboot-detected states at the same time, which may indicate a site-level power event.
- Review CPU Utilization, Available Memory, and OTA State if the reboot may be related to system load or firmware update behavior.
Gateways with Low Uptime
Use this widget to identify gateways that reported low system uptime during the selected time range.
| Configuration Item | Recommended Setting |
|---|---|
| Widget name | Gateways with Low System Uptime |
| Widget type | Table View |
| Metric type | System |
| Metric | System Uptime |
| Operation | MIN |
| Recommended filter | System Uptime < 3600 |
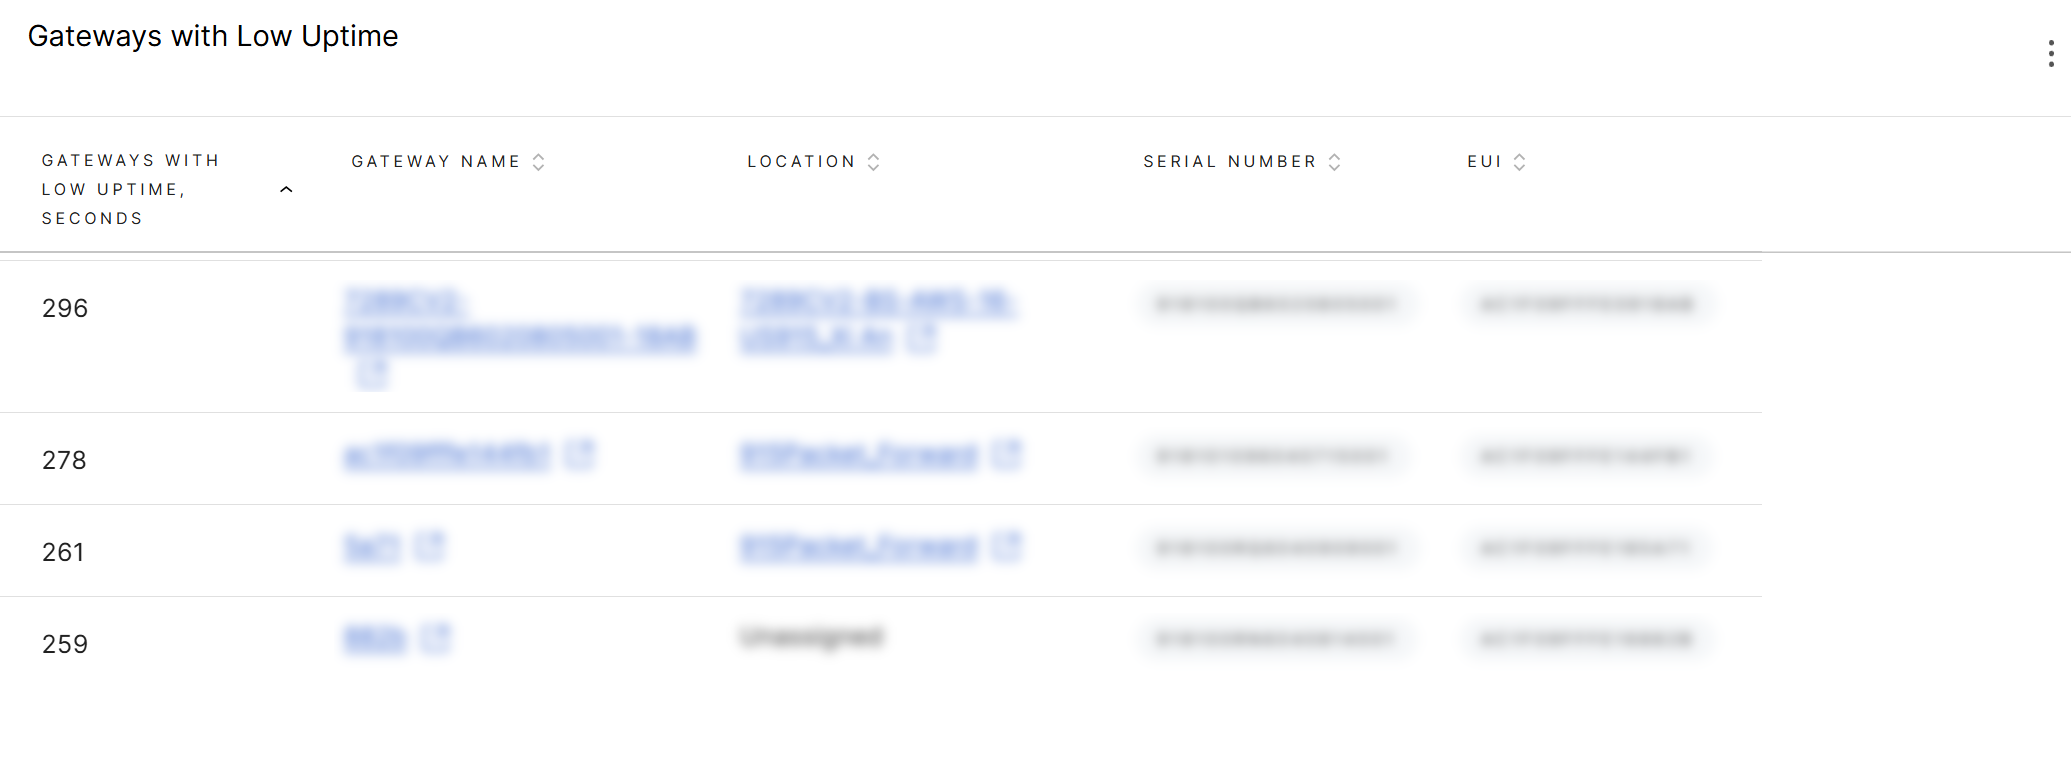 Figure 1: Gateways with Low System Uptime
What it helps you check
This widget helps you identify gateways that recently restarted or reported short system runtime during the selected time range.
A lower value means the gateway had a shorter system uptime. This may indicate a recent reboot, power interruption, firmware instability, or site-level power issue.
How to read the result
With the filter System Uptime < 3600, the table focuses on gateways that reported system uptime lower than one hour.
Use this widget together with Gateway Rebooted to confirm whether the gateway also reported a reboot-detected state.
Recommended follow-up checks
- Check whether the same gateway also appears in Gateways Reporting Reboot Detected.
- Check whether multiple gateways at the same Location reported low uptime at the same time.
- Check whether the low uptime happened after OTA update, scheduled maintenance, or power interruption.
Gateways with High CPU Usage
Use this widget to identify gateways that reported high CPU utilization during the selected time range.
| Configuration Item | Recommended Setting |
|---|---|
| Widget name | Gateways with High CPU Utilization |
| Widget type | Table View |
| Metric type | CPU and Memory Utilization |
| Metric | CPU Utilization |
| Operation | MAX |
| Recommended filter | CPU Utilization > 80 |
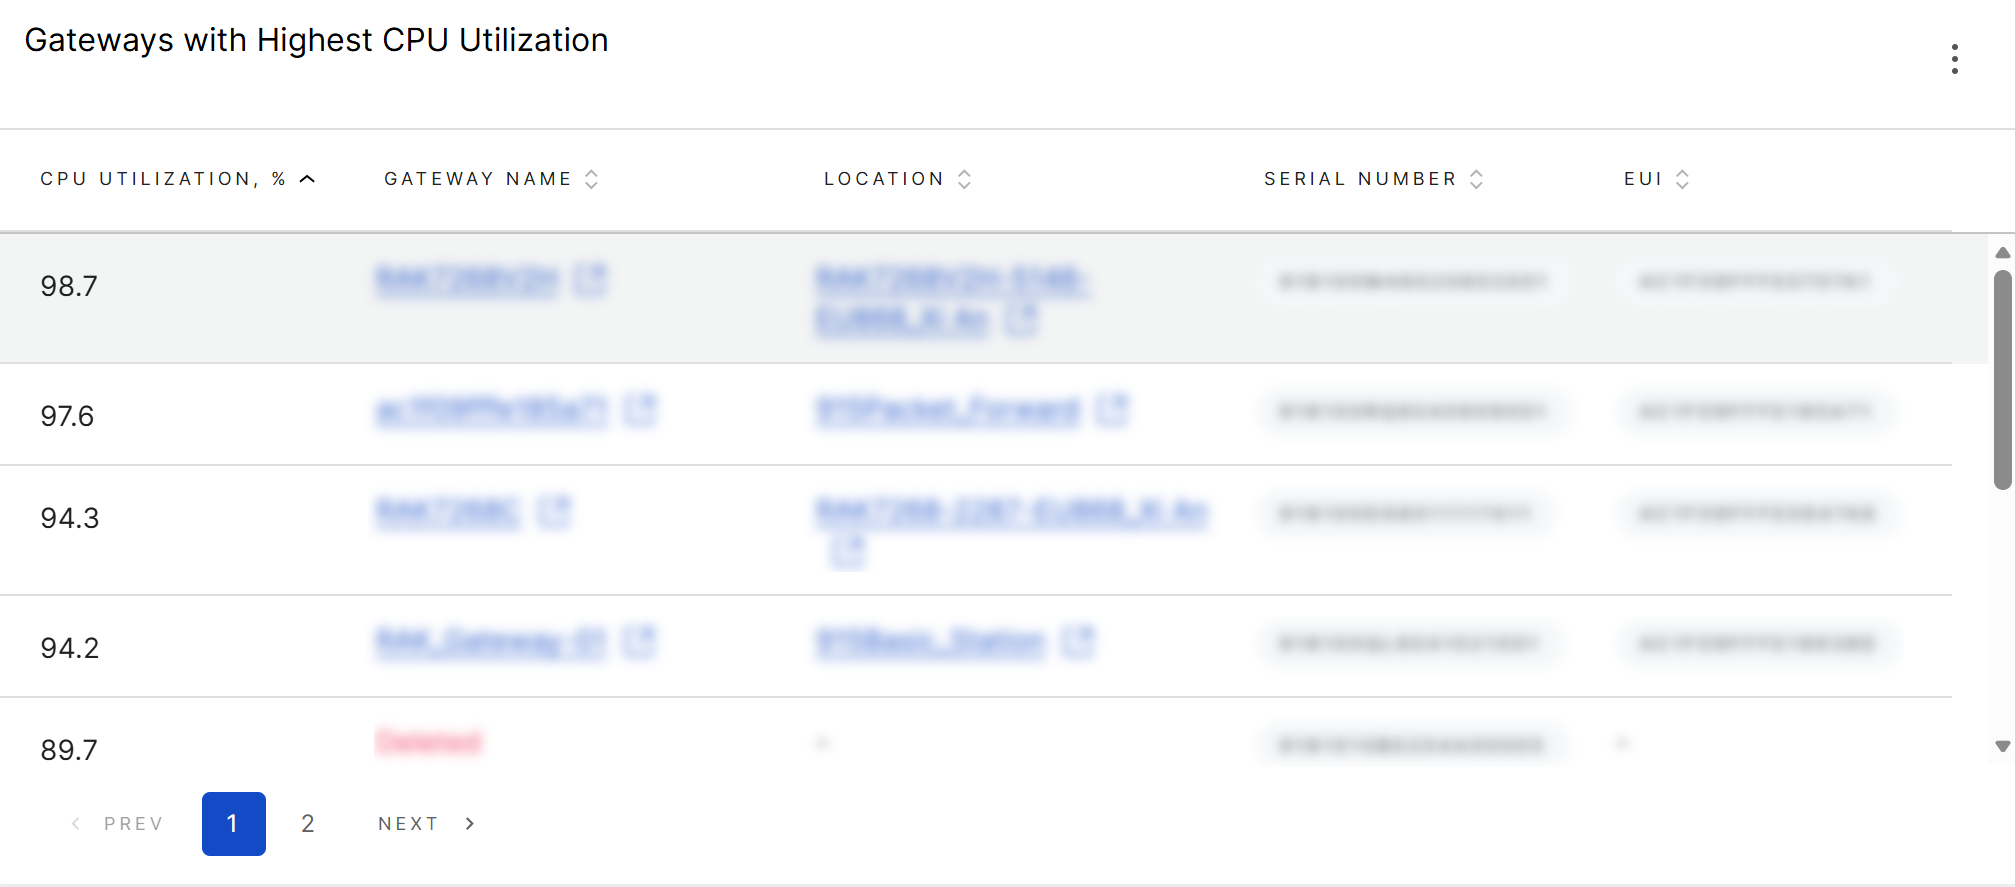 Figure 1: Gateways with High CPU Utilization
What it helps you check
This widget helps you find gateways that reported high CPU usage during the selected time range.
A high CPU value may be temporary, but repeated or long-lasting high CPU usage can indicate heavy services, abnormal processes, frequent reporting, or firmware-level issues.
How to read the result
With the filter CPU Utilization > 80, the table focuses only on gateways that reported CPU utilization higher than 80%.
Use MAX to show the highest CPU utilization reported by each gateway within the filtered data.
Recommended follow-up checks
- Check whether high CPU usage appears repeatedly over time.
- Compare the result with Available Memory, System Uptime, and Gateway Rebooted.
- Check whether high CPU usage happened after firmware update, configuration change, or service enablement.
Gateways with Low Available Memory
Use this widget to identify gateways that reported low available memory during the selected time range.
| Configuration Item | Recommended Setting |
|---|---|
| Widget name | Gateways with Low Available Memory |
| Widget type | Table View |
| Metric type | CPU and Memory Utilization |
| Metric | Available Memory |
| Operation | MIN |
| Recommended filter | Available Memory < 65536 |
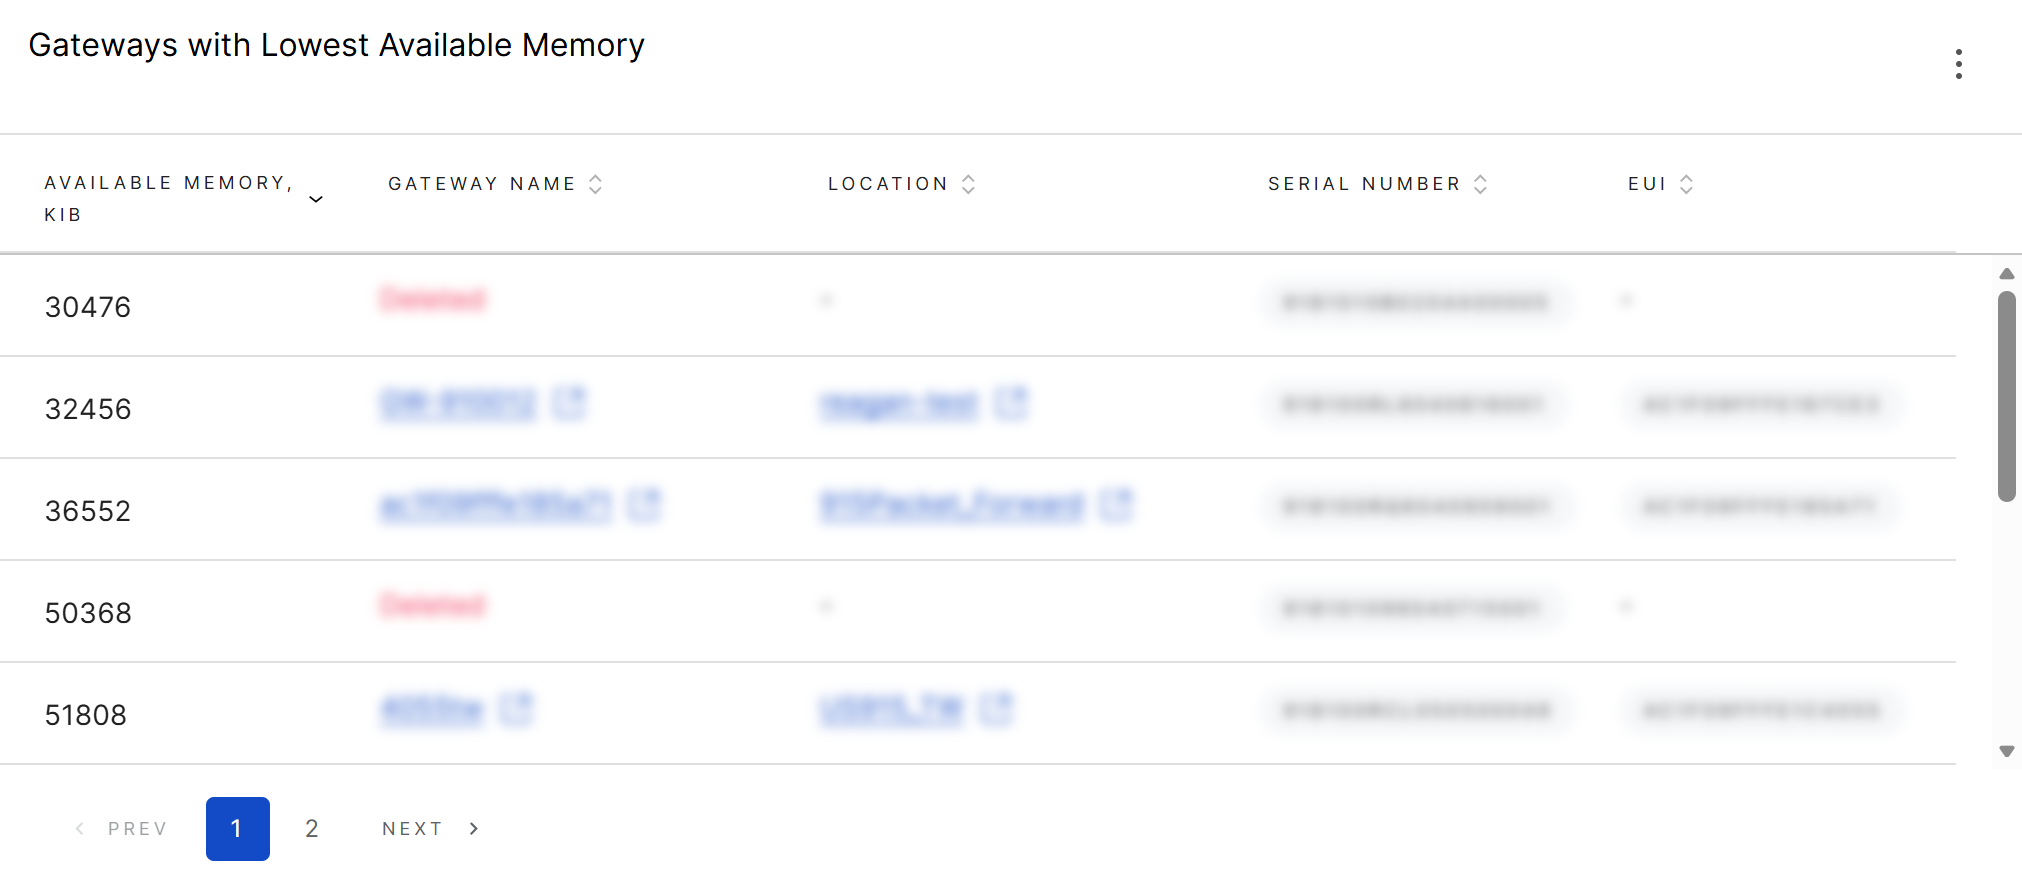 Figure 1: Gateways with Low Available Memory
What it helps you check
This widget helps you locate gateways that may have memory pressure or potential memory leak risk.
A lower value means less available memory. If a gateway repeatedly reports low available memory, it may require service-level or firmware-level investigation.
How to read the result
With the filter Available Memory < 65536, the table focuses on gateways that reported available memory lower than 65,536 KiB.
Use MIN to show the lowest available memory reported by each gateway within the filtered data.
Recommended follow-up checks
- Check whether available memory keeps decreasing over time.
- Compare the result with CPU Utilization, System Uptime, and Gateway Rebooted.
- Check whether the issue appears after enabling additional services, extensions, or firmware updates.
Top Gateways by Offline Status Records
Use this widget to identify gateways that were recorded as Offline most frequently within the selected time range.
| Configuration Item | Recommended Setting |
|---|---|
| Widget name | Top Gateways by Offline Status Records |
| Widget type | Table View |
| Metric type | System |
| Metric | Gateway Count |
| Operation | SUM |
| Recommended filter | Gateway Status = Offline |
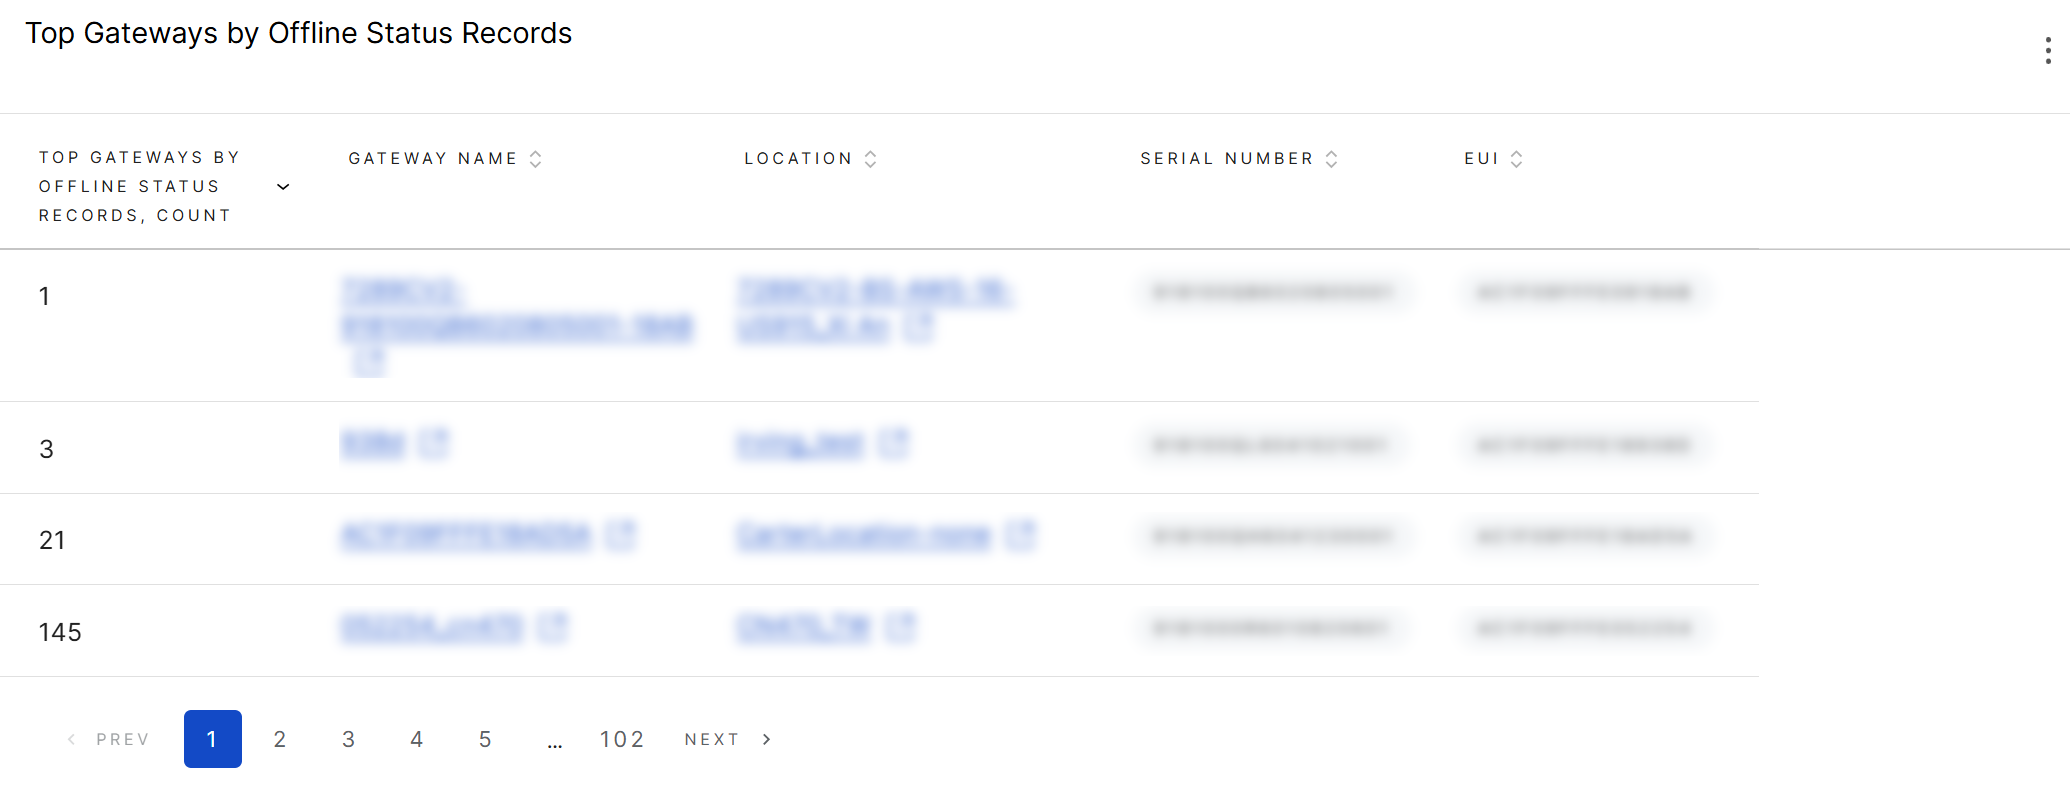 Figure 1: Top Gateways by Offline Status Records
What it helps you check
This widget helps you find gateways that stayed Offline or were recorded as Offline frequently during the selected time range.
A higher value means the gateway had more Offline status records in the selected period.
How to read the result
Use this widget to prioritize gateways that may need investigation. Gateways with higher Offline status records may have long offline duration, unstable WAN connectivity, power issues, or site-level network problems.
Recommended follow-up checks
- Check whether the gateway is currently Online or Offline.
- Review System Uptime and Gateway Rebooted to see whether the gateway recently restarted.
- Review WAN interface, cellular link, and backhaul metrics if the gateway is back online.
- Check whether multiple affected gateways are in the same Location.
Gateway Stability and Resource Trends
Use this dashboard when you need to review gateway availability, uptime stability, and resource usage trends over a longer period.
This dashboard is intended for Last 7 days or a longer time range, depending on your subscription plan and data retention period. It helps you check whether gateway availability, uptime, CPU usage, or available memory is becoming worse over time.
Online Gateway Trend
Use this widget to check whether the number of online gateways remains stable over time.
| Configuration Item | Recommended Setting |
|---|---|
| Widget name | Online Gateway Trend |
| Widget type | Line Chart |
| Metric type | System |
| Metric | Gateway Count |
| Operation | LAST VALUE |
| Recommended filter | Gateway Status = Online |
| Display legend | Enabled |
| Display threshold | Disabled |
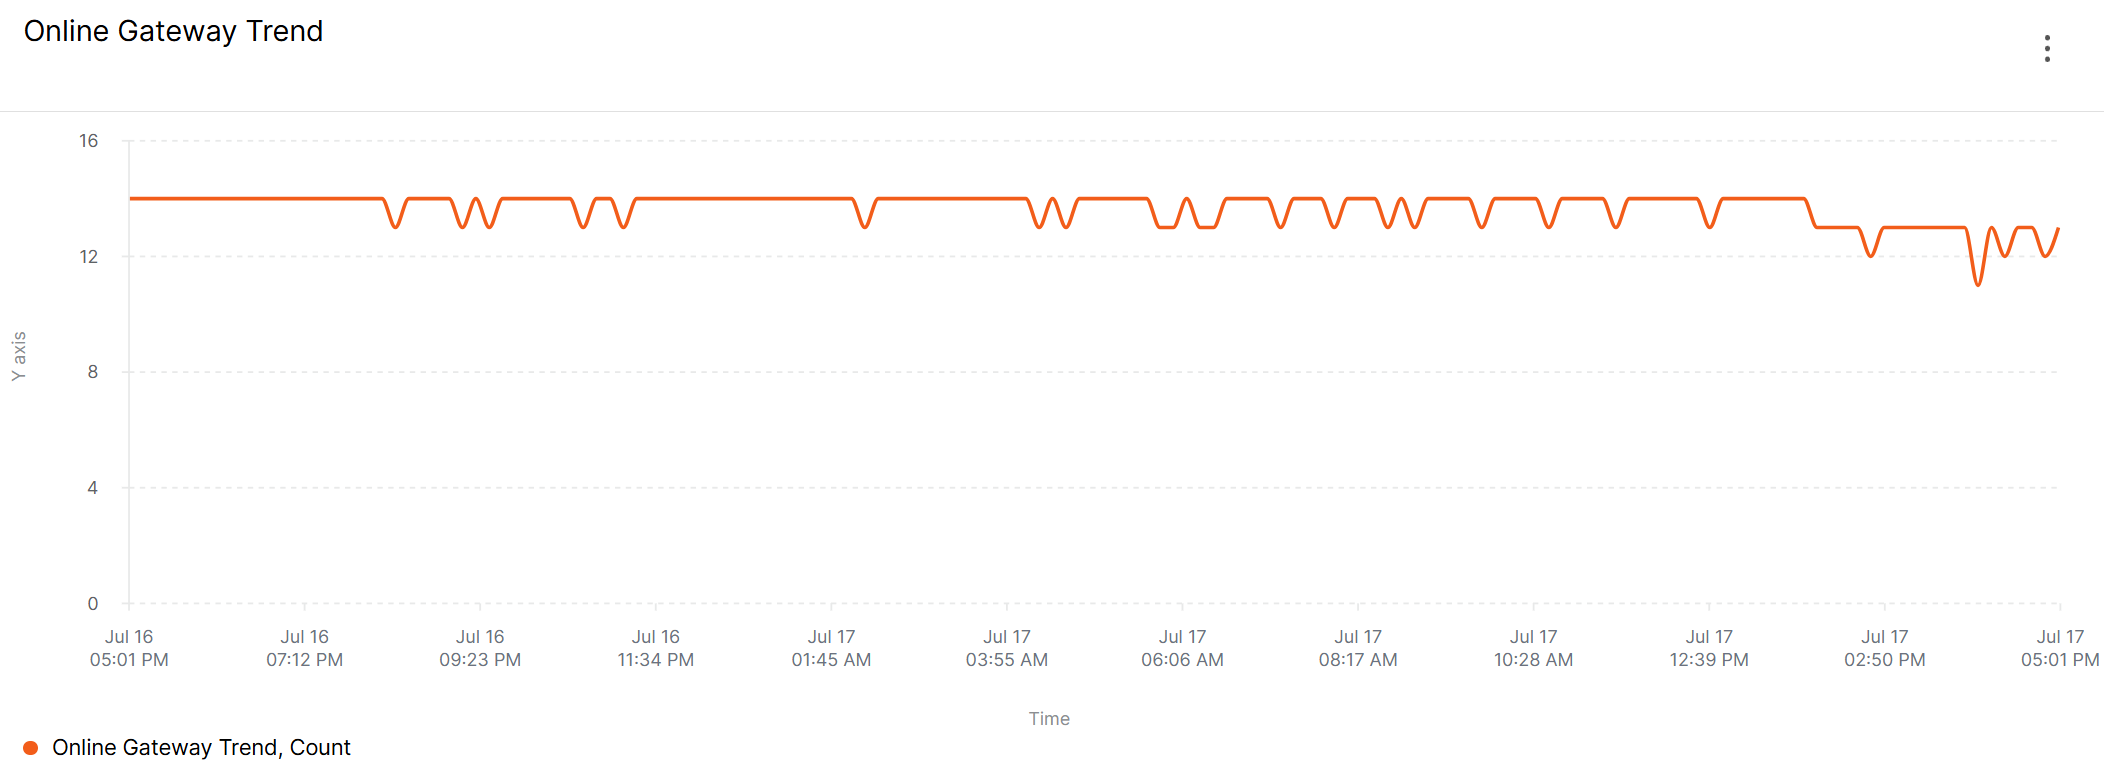 Figure 1: Online Gateway Trend
What it helps you check
This widget shows the trend of gateways whose latest reported status is Online within each time bucket.
It helps you check whether the number of online gateways remains stable over time. A sudden drop may indicate site-level network issues, power issues, batch offline events, or data reporting interruptions.
How to read the result
Each point on the line represents the latest available Online gateway count in that time bucket.
If the trend drops at a specific time, compare it with Gateway Status = Offline, Gateway Rebooted, Network Failover, backhaul traffic, firmware rollout time, or site maintenance records.
Offline Gateway Trend
Use this widget to check whether the number of offline gateways increases over time.
| Configuration Item | Recommended Setting |
|---|---|
| Widget name | Offline Gateway Trend |
| Widget type | Line Chart |
| Metric type | System |
| Metric | Gateway Count |
| Operation | LAST VALUE |
| Recommended filter | Gateway Status = Offline |
| Display legend | Enabled |
| Display threshold | Disabled |
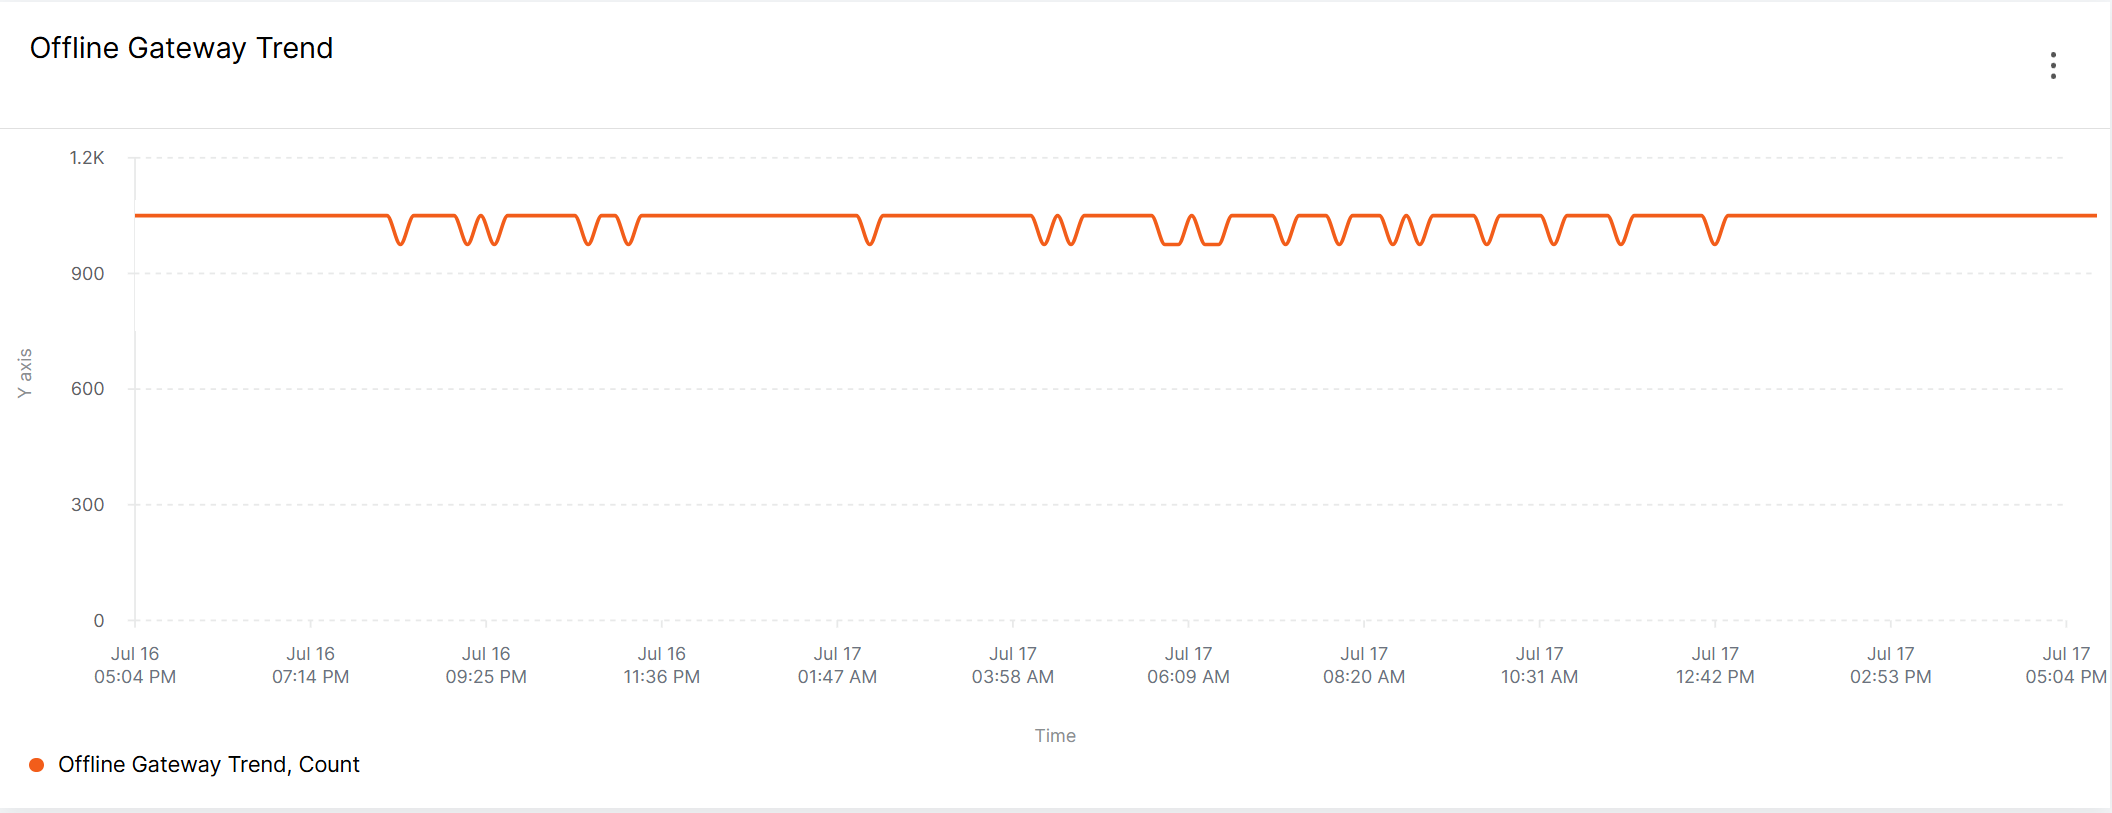 Figure 1: Offline Gateway Trend
What it helps you check
This widget shows the trend of gateways whose latest recorded status is Offline within each time bucket.
A sudden increase may indicate batch offline events, site network interruption, power issues, or gateway connectivity problems.
Gateway Uptime Trend
Use this widget to review gateway running stability over a longer time range.
| Configuration Item | Recommended Setting |
|---|---|
| Widget name | Gateway Uptime Trend |
| Widget type | Area Chart or Line Chart |
| Metric type | System |
| Metric | System Uptime |
| Operation | AVG |
| Recommended filter | None |
| Display legend | Enabled |
| Display threshold | Disabled |
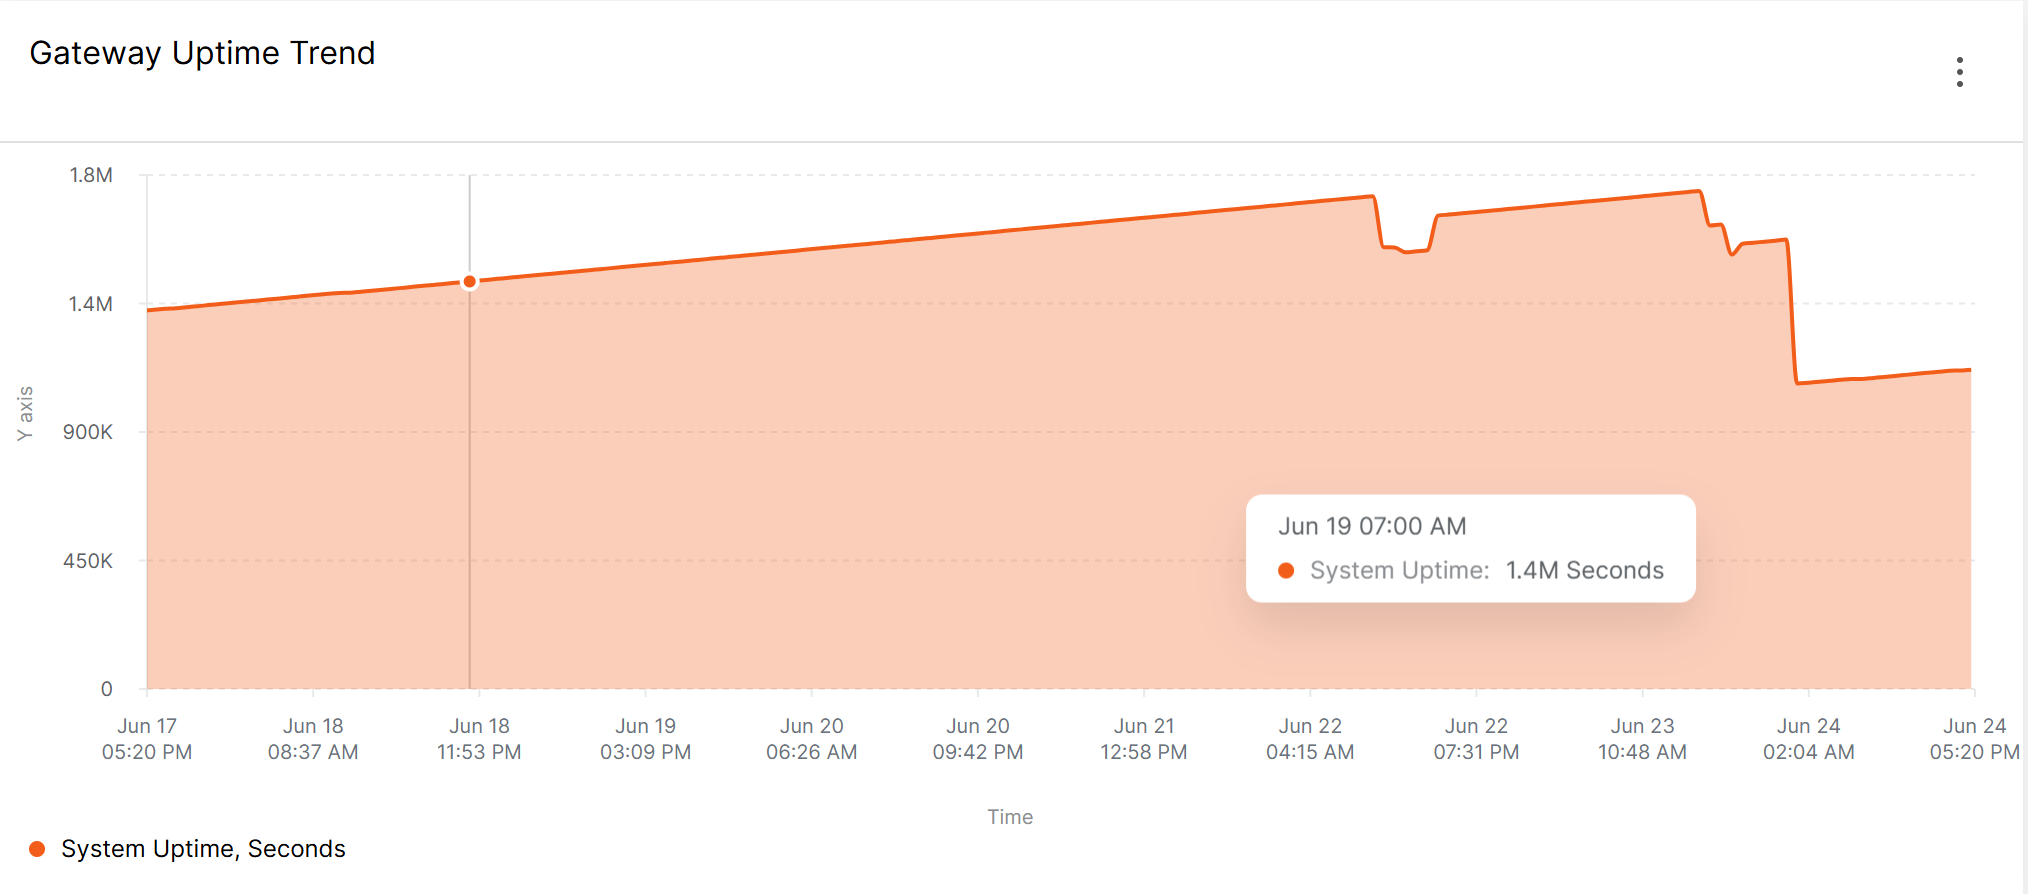 Figure 1: Gateway Uptime Trend
What it helps you check
This widget helps you check whether gateways are running continuously across the selected scope.
System uptime normally increases over time. A sudden drop in the trend may indicate that multiple gateways restarted around the same time, typically due to firmware OTA, power outages, configuration changes, or site-level maintenance.
How to read the trend
Use AVG to review the general uptime trend across the selected gateway scope.
If you need to identify specific gateways with recent restarts, use a Table View with System Uptime + MIN or Gateway Rebooted = Reboot detected.
Also useful for
Post-OTA recovery validation. Use this widget to confirm whether gateways restarted normally or are stuck in repeated reboot cycles.
Reboot Detected Report Trend
Use this widget to check whether reboot-detected state records increase during the selected time range.
| Configuration Item | Recommended Setting |
|---|---|
| Widget name | Reboot Detected Report Trend |
| Widget type | Bar Chart or Line Chart |
| Metric type | System |
| Metric | Gateway Rebooted |
| Operation | COUNT |
| Recommended filter | Gateway Rebooted = Reboot detected |
| Display legend | Enabled |
| Display threshold | Disabled |
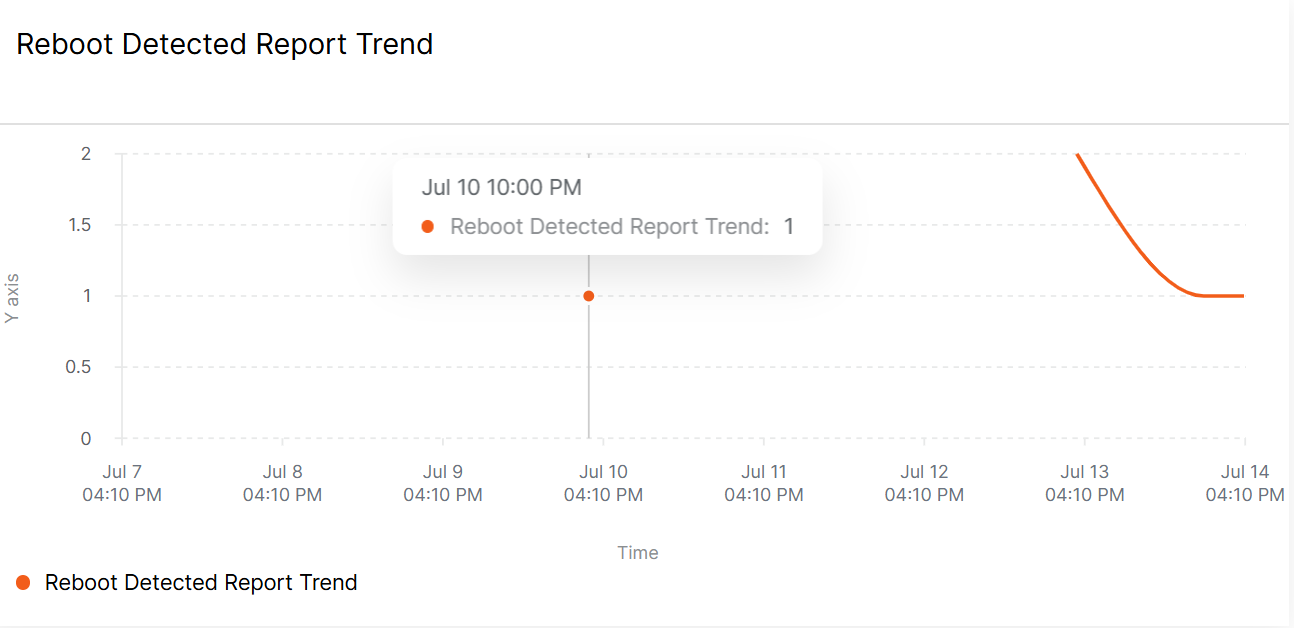 Figure 1: Reboot Detected Report Trend
What it helps you check
This widget helps you identify whether gateways are reporting more Reboot detected states over time.
A spike may indicate firmware stability issues, power instability, OTA-related restarts, or site-level environmental problems.
How to read the result
COUNT counts reboot-detected state records. It does not necessarily represent the exact number of reboot events or unique rebooted gateways.
To identify affected gateways, use a Table View with Gateway Rebooted = Reboot detected. To confirm how long a gateway has been running since startup, compare the result with System Uptime.
CPU Utilization Trend
Use this widget to review CPU utilization changes over time.
| Configuration Item | Recommended Setting |
|---|---|
| Widget name | CPU Utilization Trend |
| Widget type | Line Chart |
| Metric type | CPU and Memory Utilization |
| Metric | CPU Utilization |
| Operation | AVG |
| Recommended filter | None |
| Display legend | Enabled |
| Display threshold | Optional, for example 80% |
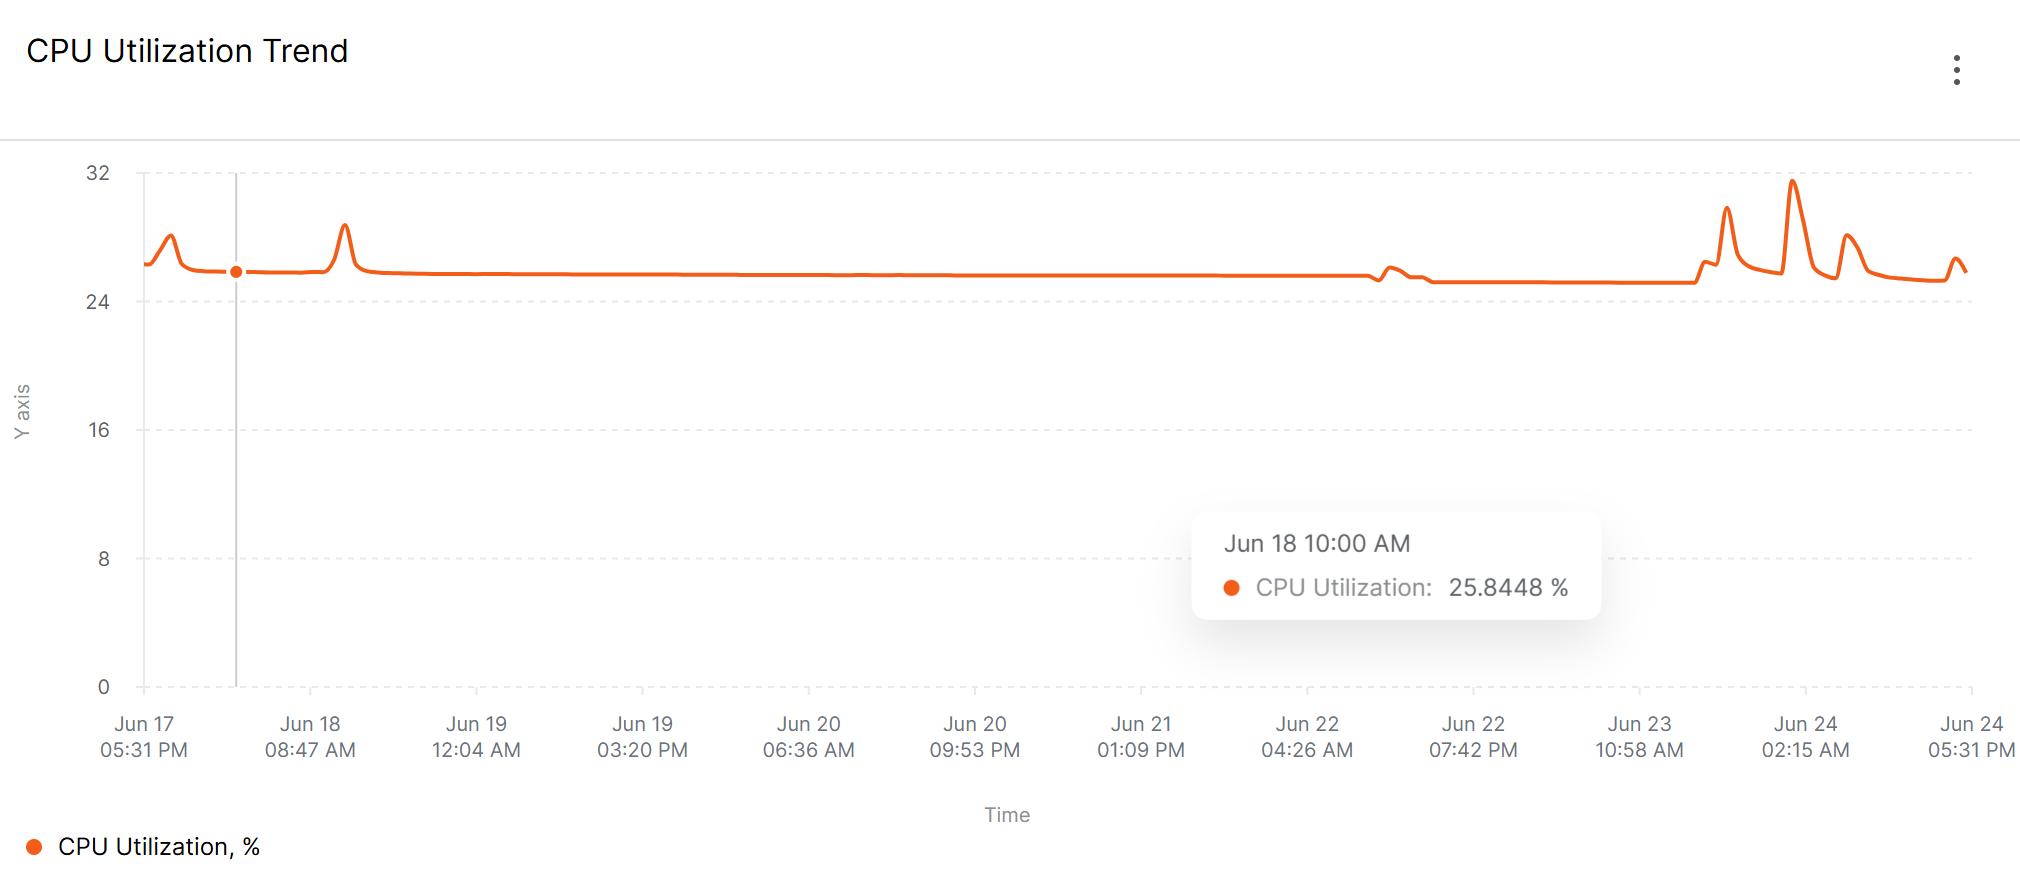 Figure 1: CPU Utilization Trend
What it helps you check
This widget helps you check whether CPU load is increasing, staying high, or returning to normal over time.
Use AVG for general trend review. Use MAX in a Table View when you want to identify gateways with peak CPU usage.
How to read the trend
- Short spikes may be caused by normal scheduled tasks or temporary reporting bursts.
- A sustained high trend may indicate heavy services, abnormal processes, or firmware-level issues.
- A CPU increase followed by reboot-detected records may indicate system pressure before instability.
Available Memory Trend
Use this widget to review available memory changes over time.
| Configuration Item | Recommended Setting |
|---|---|
| Widget name | Available Memory Trend |
| Widget type | Line Chart |
| Metric type | CPU and Memory Utilization |
| Metric | Available Memory |
| Operation | AVG |
| Recommended filter | None |
| Display legend | Enabled |
| Display threshold | Optional |
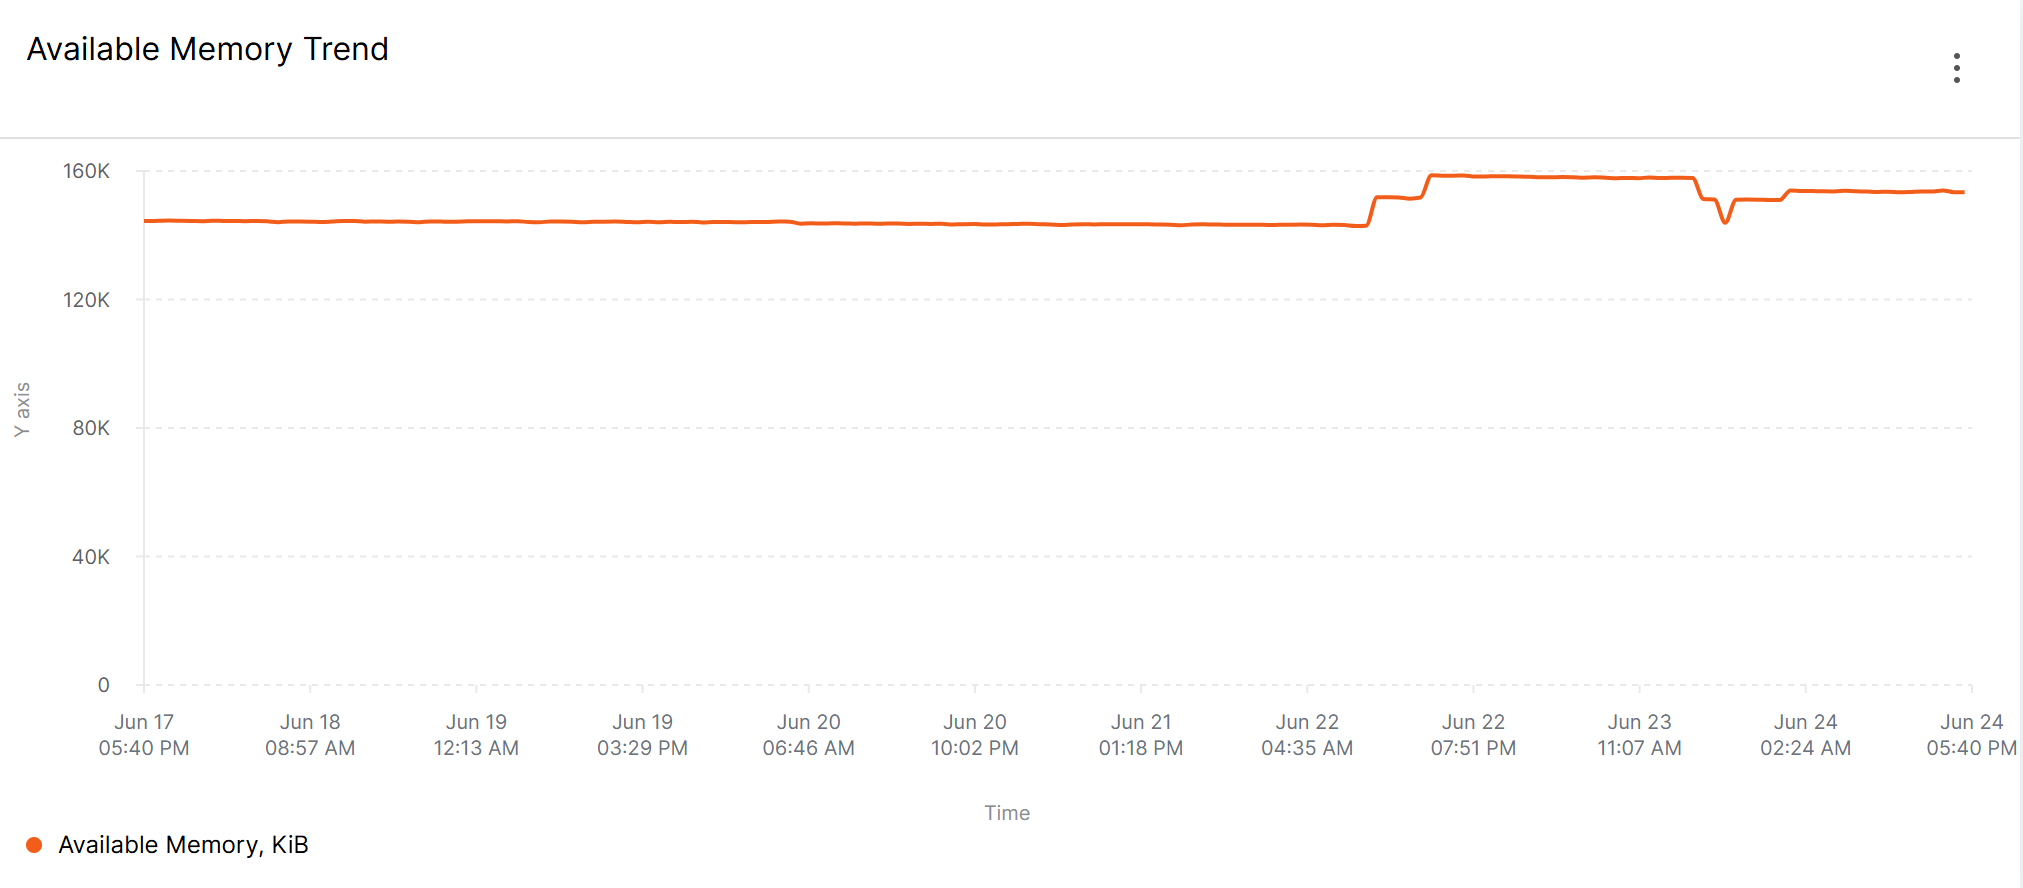 Figure 1: Available Memory Trend
What it helps you check
This widget helps you check whether available memory is decreasing over time across the selected gateway scope.
Use AVG for general trend review. Use MIN in a Table View when you want to identify gateways with the lowest available memory.
How to read the trend
A gradual decrease in available memory over several days may indicate a memory leak or long-running service issue.
If available memory drops together with CPU spikes, low uptime, or reboot-detected records, investigate the affected gateways in detail.
Network and Backhaul Connectivity
Use this dashboard when you need to check recent WAN connection status, backhaul traffic, cellular connectivity, and interface-related issues.
This dashboard is intended for Last 24 hours review. It is useful for network operation, cellular-backhaul deployments, failover checks, and backhaul traffic troubleshooting.
Gateways Using Cellular as Active WAN
Use this widget to identify gateways currently or recently using Cellular as the active WAN interface.
| Configuration Item | Recommended Setting |
|---|---|
| Widget name | Gateways Using Cellular as Active WAN |
| Widget type | Table View |
| Metric type | Network Interface — MultiWAN |
| Metric | Gateways Using Cellular Interface |
| Operation | LAST VALUE |
| Recommended filter | None |
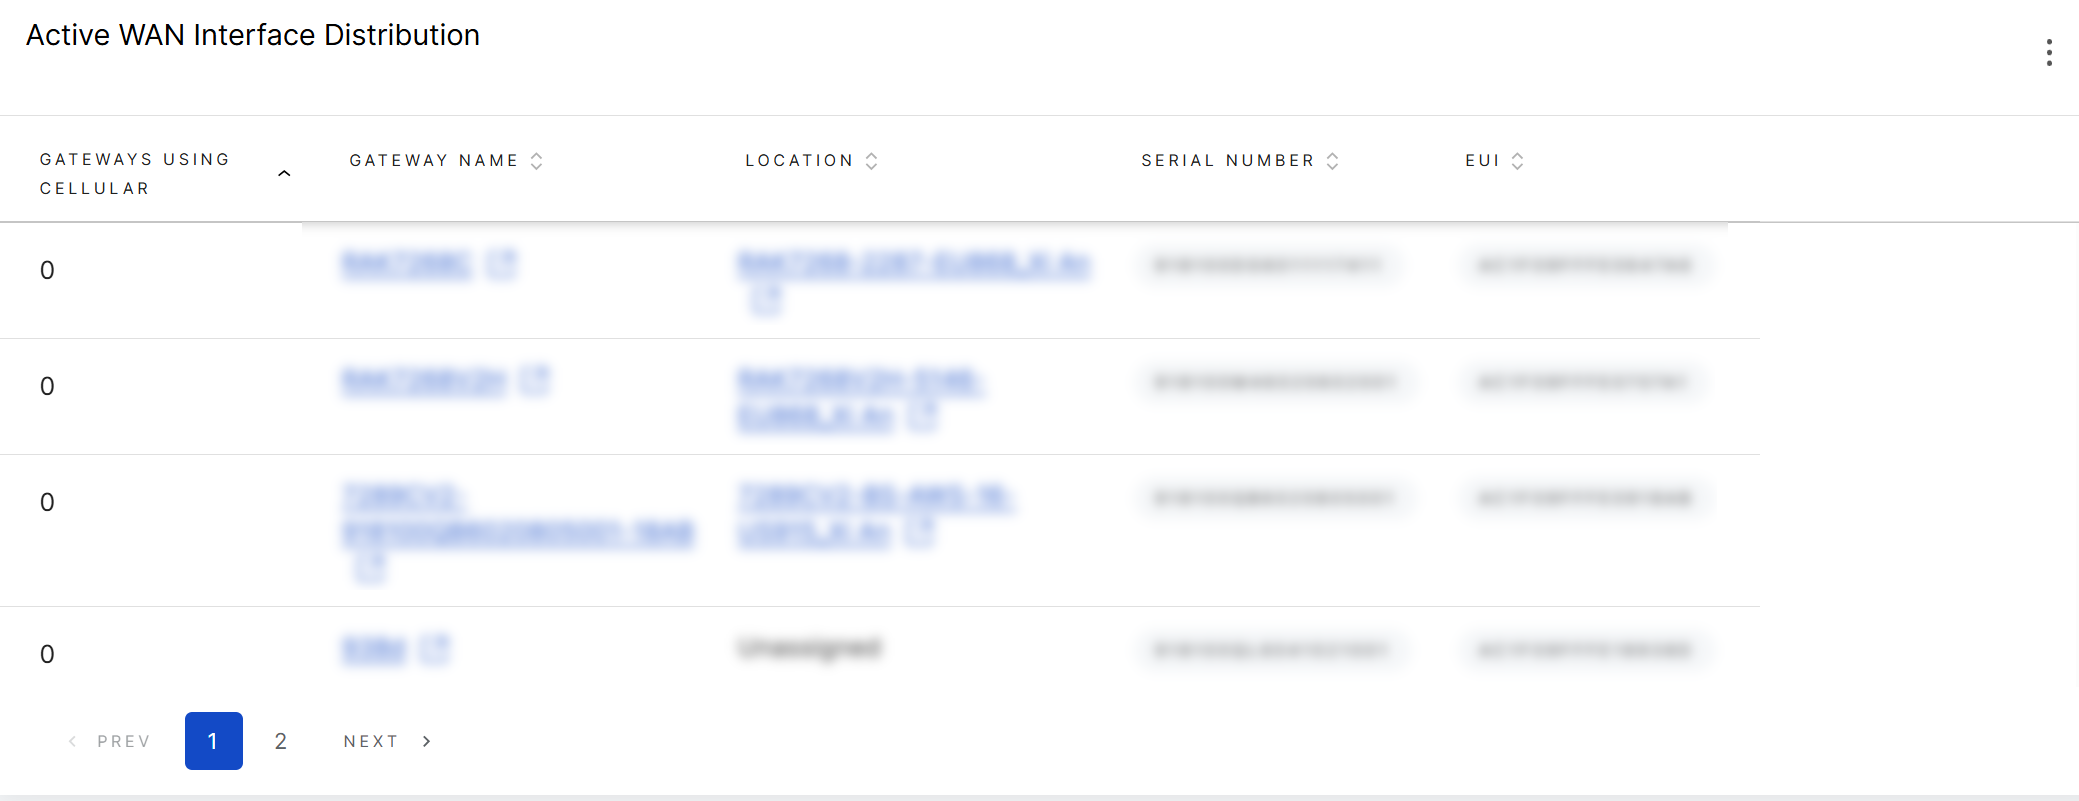 Figure 1: Gateways Using Cellular as Active WAN
What it helps you check
This widget helps you find gateways that are using Cellular as the active WAN interface.
It is useful for reviewing failover behavior, cellular data cost risk, or unexpected cellular-backhaul usage.
Recommended follow-up checks
- Check whether these gateways also reported Network Failover = Failover detected.
- Check whether Ethernet or Wi-Fi uptime is low.
Network Failover Report Trend
Use this widget to monitor how often gateways report the Failover detected state over time.
| Configuration Item | Recommended Setting |
|---|---|
| Widget name | Network Failover Report Trend |
| Widget type | Line Chart or Bar Chart |
| Metric type | Network Interface |
| Metric | Network Failover |
| Operation | COUNT |
| Recommended filter | Network Failover = Failover detected |
| Display legend | Enabled |
| Display threshold | Optional |
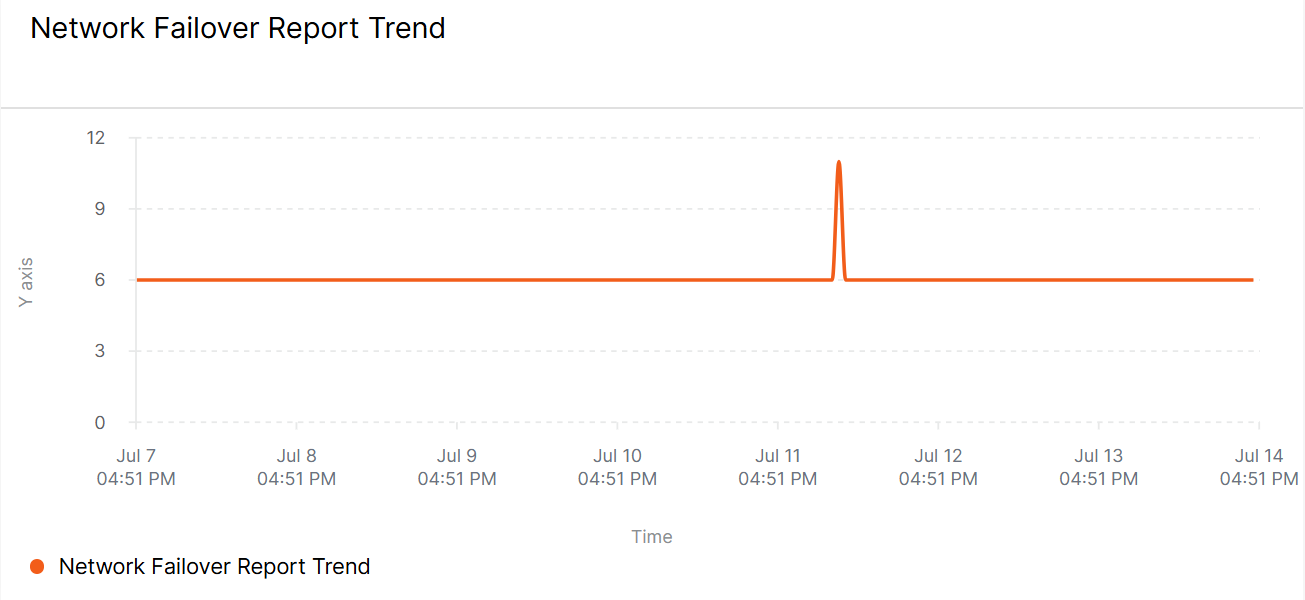 Figure 1: Network Failover Report Trend
What it helps you check
This widget helps you identify whether WAN failover states are increasing over time.
A spike may indicate Ethernet instability, Wi-Fi instability, cellular fallback, site-level network issues, or WAN tracking failures.
How to read the result
COUNT counts failover-detected state records. It does not necessarily represent unique failover events or unique gateways.
Gateways Reporting Network Failover
Use this widget to identify gateways that reported a network failover state during the selected time range.
| Configuration Item | Recommended Setting |
|---|---|
| Widget name | Gateways Reporting Network Failover |
| Widget type | Table View |
| Metric type | Network Interface |
| Metric | Network Failover |
| Operation | COUNT |
| Recommended filter | Network Failover = Failover detected |
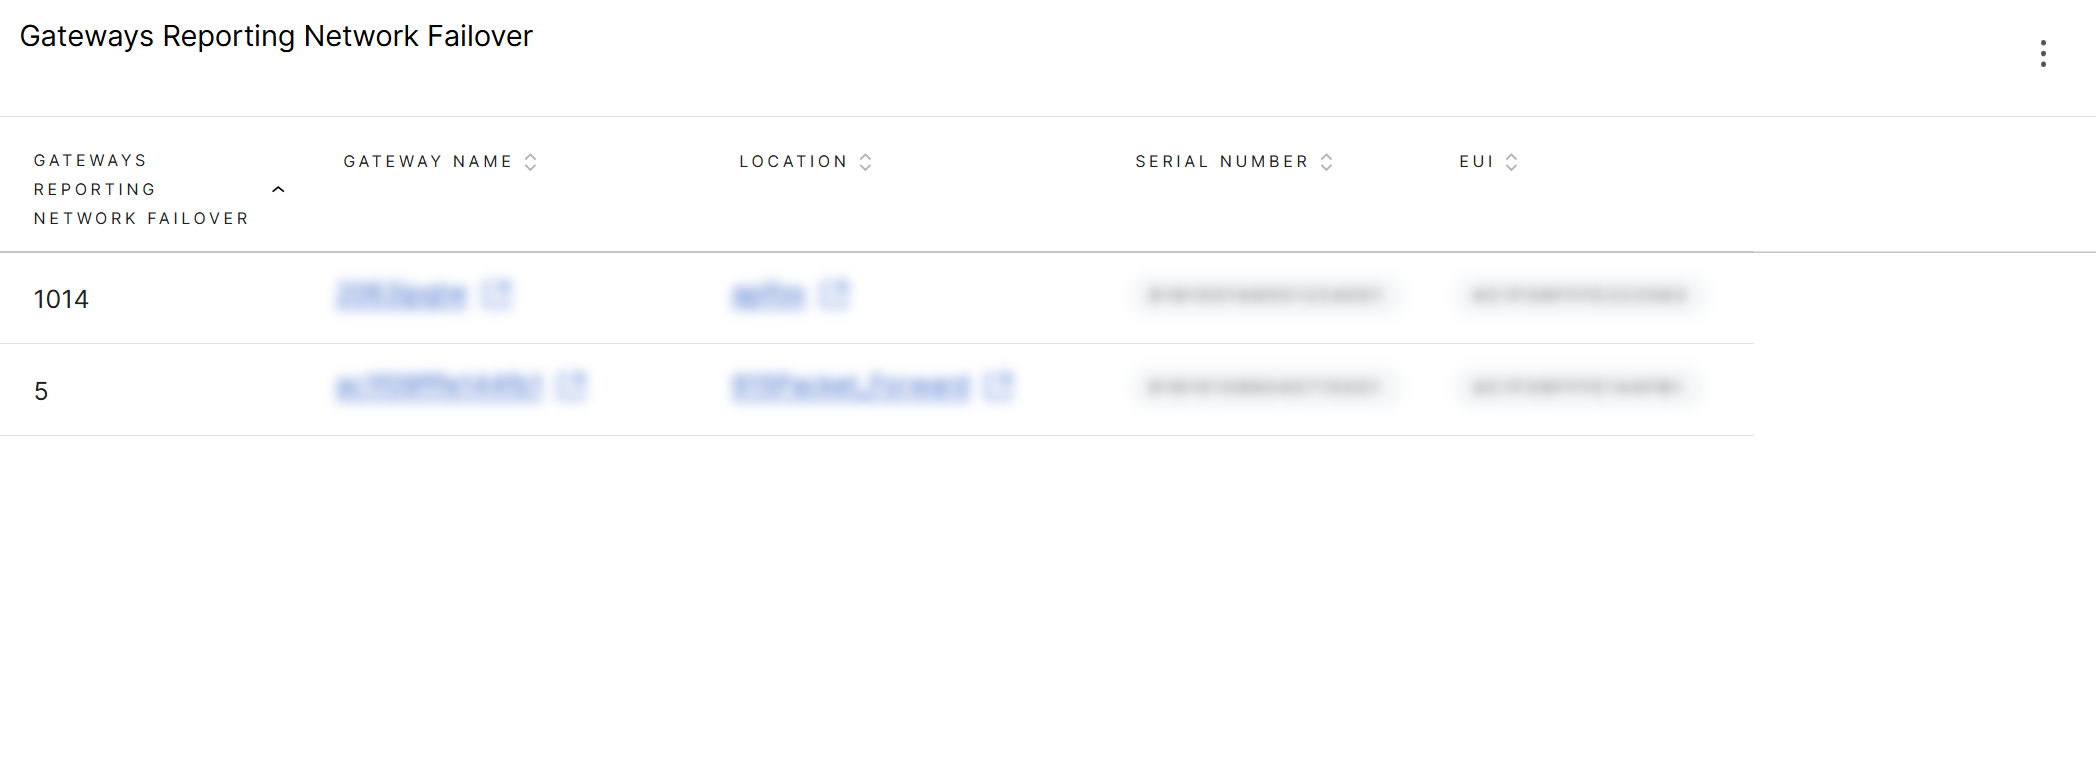 Figure 1: Gateways Reporting Network Failover
What it helps you check
This widget helps you find gateways that reported Failover detected.
A higher value means the gateway reported the failover state more often during the selected time range.
Recommended follow-up checks
- Check active WAN interface metrics to see which interface is currently active.
- Check Ethernet, Wi-Fi, or Cellular uptime to see whether an interface recently reconnected.
- Check backhaul traffic to see whether traffic shifted to Cellular.
- Check Location to see whether failover reports are concentrated at the same site.
Network Failover only indicates that a failover state was reported. It does not show the failover direction, such as Ethernet to Cellular.
Interface Traffic Daily View
Use this widget to review transmitted and received backhaul traffic across gateways.
| Configuration Item | Recommended Setting |
|---|---|
| Widget name | Interface Traffic Daily View |
| Widget type | Stacked Bar Chart or Area Chart |
| Display legend | Enabled |
| Display threshold | Optional |
Metrics to Display
| Metric Name | Metric Type | Metric | Operation | Recommended Filter | Purpose |
|---|---|---|---|---|---|
| Transmitted Traffic | Network Interface | Transmitted Traffic (Bytes) | SUM | Network Interface, if needed | Shows total transmitted traffic volume. |
| Received Traffic | Network Interface | Received Traffic (Bytes) | SUM | Network Interface, if needed | Shows total received traffic volume. |
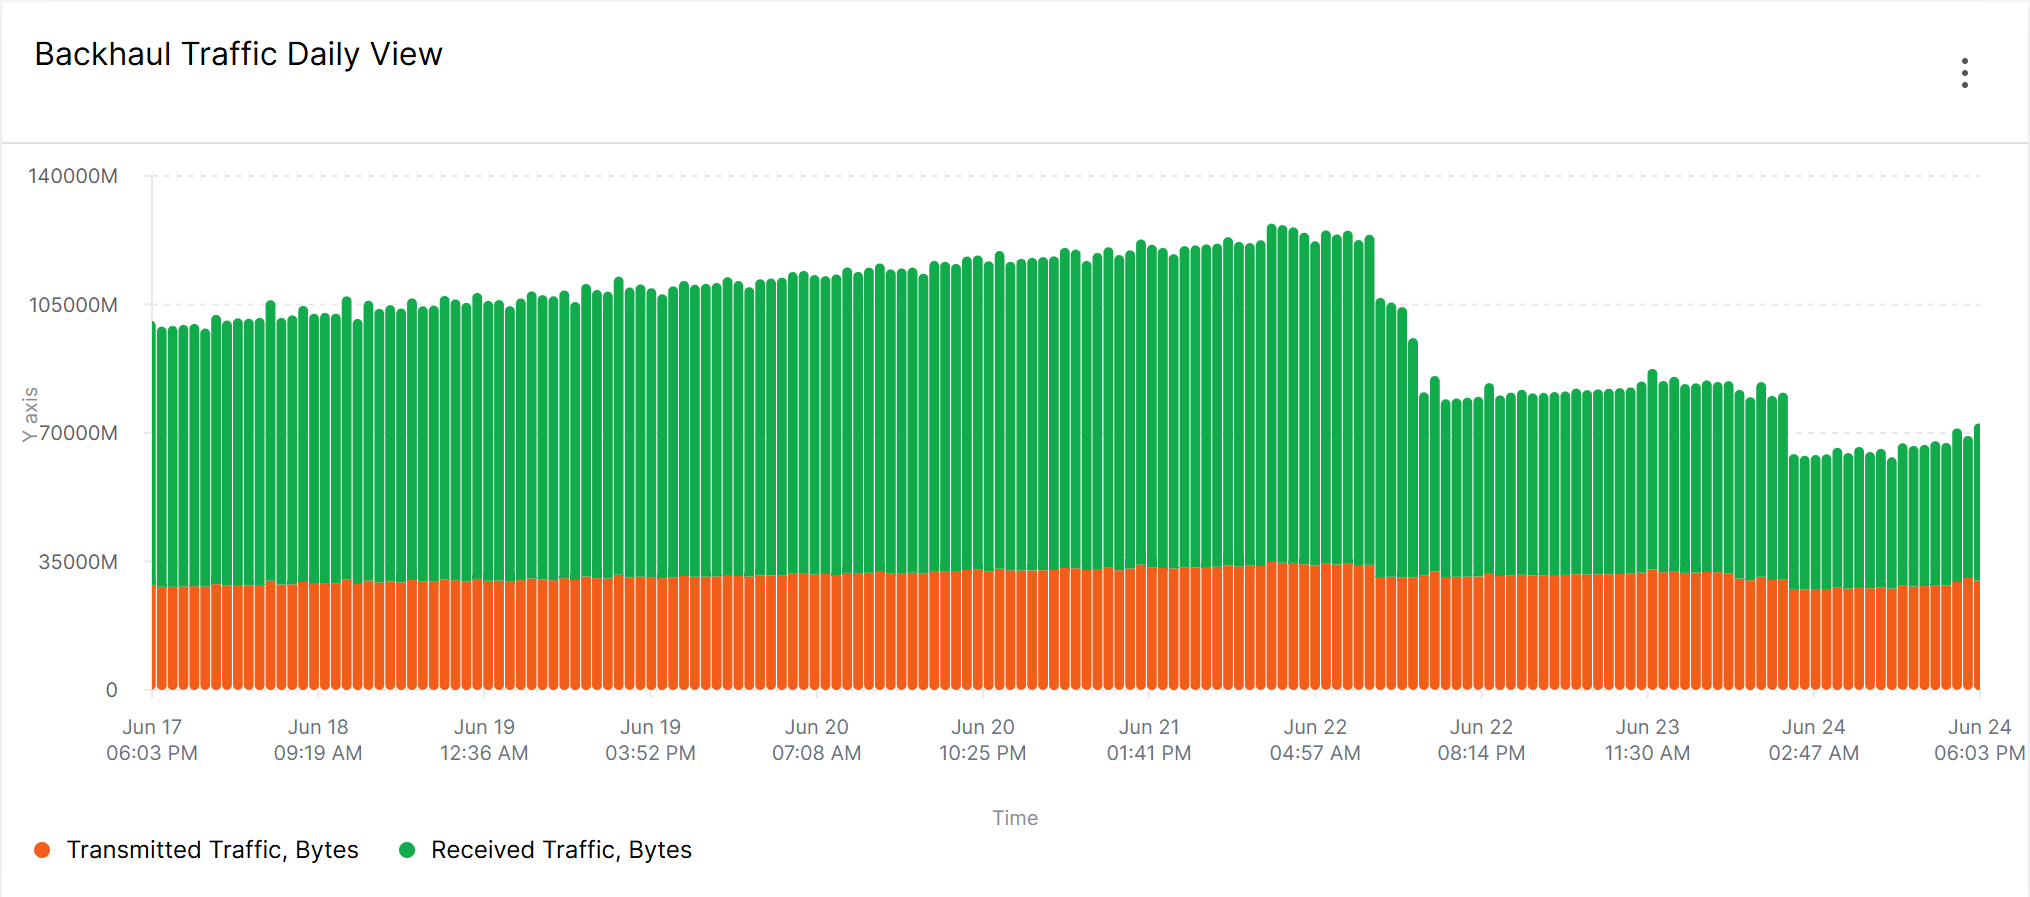 Figure 1: Backhaul Traffic Daily View
What it helps you check
This widget helps you monitor backhaul traffic volume changes across the selected gateway scope.
A sudden traffic increase may indicate abnormal data volume, retransmission, heavy application traffic, or cellular data cost risk. A sudden traffic drop may indicate gateway offline events, network interruption, or upstream connectivity issues.
Traffic metrics show reported traffic volume in bytes. They should not be read as real-time bandwidth.
Use the Interface filter when you need to review Ethernet, Wi-Fi, or Cellular traffic separately.
Top Gateways by Transmitted Traffic
Use this widget to identify gateways with high transmitted backhaul traffic.
| Configuration Item | Recommended Setting |
|---|---|
| Widget name | Top Gateways by Transmitted Traffic |
| Widget type | Table |
| Metric type | Network Interface |
| Metric | Transmitted Traffic (Bytes) |
| Operation | SUM |
| Recommended filter | Network Interface, if needed |
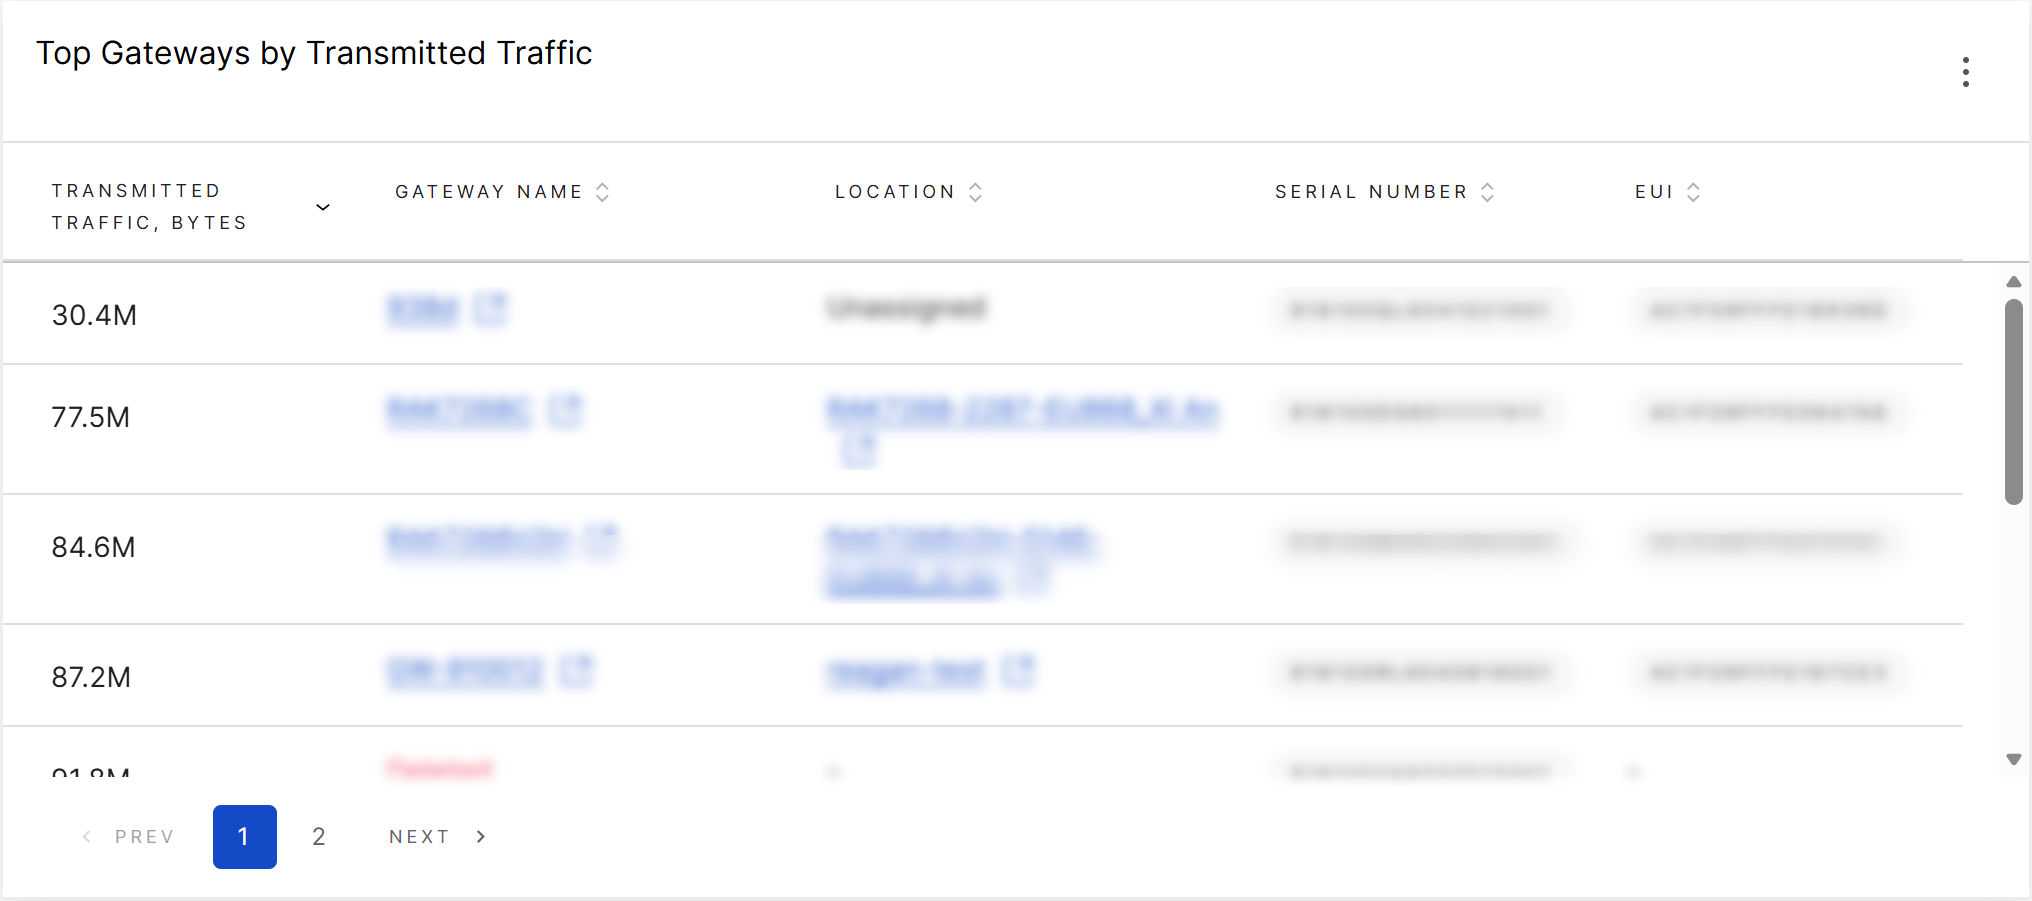 Figure 1: Top Gateways by Transmitted Traffic
What it helps you check
This widget helps identify gateways that transmitted a large amount of backhaul traffic during the selected time range.
Use SUM when you want to review total transmitted traffic. Use MAX only when you specifically want to identify traffic peaks within a time bucket.
Recommended follow-up checks
- Use Interface = Cellular to check cellular data usage risk.
- Compare transmitted traffic with received traffic.
- Check whether high traffic is concentrated in a specific Location.
Top Gateways by Received Traffic
Use this widget to identify gateways with high received backhaul traffic.
| Configuration Item | Recommended Setting |
|---|---|
| Widget name | Top Gateways by Received Traffic |
| Widget type | Table |
| Metric type | Network Interface |
| Metric | Received Traffic (Bytes) |
| Operation | SUM |
| Recommended filter | Network Interface, if needed |
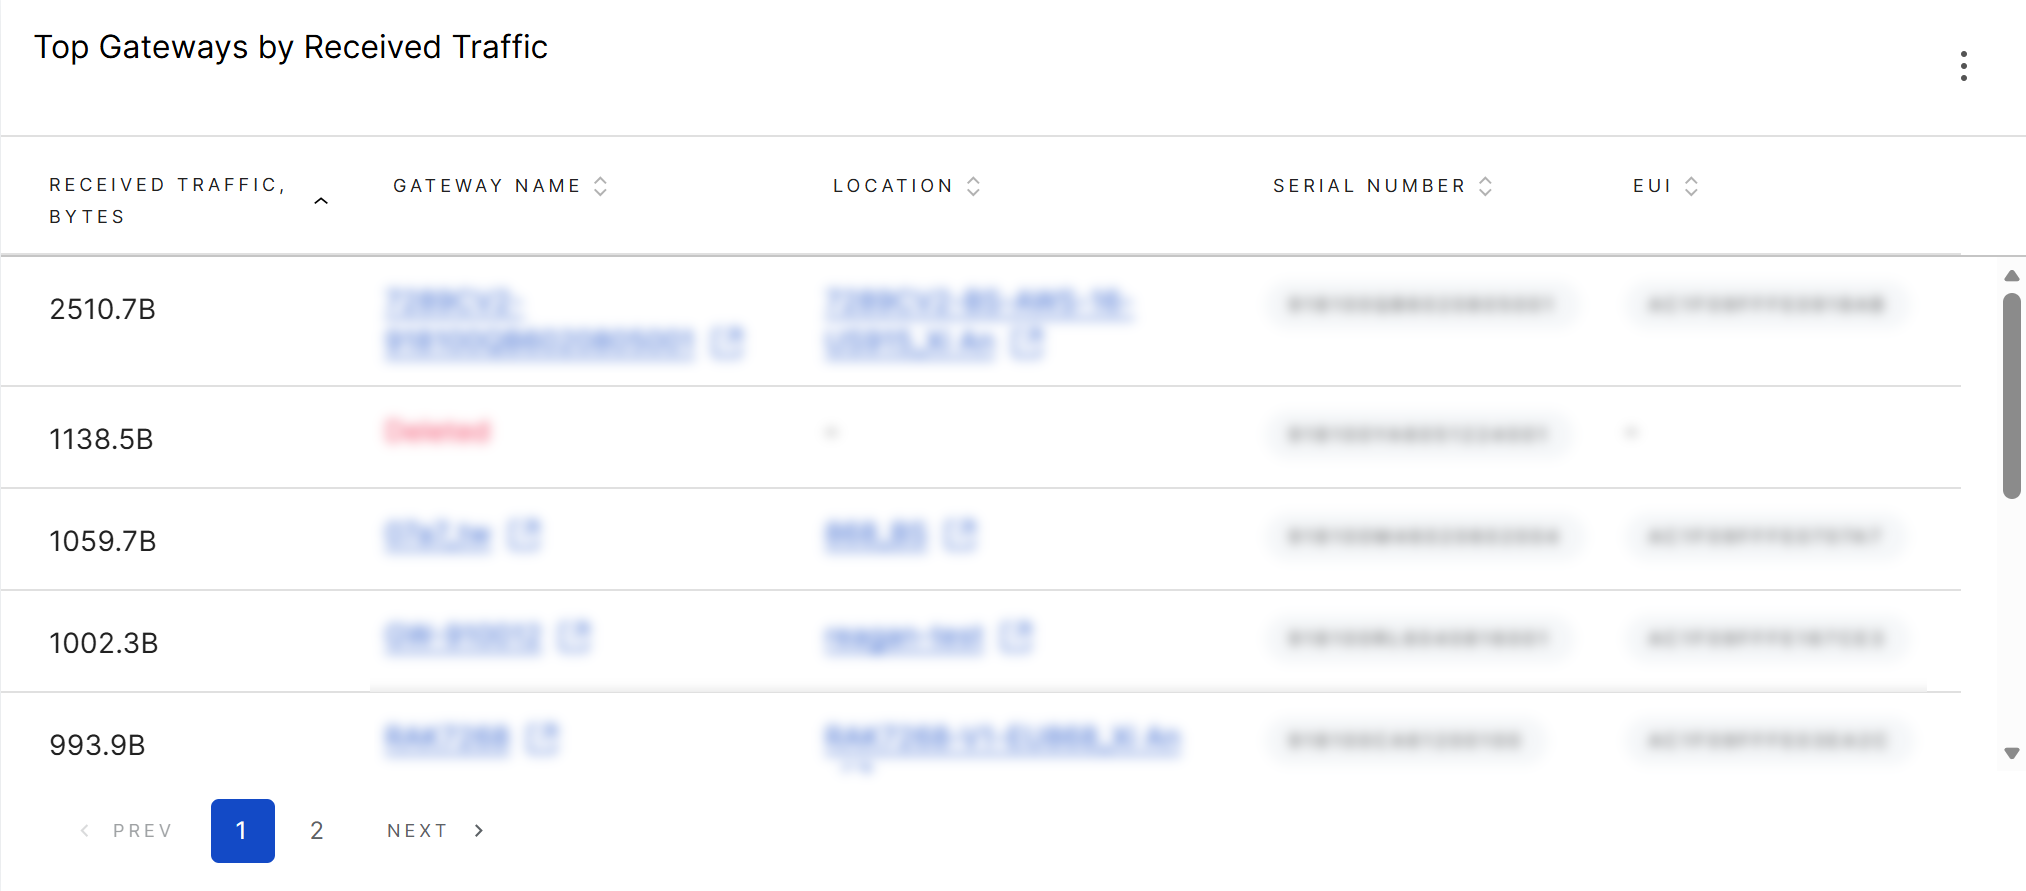 Figure 1: Top Gateways by Received Traffic
What it helps you check
This widget helps identify gateways that are receiving a large amount of backhaul traffic. Use SUM when you want to review total received traffic during the selected time range. Use MAX when you want to identify gateways with traffic peaks.
This widget is useful for finding gateways with abnormal inbound traffic, heavy management traffic, unexpected download behavior, or possible network-side traffic issues.
Cellular Link Disconnection Tracker
Use this widget to identify specific gateways that experienced cellular disconnections during the selected time range.
| Configuration Item | Recommended Setting |
|---|---|
| Widget name | Cellular Link Disconnection Tracker |
| Widget type | Table |
| Metric type | Network Interface - Cellular Connectivity |
| Metric | Cellular Link Status |
| Operation | MIN |
| Recommended filter | Location, if needed |
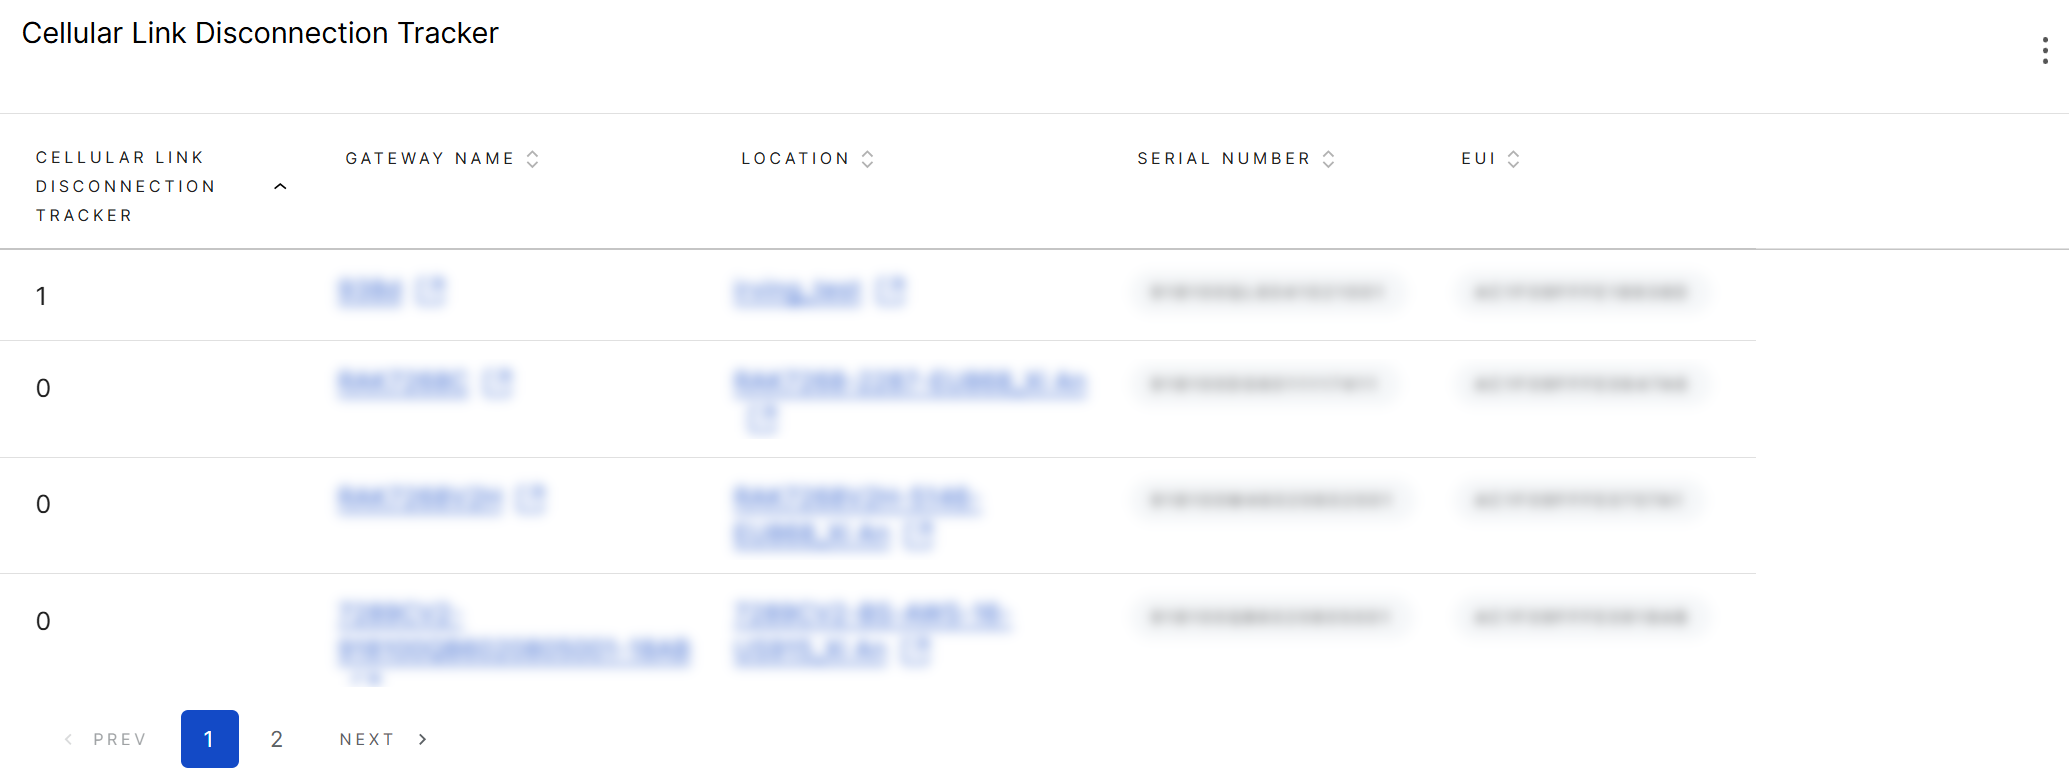 Figure 1: Cellular Link Disconnection Tracker
How to read the table
| MIN Value | Meaning | Action |
|---|---|---|
| 1 | Cellular link stayed connected during the selected time range. | No action needed |
| 0 | Cellular link was disconnected at least once during the selected time range. | Investigate — check SIM card, signal coverage, module health, or APN configuration |
What it helps you check
This widget helps you find gateways that had cellular link disconnection during the selected time range. Use this widget when you need to troubleshoot cellular connection failures. A cellular disconnection is different from weak signal. A gateway may have weak signal but still stay connected, or it may disconnect because of SIM, APN, carrier, module, or power issues.
Gateways with Weak Cellular Signal
Use this widget to identify gateways with weak cellular signal.
| Configuration Item | Recommended Setting |
|---|---|
| Widget name | Gateways with Weak Cellular Signal |
| Widget type | Table |
| Metric type | Network Interface-Cellular Connectivity |
| Metric | Cellular Signal |
| Operation | MIN |
| Recommended filter | None |
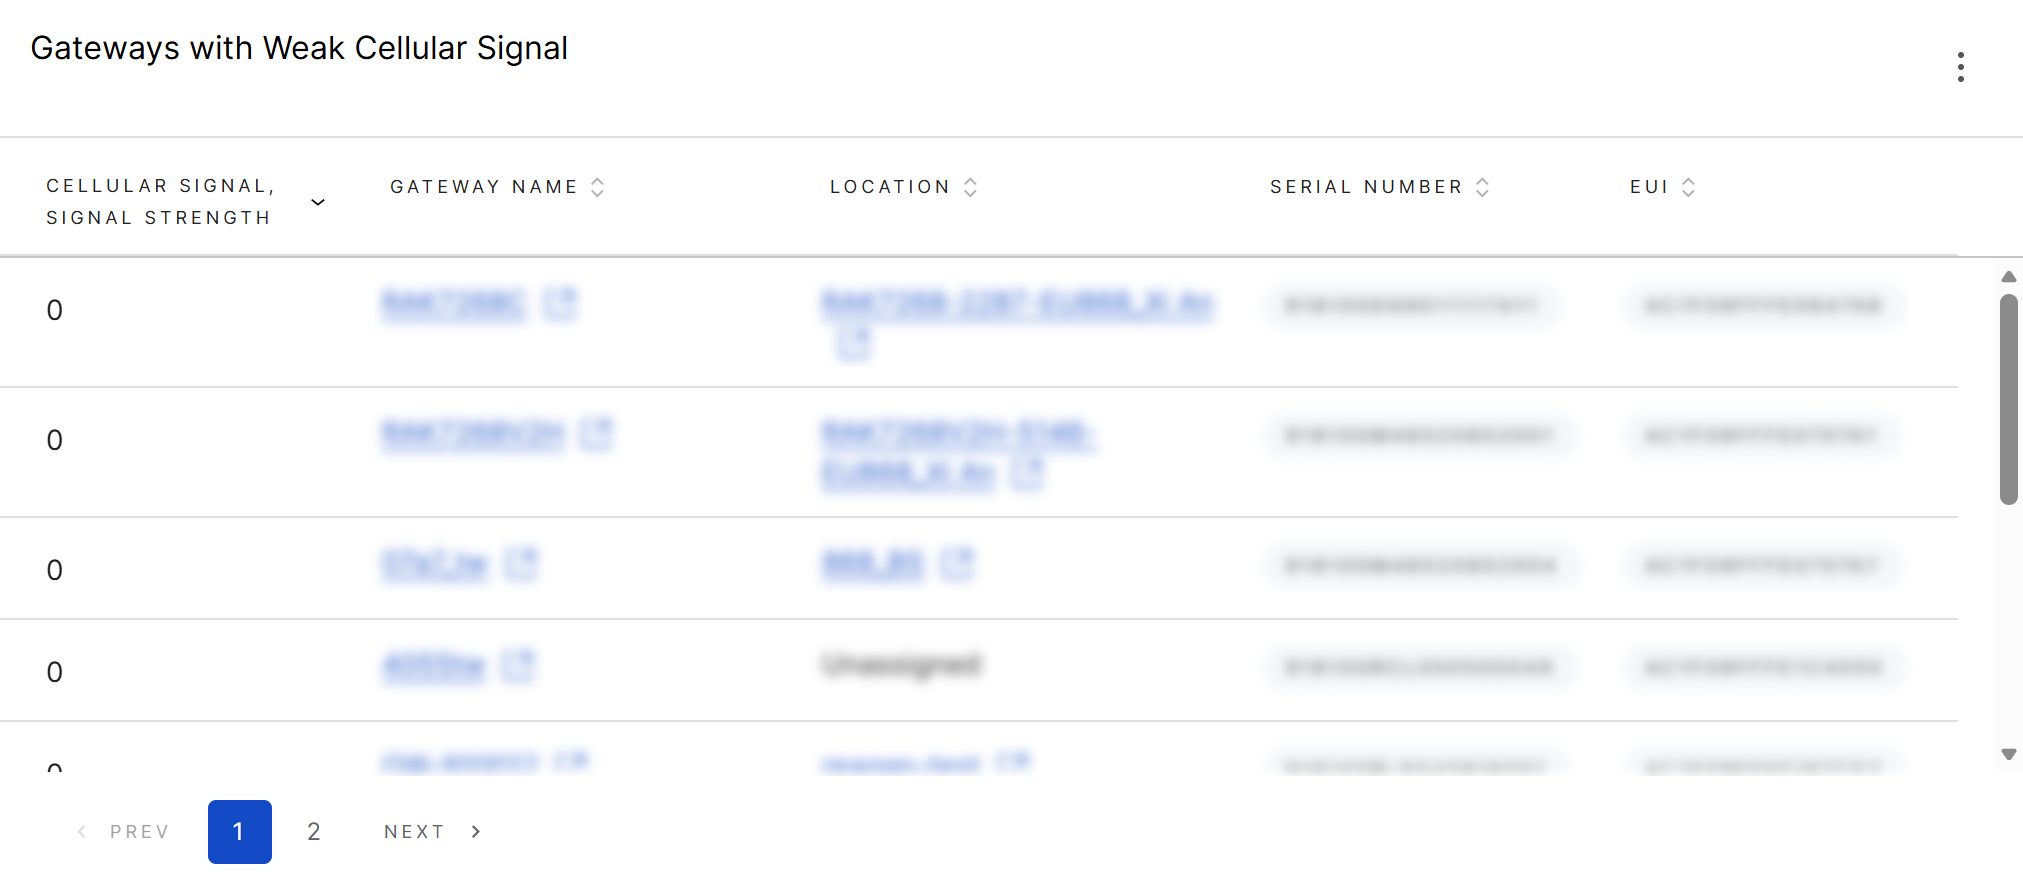 Figure 1: Gateways with Weak Cellular Signal
What it helps you check
This widget helps you find gateways with weak cellular signal. It is useful for checking antenna placement, carrier coverage, installation quality, or whether the selected carrier is suitable for the deployment site.
Recommended follow-up checks
If a gateway has weak cellular signal and also appears in Cellular Link Disconnection Tracker, prioritize checking antenna installation, SIM card status, and carrier coverage at the site.
Interface Reconnection Tracker
Use this widget to identify gateways or interfaces that recently reconnected.
| Configuration Item | Recommended Setting |
|---|---|
| Widget name | Interface Reconnection Tracker |
| Widget type | Table View |
| Metric type | Network Interface |
| Metric | Interface Uptime |
| Operation | MIN |
| Recommended filter | Cellular Uptime, Ethernet Uptime, or WiFi Uptime, if needed |
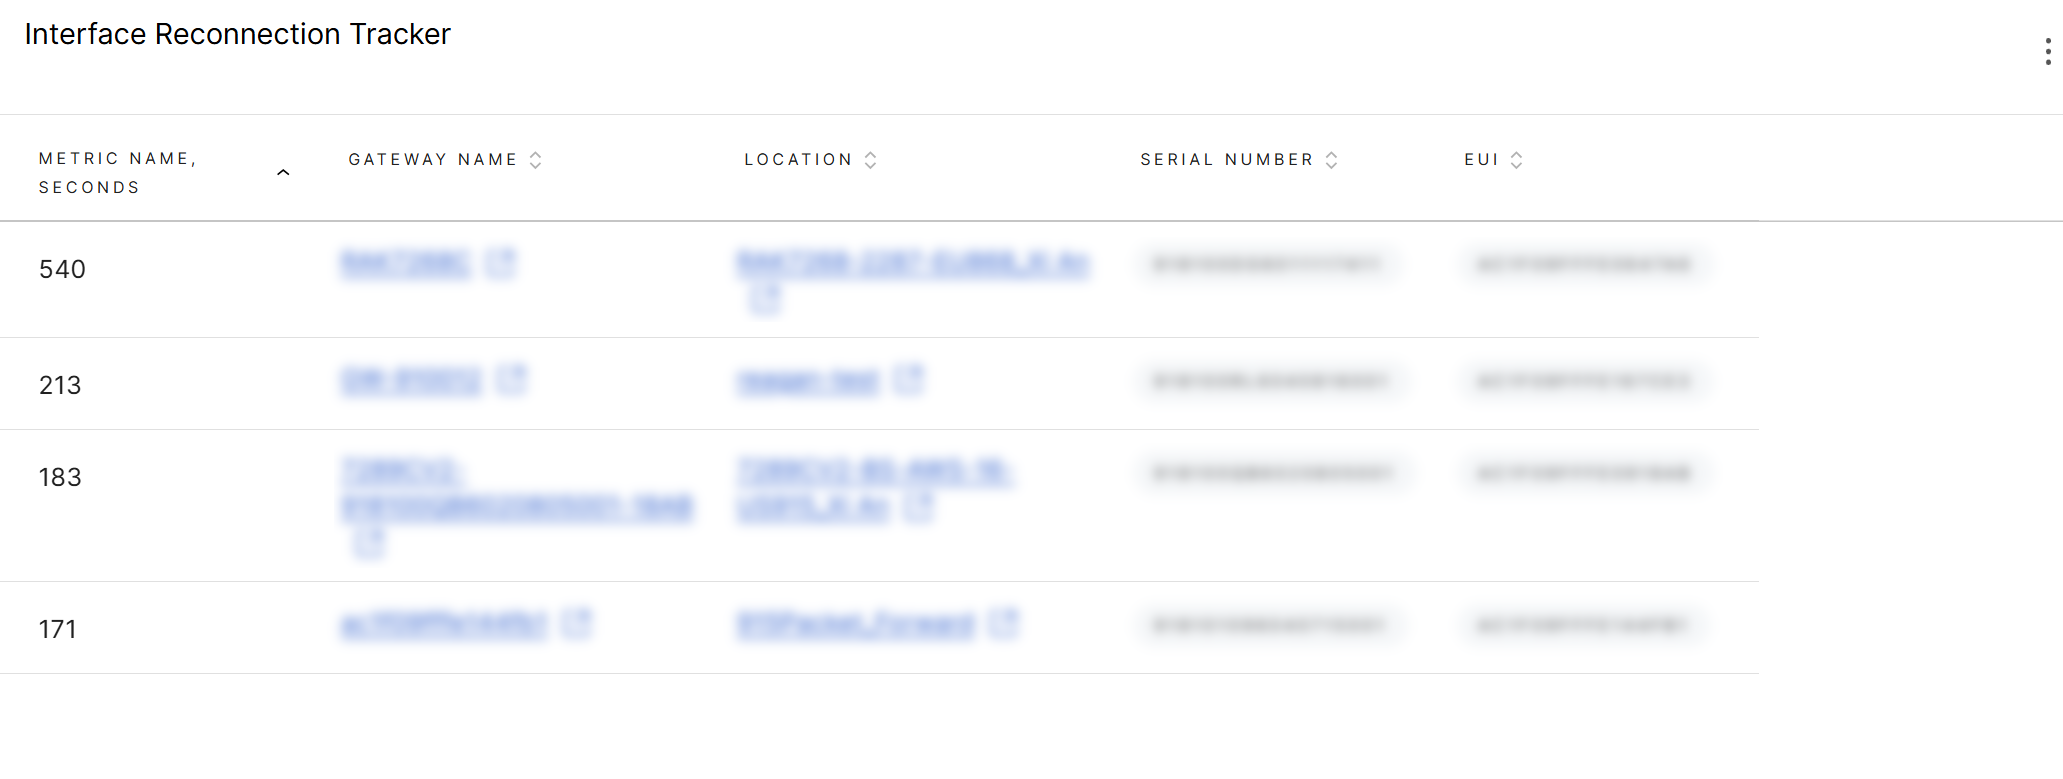 Figure 1: Interface Reconnection Tracker
What it helps you check
This widget helps you find gateways whose network interface had a short connection runtime during the selected time range.
A low value may indicate that the interface recently connected or reconnected.
How to read the result
Use MIN to find the lowest interface uptime reported during the selected time range.
Recommended follow-up checks
- Use the Cellular Uptime, Ethernet Uptime, or WiFi Uptime filter to view each connection.
- Compare with Network Failover to see whether interface reconnection is related to WAN failover.
- Compare with Gateways Using Cellular Interface to see whether the gateway switched to Cellular.
LoRaWAN Packet Forwarding Quality
Use this dashboard when you need to review uplink and downlink packet reporting quality.
This dashboard can be used for Last 24 hours recent issue review or Last 7 days trend review. It helps you check whether uplink CRC errors, downlink reporting errors, or packet reporting abnormalities are increasing.
Uplink and Downlink Packet Volume
Use this widget to review overall LoRaWAN uplink and downlink packet volume during the selected time range.
| Configuration Item | Recommended Setting |
|---|---|
| Widget name | Uplink and Downlink Packet Volume |
| Widget type | Line Chart or Bar Chart |
| Display legend | Enabled |
| Display threshold | Optional |
Metrics to Display
| Metric Name | Metric Type | Metric | Operation | Recommended Filter |
|---|---|---|---|---|
| Total Uplink Packets | LoRaWAN Packet Statistics | Total Uplink Packets | SUM | None |
| Total Downlink Packets | LoRaWAN Packet Statistics | Total Downlink Packets | SUM | None |
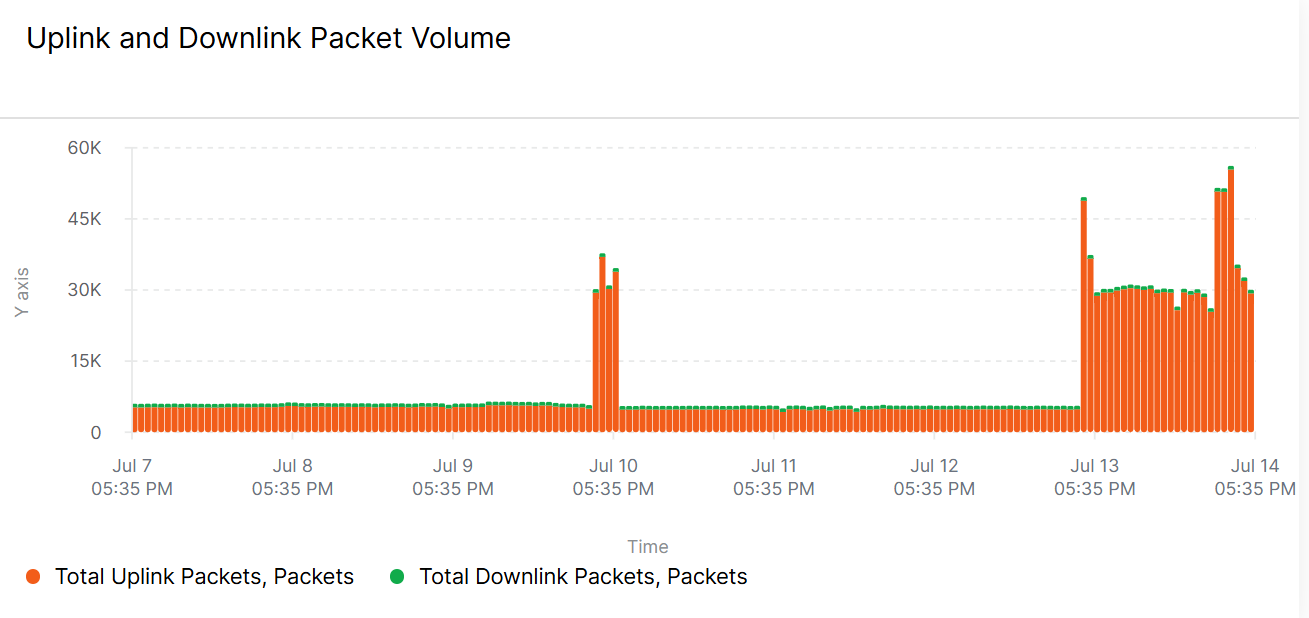 Figure 1: Uplink and Downlink Packet Volume
What it helps you check
This widget helps you understand the overall LoRaWAN traffic volume. Use it as a baseline before reviewing CRC errors or downlink reporting errors.
A sudden drop in total packet volume may indicate gateway offline events, network server issues, device reporting interruption, or site-level connectivity problems.
A sudden increase may indicate heavier device traffic, abnormal retransmission, configuration changes, or test activity.
Uplink Packet Quality
Use this widget to review uplink packet quality during the selected time range.
| Configuration Item | Recommended Setting |
|---|---|
| Widget name | Uplink Packet Quality |
| Widget type | Stacked bar chart |
| Display legend | Enabled |
| Display threshold | Optional |
Metrics to Display
| Metric Name | Metric Type | Metric | Operation | Recommended Filter |
|---|---|---|---|---|
| Uplink CRC OK | LoRaWAN Packet Statistics | Uplink Packets Reporting CRC OK | SUM | None |
| Uplink CRC Error | LoRaWAN Packet Statistics | Uplink Packets Reporting CRC Error | SUM | None |
| Uplink Without CRC | LoRaWAN Packet Statistics | Uplink Packets Without CRC | SUM | None |
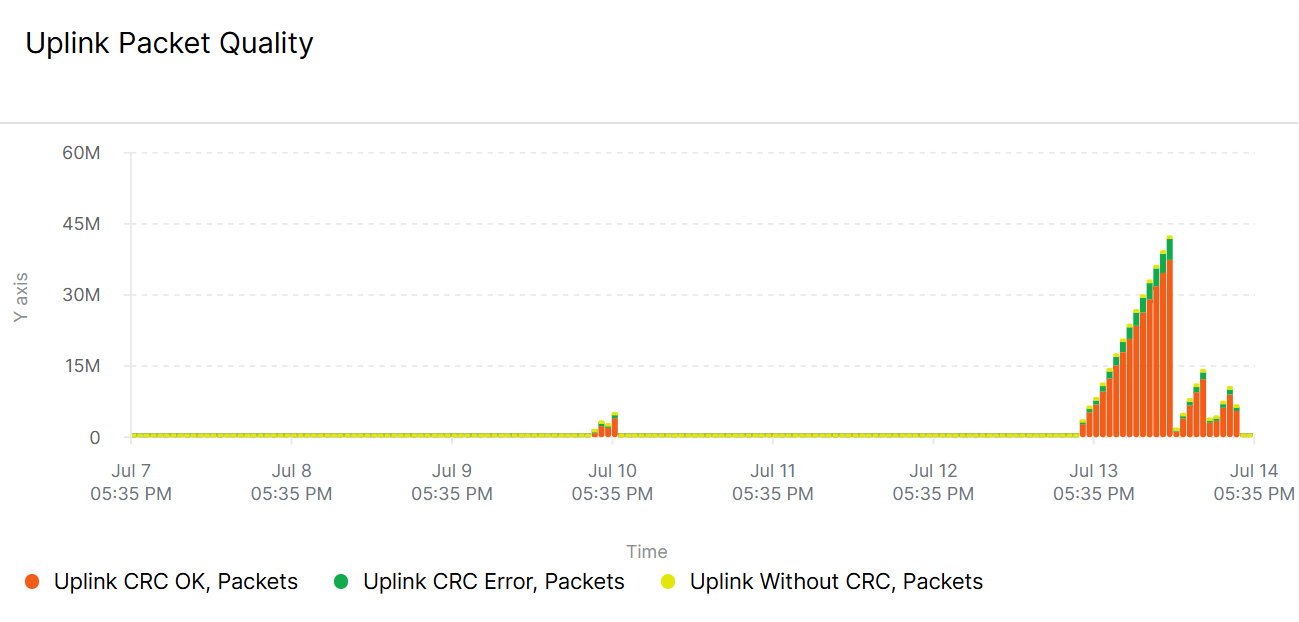 Figure 1: Uplink CRC OK and CRC Error Breakdown
What it helps you check
This widget helps you review uplink packet composition, including valid CRC packets, CRC error packets, and packets without CRC information. A higher CRC error count may indicate RF interference, weak signal, antenna issues, poor gateway placement, or other radio environment problems.
How to act on the result
If CRC errors increase suddenly, compare the result with Total Uplink Packets. Then filter by Location to check whether the issue is concentrated in a specific site. If the issue is site-specific, review antenna installation, gateway placement, RF interference sources, and node deployment conditions.
Top Gateways by Uplink CRC Errors
Use this widget to identify gateways with the highest uplink CRC error count.
| Configuration Item | Recommended Setting |
|---|---|
| Widget name | Top Gateways by Uplink CRC Errors |
| Widget type | Table |
| Metric type | LoRaWAN Packet Statistics |
| Metric | Uplink Packets Reporting CRC Error |
| Operation | SUM |
| Recommended filter | None |
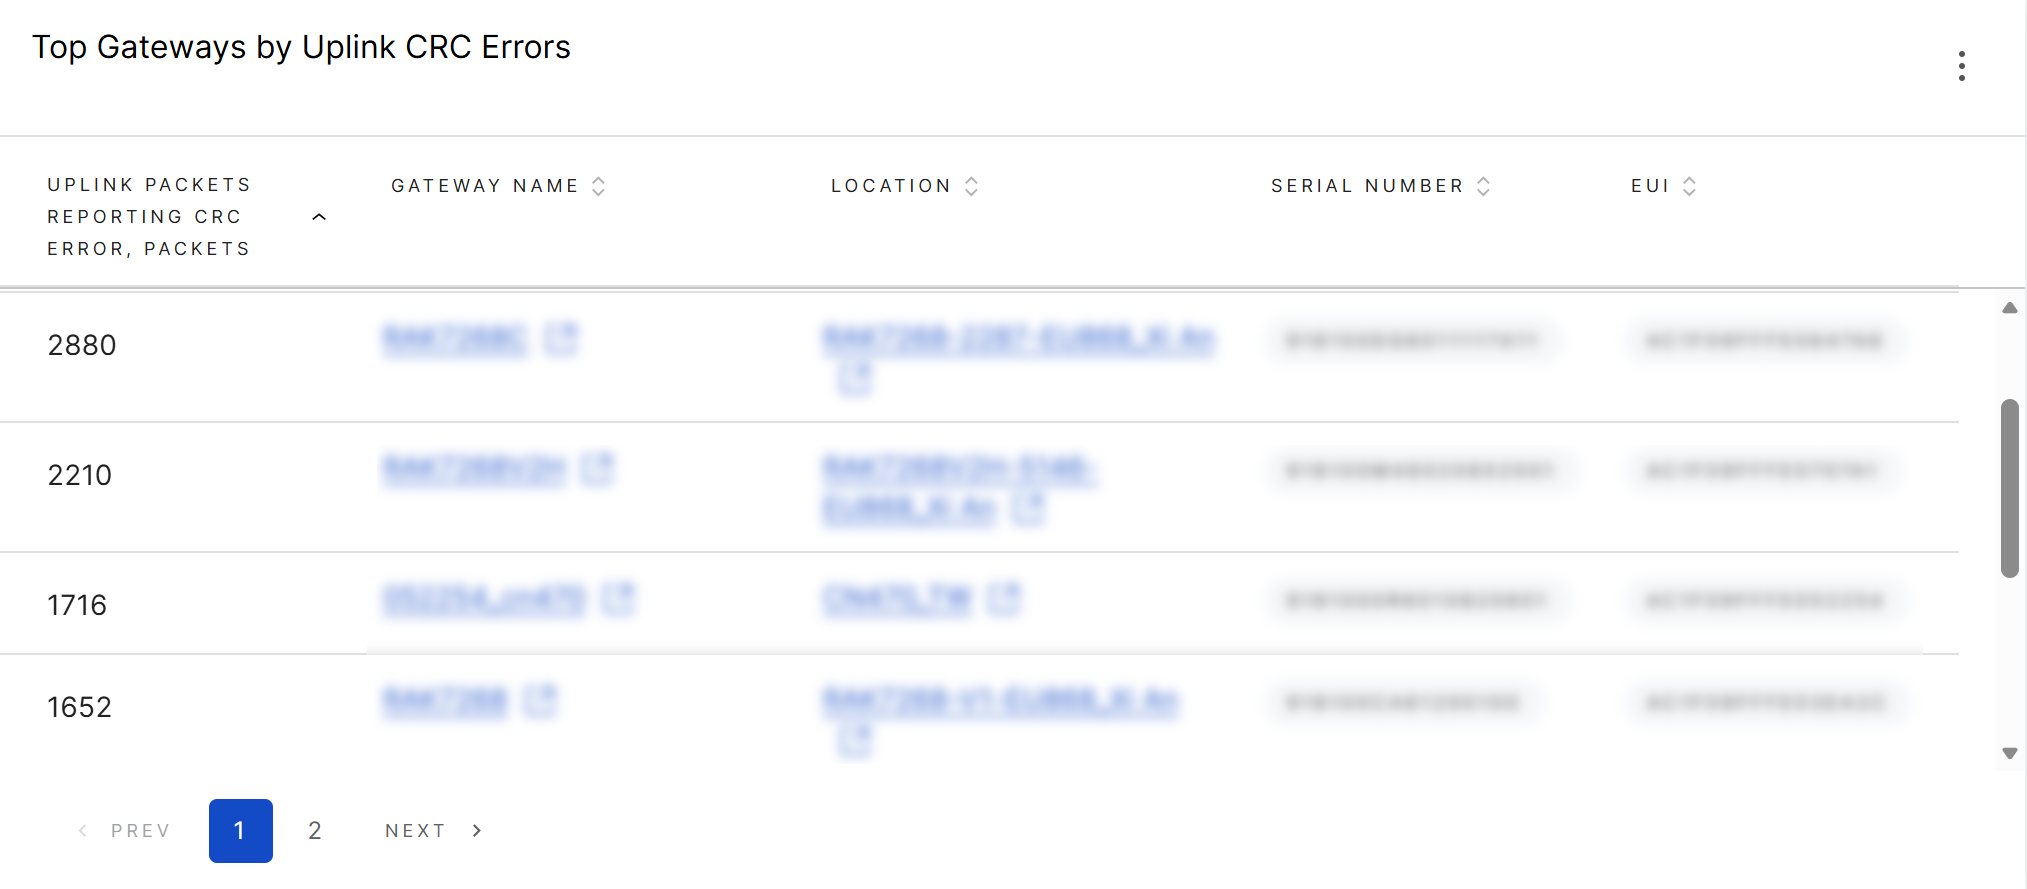 Figure 1: Top Gateways by Uplink CRC Errors
What it helps you check
This widget helps you locate gateways with possible RF or uplink packet quality issues.
Recommended follow-up checks
- Check whether the affected gateways are in the same Location.
- Check antenna connection, antenna type, cable quality, and installation environment.
- Compare CRC errors before and after gateway relocation or antenna adjustment.
- Review whether nearby RF interference sources may affect packet reception.
Downlink Packet Quality
Use this widget to review downlink packet reporting quality.
| Configuration Item | Recommended Setting |
|---|---|
| Widget name | Downlink Packet Quality |
| Widget type | Stacked bar chart |
| Display legend | Enabled |
| Display threshold | Optional |
Metrics to Display
| Metric Name | Metric Type | Metric | Operation | Recommended Filter |
|---|---|---|---|---|
| Downlink Reporting Success | LoRaWAN Packet Statistics | Downlink Packets Reporting Success | SUM | None |
| Downlink Reporting Error | LoRaWAN Packet Statistics | Downlink Packets Reporting Error | SUM | None |
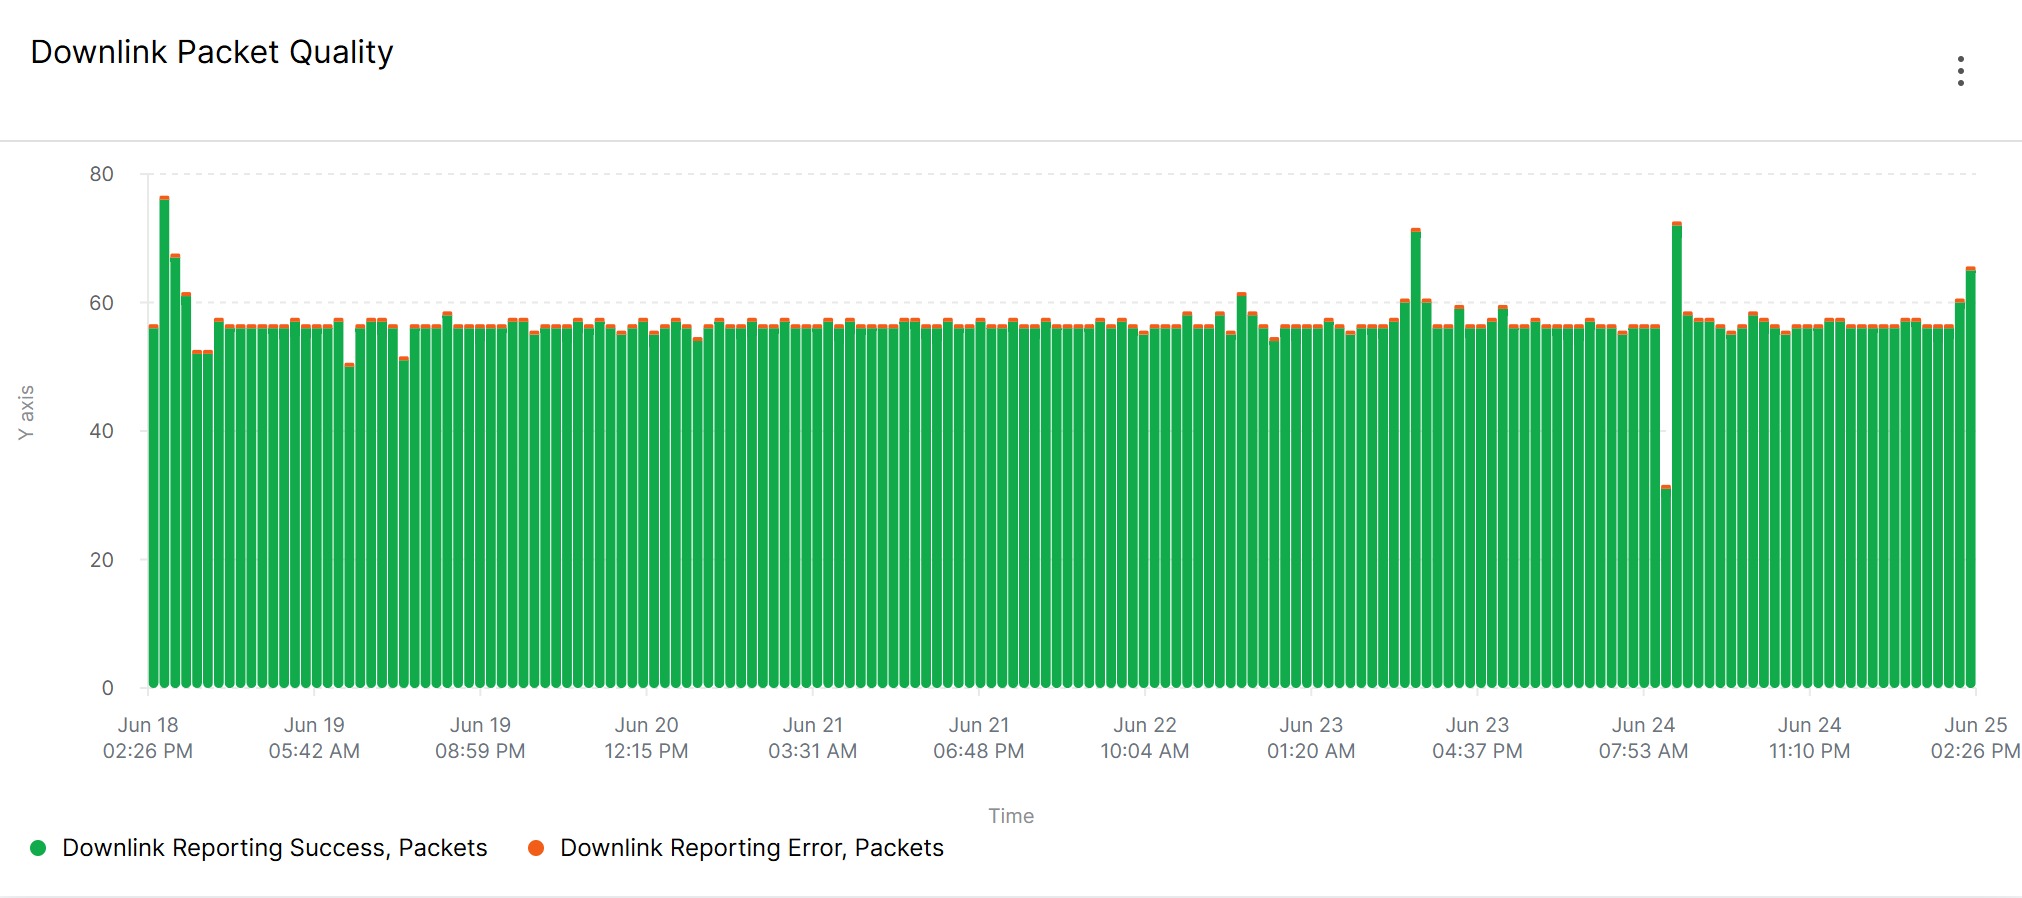 Figure 1: Downlink Success and Error Breakdown
What it helps you check
This widget helps you check whether downlink packet reporting is healthy. Increasing error counts may indicate gateway connectivity, network server, or downlink reporting issues.
Top Gateways by Downlink Reporting Errors
Use this widget to identify gateways with the highest downlink reporting error count.
| Configuration Item | Recommended Setting |
|---|---|
| Widget name | Top Gateways by Downlink Reporting Errors |
| Widget type | Table |
| Metric type | LoRaWAN Packet Statistics |
| Metric | Downlink Packets Reporting Error |
| Operation | SUM |
| Recommended filter | None |
What it helps you check
This widget helps you find gateways with possible downlink reporting issues. Use it with WAN connectivity, gateway status, GPS status, and network server status for deeper troubleshooting.
Recommended follow-up checks
- Check whether the affected gateways also have WAN instability.
- Check whether the gateways rebooted during the selected period.
- Check whether downlink errors are concentrated in a specific Location or firmware version.
- If GPS timing is required in your deployment, compare the result with GPS status metrics.
Field Readiness and Maintenance Checks
Use this dashboard during installation, acceptance testing, or routine field maintenance.
This dashboard is intended for Last 24 hours review. It helps you check whether gateways are ready for stable field operation, especially for outdoor deployments, GPS-dependent deployments, cellular deployments, or projects that rely on SD card storage.
Current GPS Status
Use this widget to check the latest GPS status of each gateway.
| Configuration Item | Recommended Setting |
|---|---|
| Widget name | Current GPS Status |
| Widget type | Table View |
| Metric type | GPS and Location |
| Metric | GPS Status |
| Operation | LAST VALUE |
| Recommended filter | None |
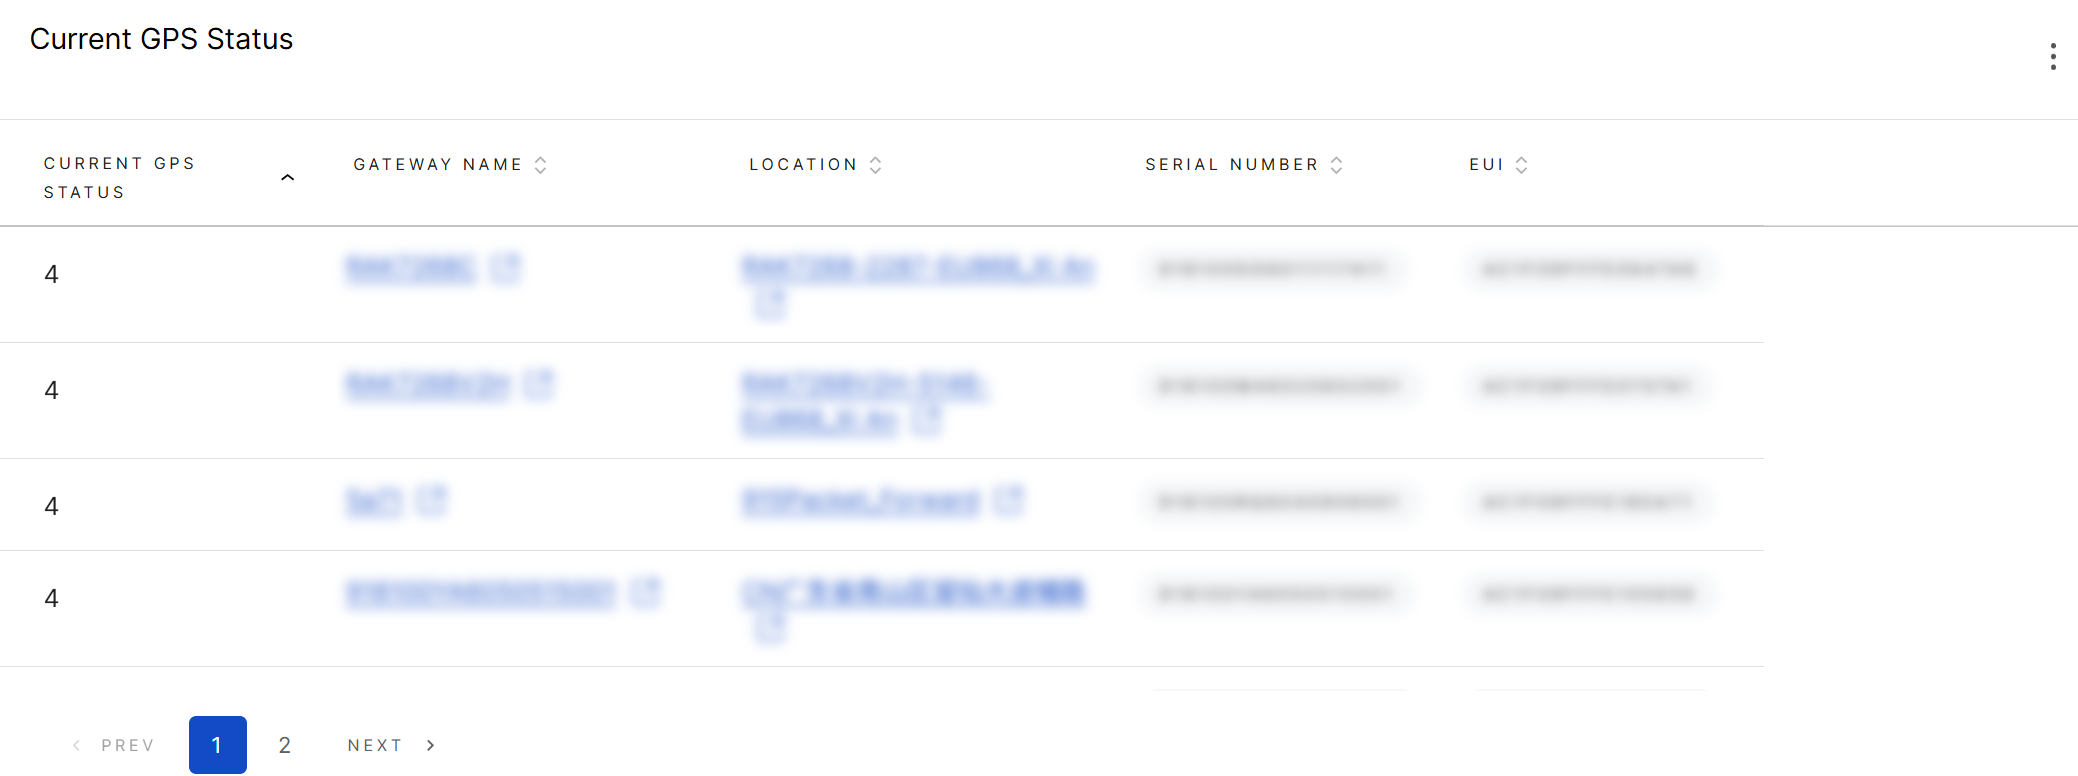 Figure 1: Current GPS Status
How to read the table
| LAST VALUE | GPS State | Meaning |
|---|---|---|
| 0 | No GPS module or GPS disabled | No GPS module is detected, or GPS is disabled. If GPS is required for this gateway, this needs to be checked. |
| 1 | GPS locked with PPS output | GPS is locked and PPS output is available. This is the preferred normal state for GPS-dependent deployments. |
| 2 | GPS locked without PPS output | GPS positioning is available, but PPS output is not available. |
| 3 | GPS not locked | GPS is enabled but has not locked. |
| 4 | No GPS output detected | No GPS output is detected from the GPS module. |
What it helps you check
This widget helps you identify gateways that are currently or recently not in the preferred GPS state.
Use it during installation, acceptance testing, or maintenance when GPS lock or PPS timing is required.
The preferred GPS state depends on the deployment requirement.
For GPS-dependent or timing-sensitive deployments, GPS locked with PPS output is the preferred state.
For gateways that do not require GPS, No GPS module or GPS disabled may not require action.
GPS Satellite Reception
Use this widget together with GPS Status to check whether GPS issues may be related to weak satellite reception.
| Configuration Item | Recommended Setting |
|---|---|
| Widget name | GPS Satellite Reception |
| Widget type | Table View |
| Metric type | GPS and Location |
| Metric | Observed GPS Satellites |
| Operation | MIN |
| Recommended filter | None |
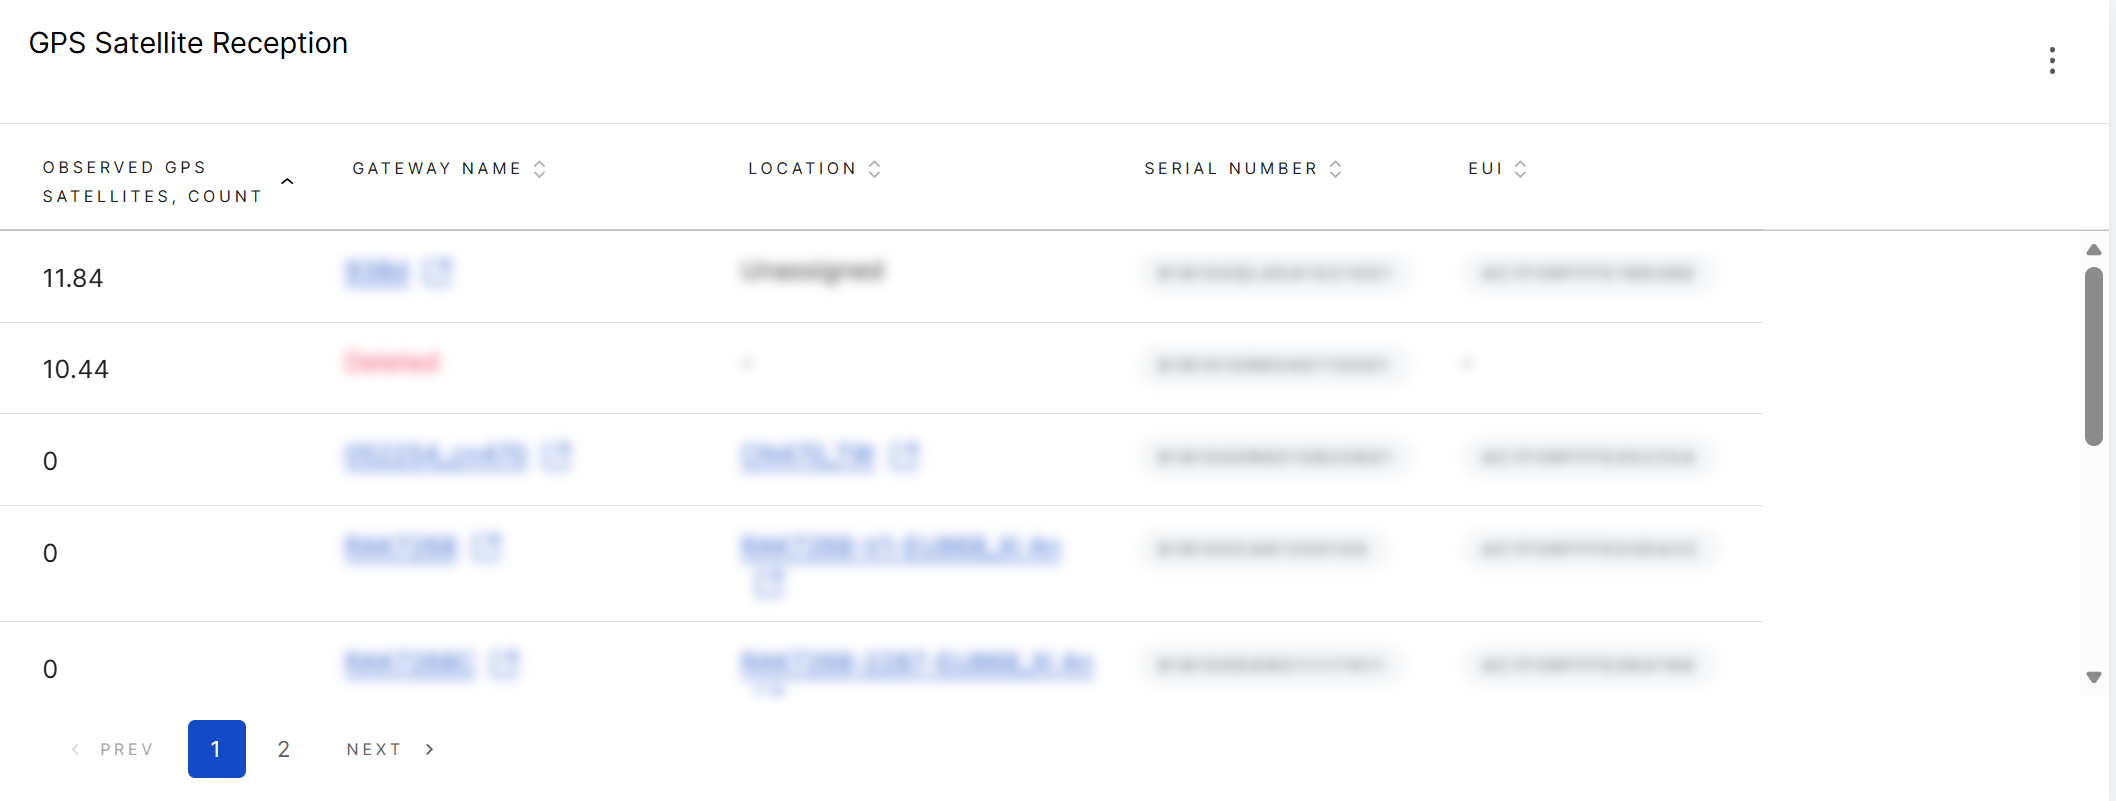 Figure 1: GPS Satellite Reception
How to read the table
| MIN Satellites | Meaning | Action |
|---|---|---|
| ≥ 6 | Strong satellite reception during the selected period | Normal |
| 4–5 | Marginal satellite reception | Monitor. GPS may lose lock in poor conditions. |
| 1–3 | Weak satellite reception | Check antenna placement and open-sky visibility. |
| 0 | No satellites were detected at some point | Check whether the GPS antenna is disconnected, blocked, or whether the gateway has no GPS module. |
What it helps you check
This widget helps you find gateways that had weak or no satellite reception during the selected time range.
Use this widget together with GPS Status. For example, if a gateway reports GPS not locked and also has low observed satellite count, the issue may be caused by antenna placement, obstruction, or poor sky visibility.
Use MIN when you want to find gateways that had weak satellite reception at any point during the selected time range.
Use LAST VALUE when you want to check the latest satellite count.
Use AVG when you want to review the general satellite reception level over a longer period.
How to Diagnose GPS Signal Quality
Use the following two-step method to diagnose GPS issues.
Step 1: Check GPS Status Overview
| GPS Status MAX Value | Initial Interpretation | Next Step |
|---|---|---|
| 0 | No GPS module or GPS is not available. | No action is needed if GPS is not required for this gateway. |
| 1 | GPS stayed normal during the selected period. | No action needed. |
| >= 2 | The gateway experienced a GPS-related issue. | Continue with GPS Satellite Reception. |
Step 2: Check GPS Satellite Reception
| Combined Result | Possible Cause | Recommended Action |
|---|---|---|
GPS Status MAX = 2 and MIN Satellites >= 4 | GPS positioning is available, but PPS timing may be unavailable. | Check whether PPS is required. If yes, inspect GPS module, hardware status, and logs. |
GPS Status MAX = 3 and MIN Satellites = 1-3 | Satellite reception is weak or the antenna is partially obstructed. | Adjust antenna placement and ensure open-sky visibility. |
GPS Status MAX = 3 and MIN Satellites = 0 | The GPS antenna may be disconnected or fully obstructed. | Check antenna connection and installation position. |
GPS Status MAX = 4 and MIN Satellites = 0 | The GPS module may not output NMEA data, or there may be a hardware/module issue. | Check GPS module status, hardware connection, and system logs. |
SD Card Issue Tracker
Use this widget to identify gateways that reported SD card issues during the selected time range.
| Configuration Item | Recommended Setting |
|---|---|
| Widget name | SD Card Issue Tracker |
| Widget type | Table View |
| Metric type | Storage |
| Metric | SD Card Status |
| Operation | MAX |
| Recommended filter | None |
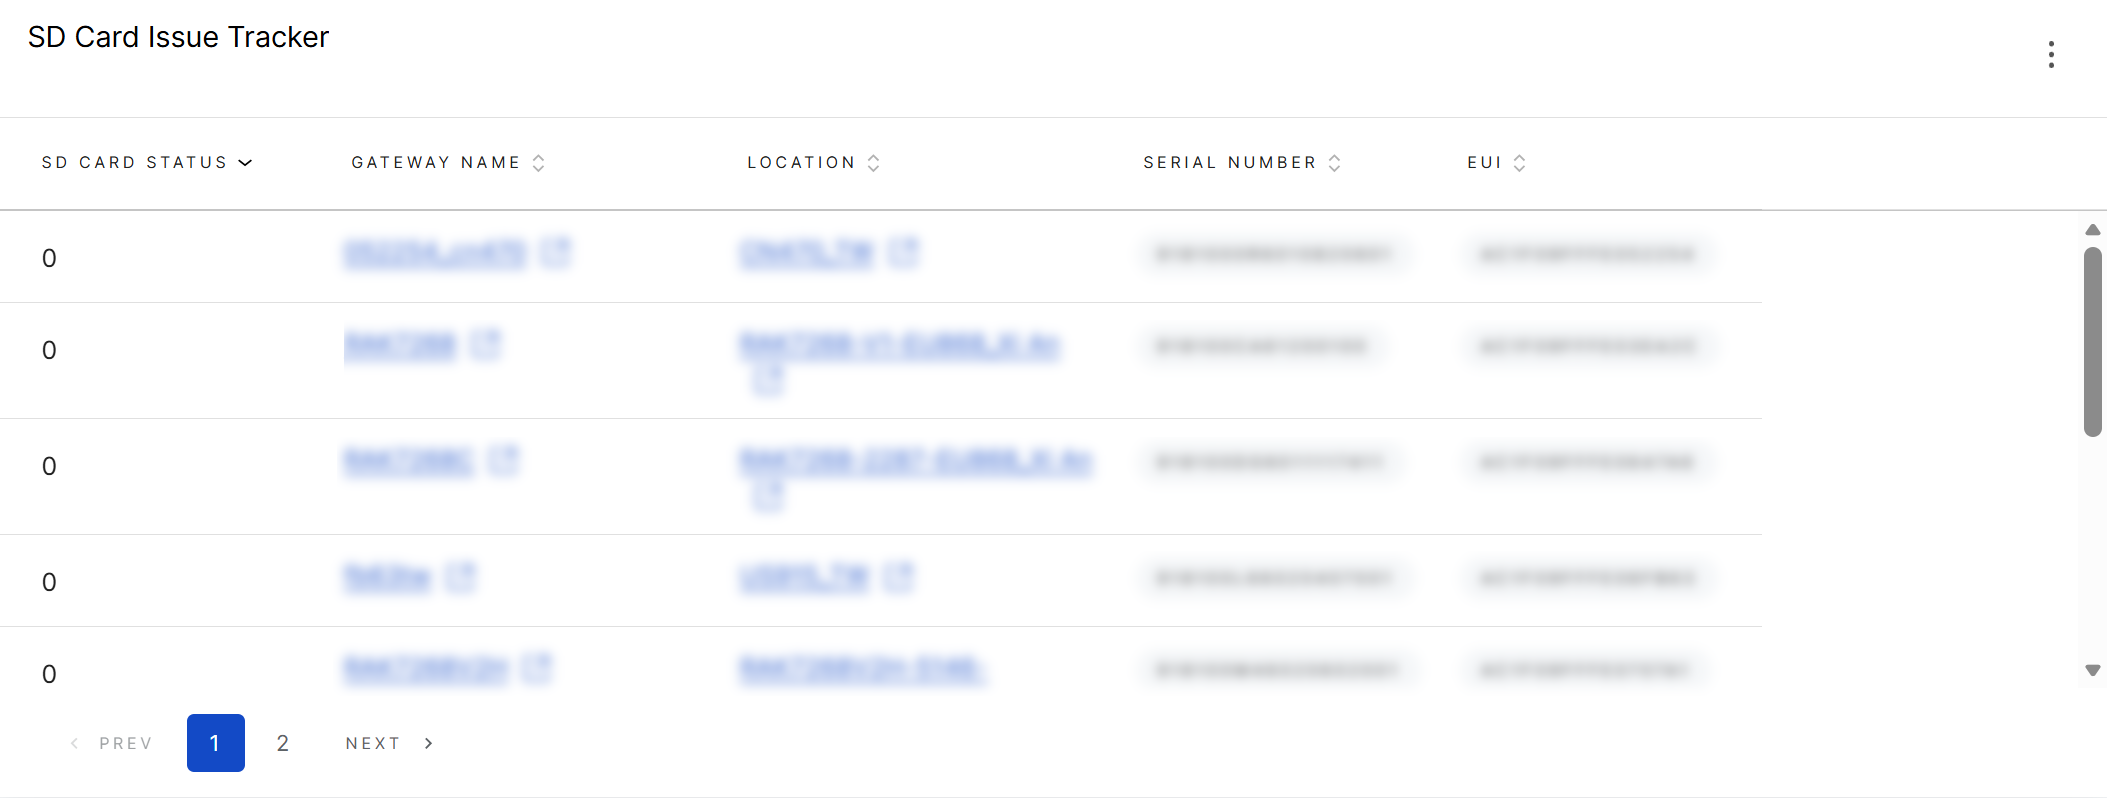 Figure 1: SD Card Issue Tracker
How to read the table
| MAX Value | Meaning | Action |
|---|---|---|
| 0 | SD card stayed normal during the selected period | No action needed. |
| 1 | SD card was not detected at some point | Check whether the SD card is inserted and seated properly. |
| 2 | SD card was reported as abnormal at some point | Check logs and consider replacing the SD card. |
What it helps you check
This widget helps you find gateways that had SD card detection or health issues during the selected time range.
Typical use cases
- Quickly locate gateways with SD card issues.
- Confirm that gateways report
MAX = 0after installation. - Identify gateways that may need SD card inspection or replacement.
MAX = 1 or MAX = 2 means the SD card had an issue at some point during the selected period.
The issue may have already recovered. To check the latest SD card condition, use LAST VALUE + Table View or narrow the time range to the most recent period.
Gateways with Low Available Storage
Use this widget to identify gateways with low remaining SD card storage.
| Configuration Item | Recommended Setting |
|---|---|
| Widget name | Gateways with Low Available Storage |
| Widget type | Table View |
| Metric type | CPU and Memory Utilization |
| Metric | Available Storage % |
| Operation | LAST VALUE |
| Recommended filter | Available Storage % < 20 |
What it helps you check
This widget helps you find gateways that are currently or recently reporting low available SD card storage.
Low available storage may affect log storage, cached data, local files, or maintenance operations.
How to read the result
A lower value means less remaining SD card storage.
For example:
| Available Storage % | Meaning |
|---|---|
| > 50% | Sufficient remaining storage in most cases. |
| 20–50% | Storage should be monitored. |
| < 20% | Low storage. Cleanup or maintenance may be required. |
Recommended follow-up checks
- Check whether logs, cached data, or local files are consuming storage.
- Review whether the issue appears on multiple gateways in the same Location.
- Check SD Card Status to confirm whether the SD card itself is normal.
Use LAST VALUE when you want to check the latest available storage status.
Use MIN when you want to find gateways whose available storage dropped below the threshold at any point during the selected time range.


