WisGate OS User Manual
Overview
This document describes the functionality of the WisGateOS in detail. The interface builds on top of OpenWRT and all gateway products of the RAK72xx line share it. It gives instructions on configuring WAN, the LoRa Packet Forwarder, and MQTT Bridge. It explains how to do system monitoring, update the firmware, and reset the device. Last but not least, it provides information on using the Built-in LoRa Server. This guide functions as a reference for several products with similar functionality. Thus, some sections will apply to certain products and not others.
Gateway Start-Up
Make sure all the antennas are connected before powering the Gateway.
For RAK7258 and RAK7268, use the included adapter. RAK7249 and RAK7289 come with a PoE injector, which you need to connect to the grid on one side and to the gateway on the other (Ethernet cable not included).
The gateway comes configured in such a way that you can use either the Ethernet port or the Wi-Fi in AP mode to connect to the Management platform.
In both modes, you can access the Management UI via a web browser pointing to the IP address of the gateway (check your router DHCP list). Alternately, the IP Address (192.168.230.1) is preconfigured as the one to use to access the device provided you are directly connected to it.
Wi-Fi AP Mode
By default, the gateway is configured to work in Access Point (AP) mode. It has the following parameters:
- Wi-Fi: SSID: RAK72XX_xxxx (no password is required to connect via Wi-Fi)
- Web UI: Connect via a browser to the IP address assigned to the gateway which is
192.168.230.1by default. You should see the login window, as shown in Figure 1. Use the credentials below:- UI user: root
- UI password: root
WAN port (DHCP IP) mode
Connect the Ethernet cable to the port marked ETH and the other end to your router. Use the same credentials for the Web UI as for AP mode.
 Figure 1: Login Page
Web Management Platform
After you have entered the correct credentials, you can start exploring the configuration and monitoring interface of the gateway.
Status
This is where statistics about the Gateway behavior can be monitored in real time.
Overview
The page consists of several areas where you can see the overview of some metrics and basic information about the gateway upon logging in the browser displays the page shown in Figure 2.
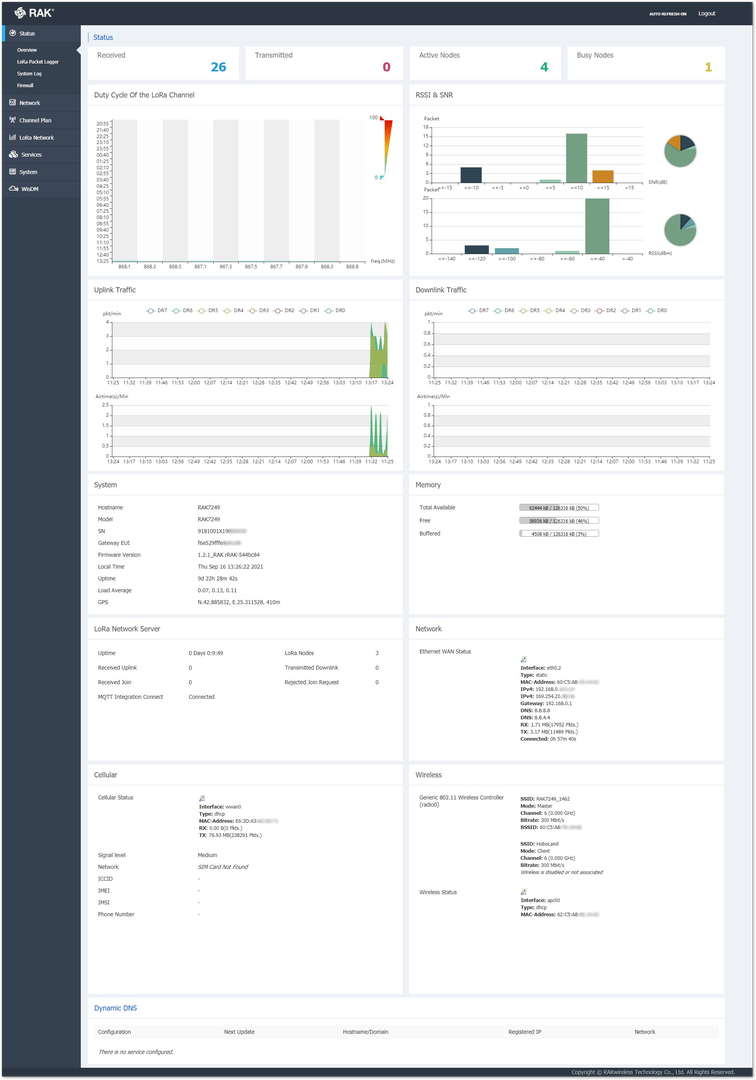 Figure 1: Overview Page
- Received: Shows the total number of uplink LoRa messages received by the gateway. Here are displayed not only messages from devices connected to the gateway directly but from any device that is within the coverage of the gateway and transmitting LoRa messages.
- Transmitted: Shows the total number of downlink LoRa messages sent by the gateway.
- Active Nodes: Shows the number of active LoRa nodes within the LoRaWAN gateway's coverage. Those that have sent no data for more than 10 min are discarded from the count.
- Busy Nodes: Shows the number of busy nodes within the LoRaWAN gateway's coverage (Nodes with an average message spacing of less than 100s.).
- Duty Cycle of the LoRa Channel: The graph represents the Duty Cycle load by frequency channel (Data is kept for the last 12 hours). The minimum resolution along the time axis is 100s. Each value is an average of over 100s. The values are color code – green to red, low to high.
- RSSI & SNR: These graphs show how many of the total amount packets have an RSSI/SNR value within a certain range. This is also shown in a pie chart to the side of the graphs.
- Uplink Traffic: The field shows the packet per minute rate as a function of time and airtime(s) per minute as a function of time. Above the graphs, you can see the color-coding of the different Spreading Factors, where the actual height of the values is a sum of all the packets overall spreading factors for the time sample.
- Downlink Traffic: Shows the packet per minute rate as a function of time and airtime(s) per minute as a function of time. Above the graphs, you can see the color-coding of the different Spreading Factors, where the actual height of the values is a sum of all the packets overall spreading factors for the time sample.
- System: Shows some basic information about the gateway such as hostname, model, serial number, firmware version, local time, uptime of the gateway, load average, and GPS location.
- Memory: There are bars in this section that show how much is the Total Memory Available, Free and Buffered Memory is.
- LoRa Network Server: You can see the statistics for your network server. The number of associated LoRa Nodes, Uplink, Downlink, Received Join, and Rejected Join, those types of packets all have a numerical value associated with them. Additionally, you can check the Uptime and whether you have the MQTT Integration running.
- Network: Shows parameters and status for IPv4 network interface that is active in the gateway. Some of the parameters are Type, Interface IP, Netmask, Gateway, DNS1, DNS2, etc.
- Cellular: This shows the connection status of the gateway’s cellular together with the corresponding Network ID and the parameters of the Sim card (ICCID, IMSI, Phone number). (optional)
- Wireless: Shows parameters and status for the Wi-Fi. Some of the parameters are connectivity status, signal strength, and IP addressing parameters for both AP and Client interfaces.
- Dynamic DNS: The field shows the Dynamic DNS configuration if configured, otherwise, there will be a message saying There is no service configured.
LoRaWAN Packet Logger
This is where a log of the LoRa messages is shown in real-time. There are several options for filtering as well as the possibility to download the statistics in a file. There is also a message summary: Total, Uplink, and Downlink.
By selecting a particular packet (by a single click on the packet), you get an extended window with the detailed metadata for the packet as well as some RF parameters. In addition, there is a graph area below the packets list, where is shown the Air Time for each of the nodes that have packets detected by the packet logger and also the load per frequency channel.
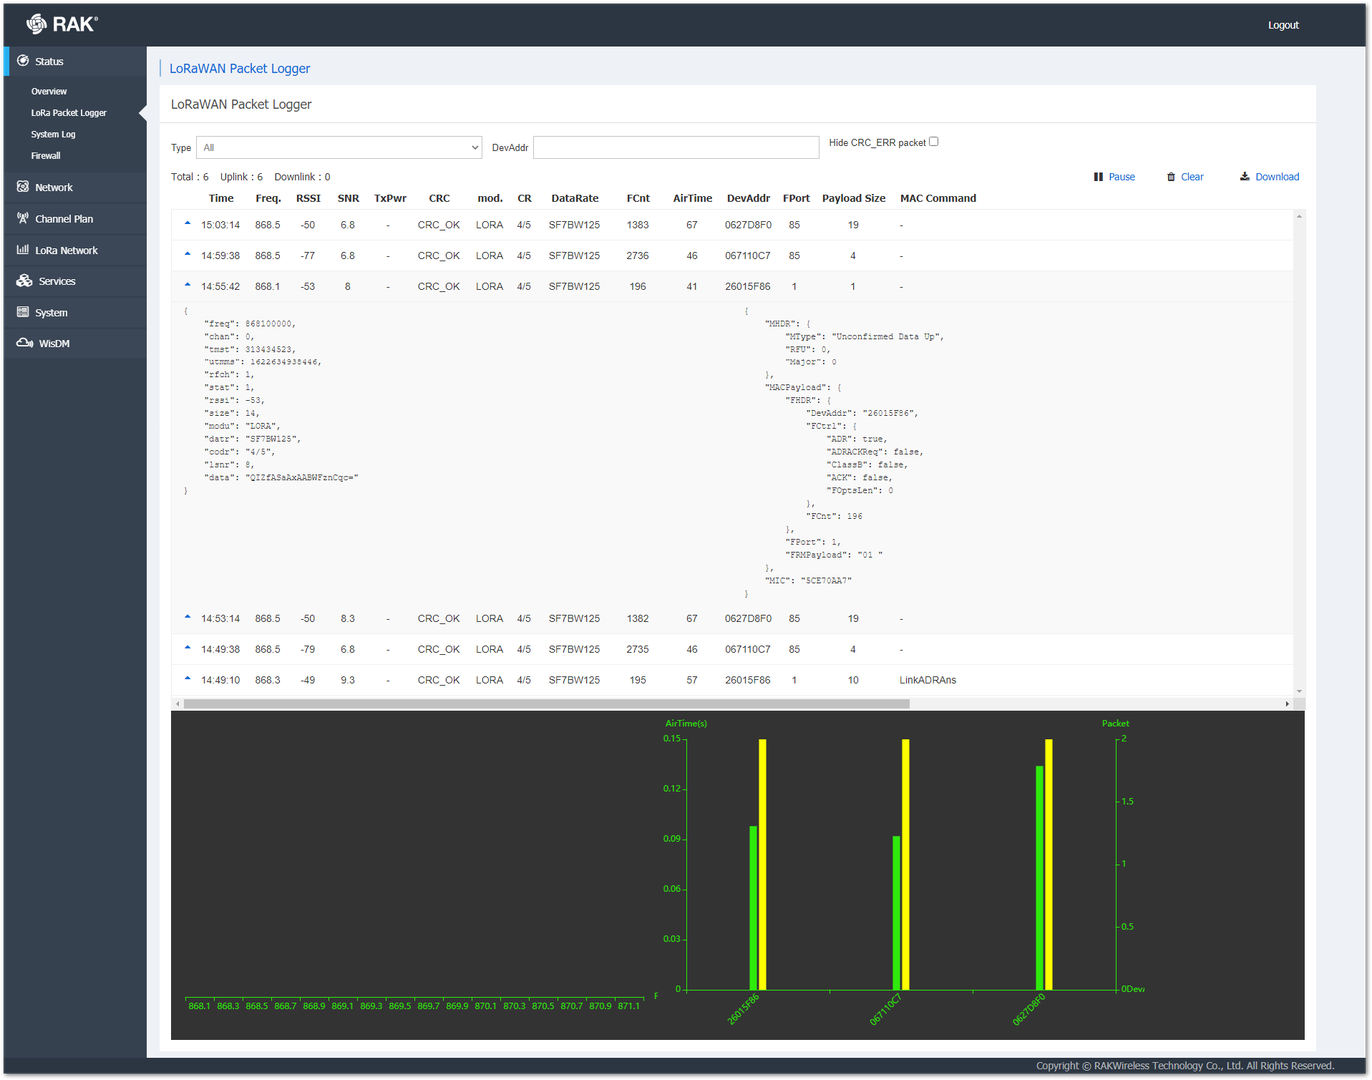 Figure 1: LoRaWAN Packet Logger Page
Filter the packets by choosing any of the following:
- Type: Filter the packets by type. By default, all the types of packets are shown. When a certain type is selected, the logger will show only this type of packet and the others will be ignored. The possible options are the following:
- Join Request
- Join Accept
- Unconfirmed Data Up
- Unconfirmed Data Down
- Confirmed Data Up
- Confirmed Data Down
- DevAddr: Filter the packets by the node address. Only packets from the selected node will show in the logger and the others will be ignored.
- Hide CRC_ERR packet: When it is selected, no CRC check error message will be displayed.
System Log
On this page, you can see the complete system logs. It is useful mainly for debugging purposes. The System Log reports both system information and actual data from LoRa frames coming from the end nodes.
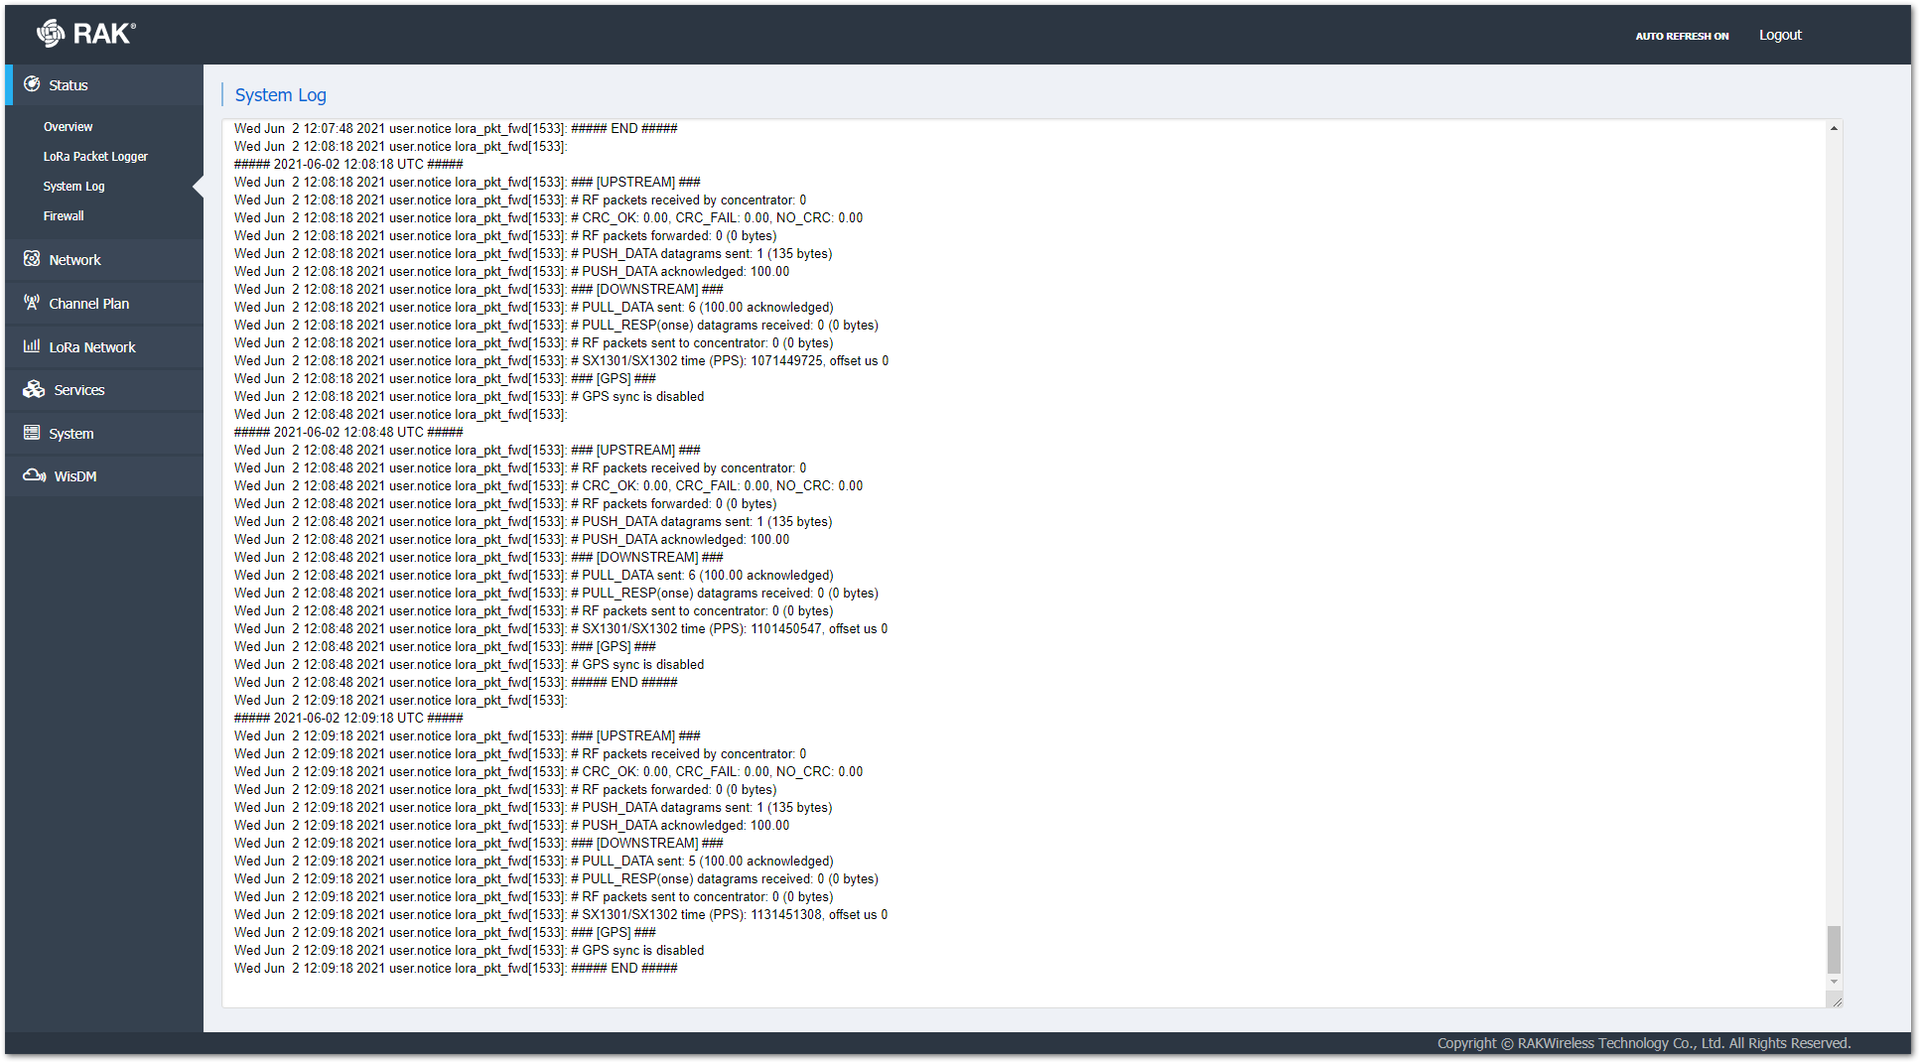 Figure 1: System Log Page
On the top right corner, you can find the button there:
- AUTO REFRESH ON/OFF: Depending on the state (ON or OFF), the auto-refresh will be on or off.
Firewall
This section shows only information about traffic on different ports, addresses, etc. It is organized in tables; however, there are no configuration options here, and this is only for observation. There is a dedicated sub-section for the Firewall Settings in the Network section, where you can actually configure rather than only observe. The only actions you can perform here are to Reset Counters or Restart Firewall via the links on the top left.
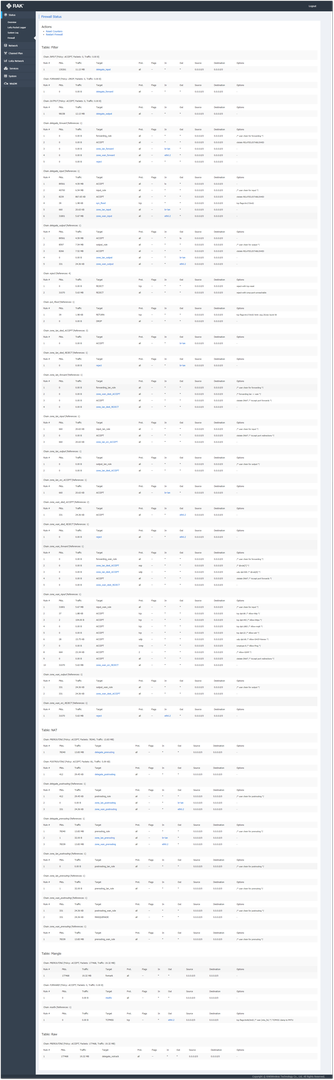 Figure 1: Firewall Page
Network
Ethernet Port
This page allows you to set up the Ethernet Port Type. The options are WAN and LAN, and they can be selected via the dropdown menu.
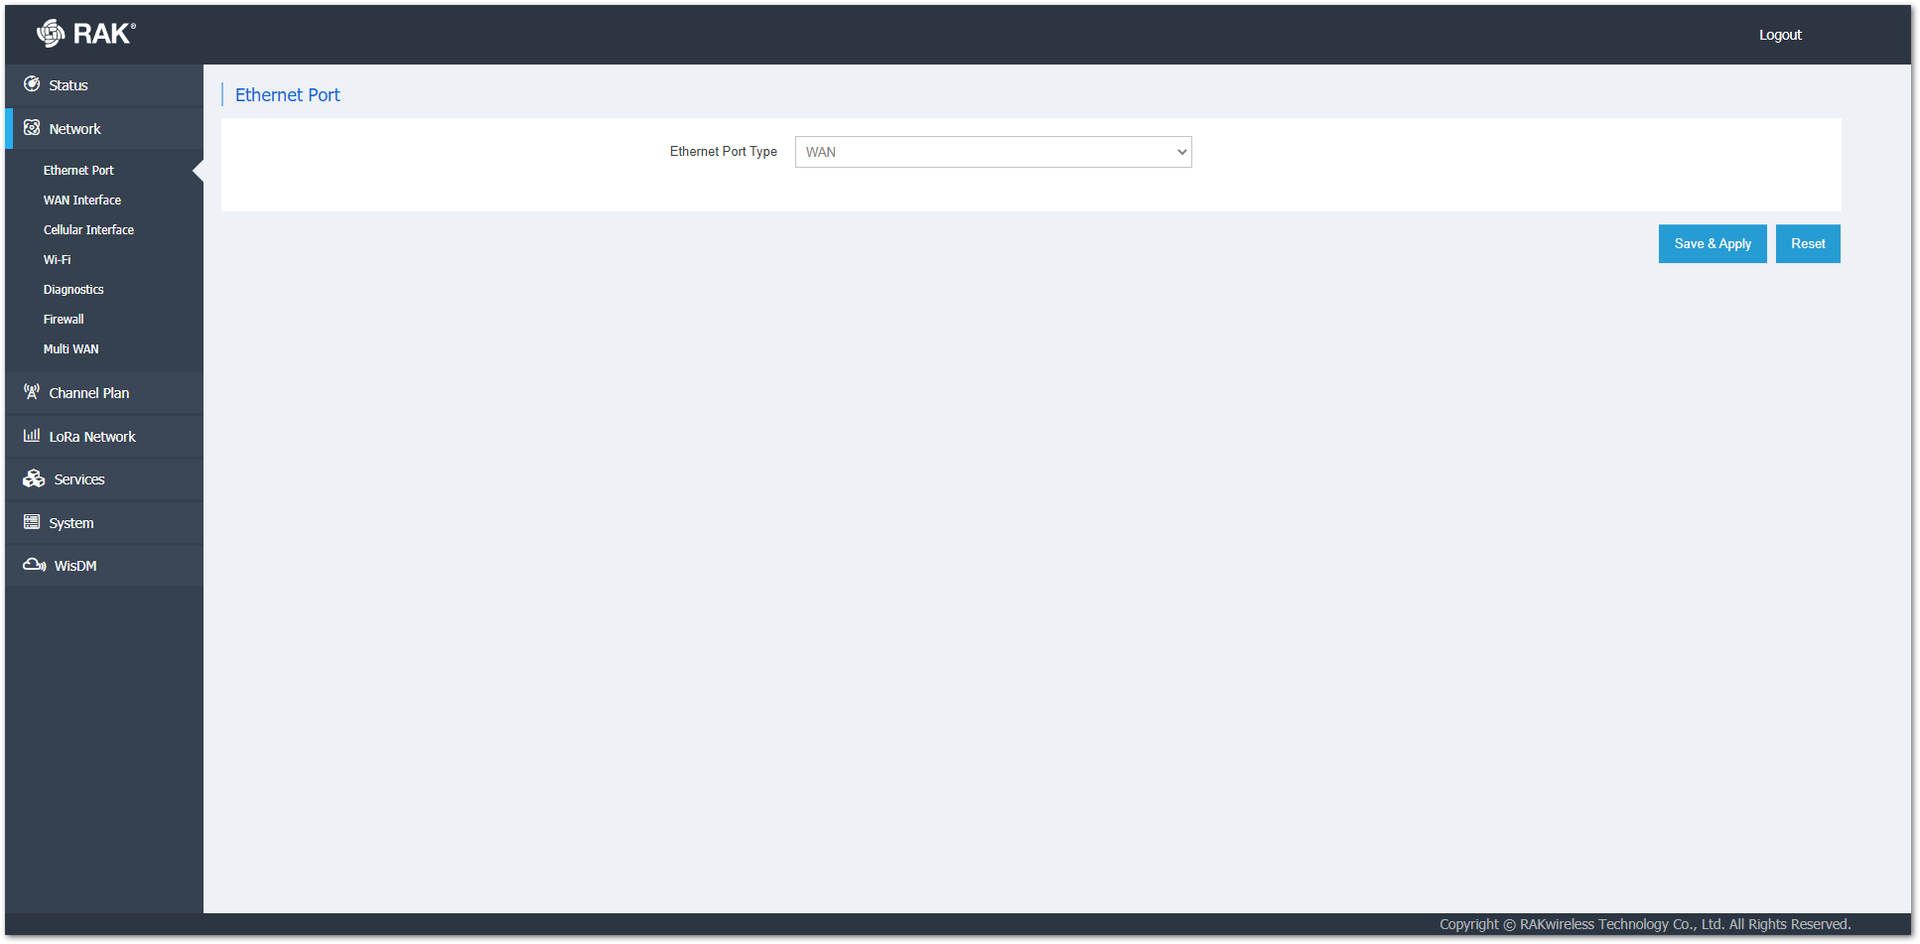 Figure 1: Ethernet Port Page
WAN Interface
The first element of this page is the Status field where you (the user) can check statistics about the gateway, such as the Uptime, MAC-Address, TX, RX, and IPv4 Address. You can also configure the protocol to be used for connecting to the network.
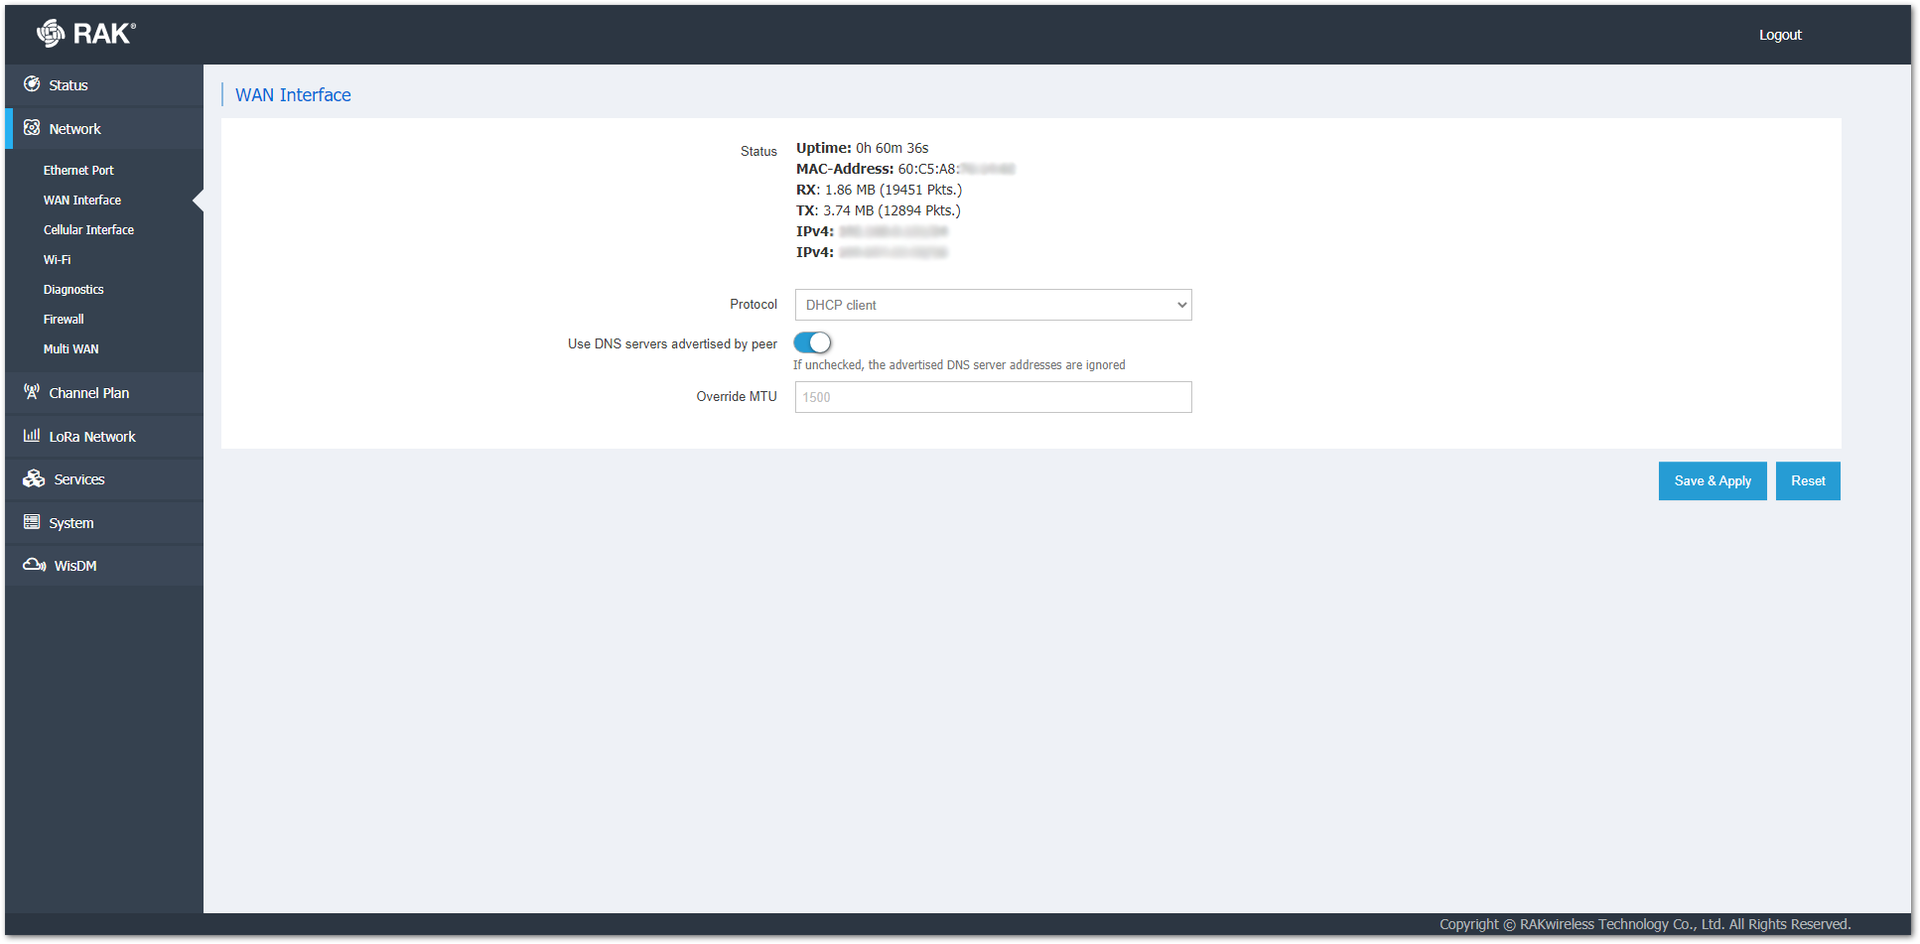 Figure 1: WAN Interface Page
There are 2 options for the protocol:
- Static address: Allows you to put a static address that will be used by the gateway.
- DHCP client: The gateway will use the address that the router assigns to it.
When Static address is selected, other settings that can be done:
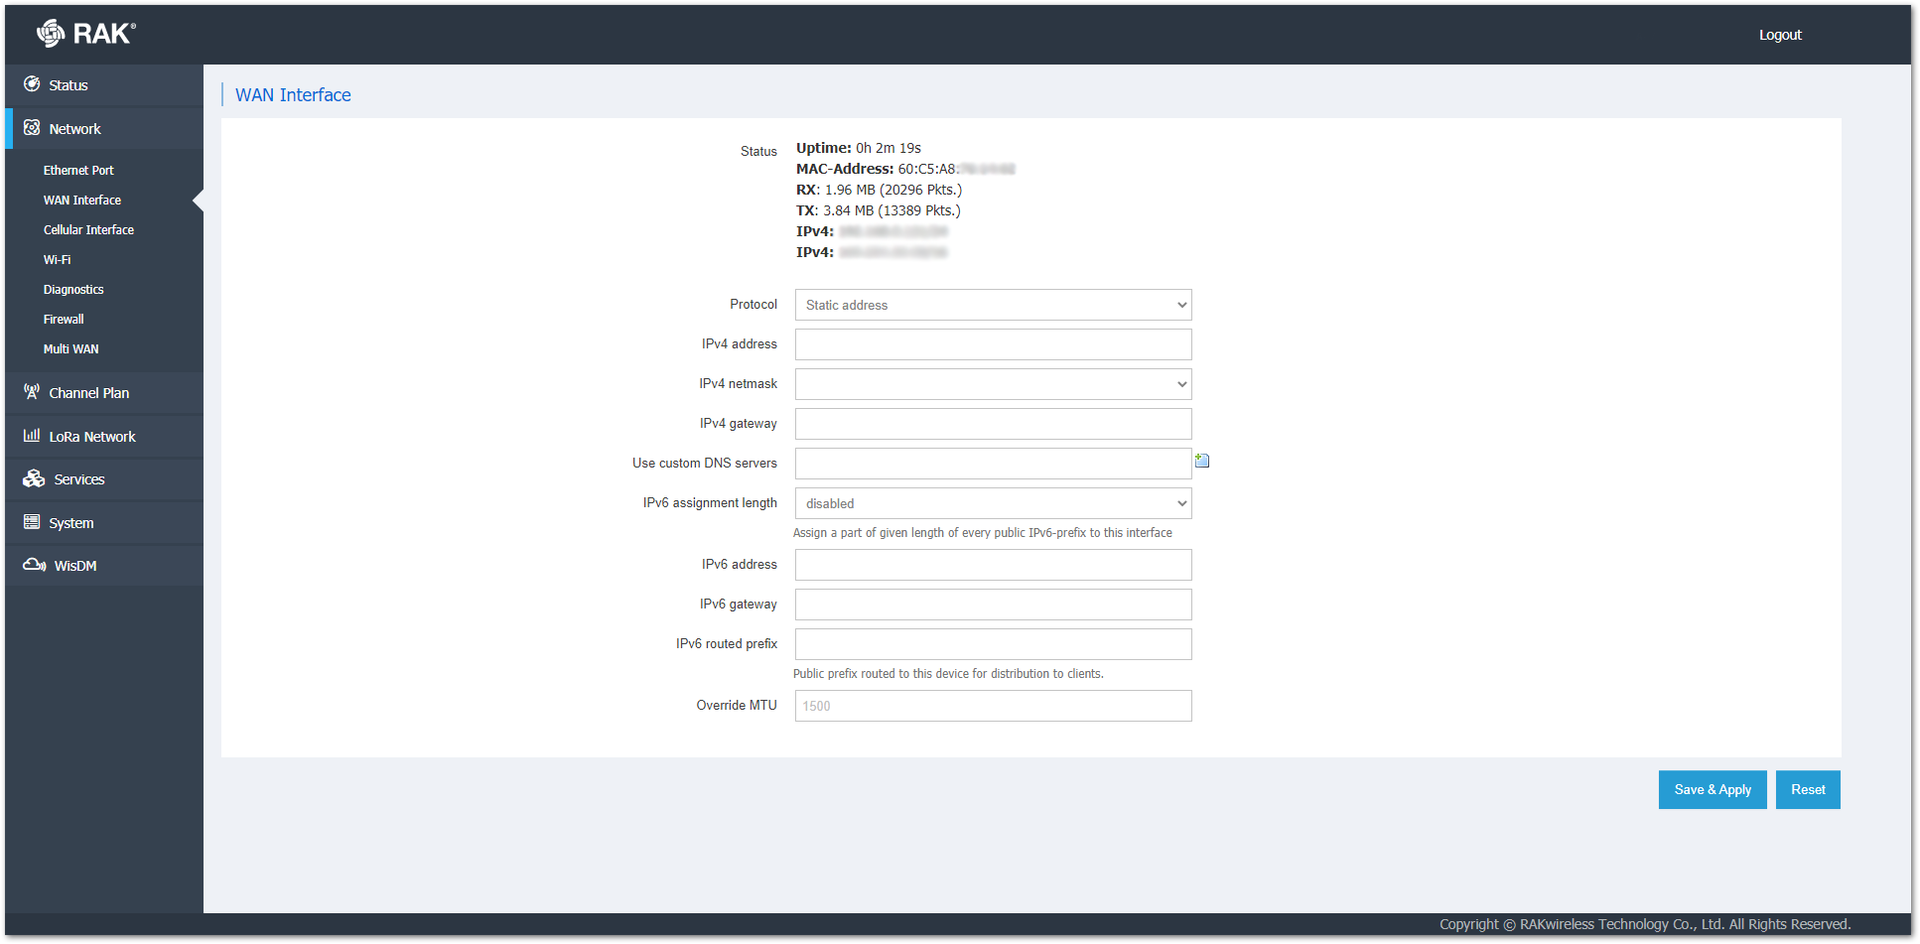 Figure 1: WAN Interface with Static Address Page
IPv4 address: The network address in Internet Protocol version 4.
IPv4 netmask: The subnet mask in Internet Protocol version 4.
IPv4 gateway: The address that will be assigned to the Gateway in Internet Protocol version 4.
Use custom DNS servers: Flipping the DNS switch allows you to enter a custom DNS server address.
IPv6 assignment length: You can assign a part of given length of every public IPv6-prefix to this interface.
IPv6 address: The network address in Internet Protocol version 6.
IPv6 gateway: The address that will be assigned to the gateway in Internet Protocol 6.
IPv6 routed prefix: A public prefix routed to this device for distribution to clients.
Override MTU: You can set the Gateway MTU size (1500 standard).
Cellular Interface
This page is where you can make changes on the Cellular connectivity.
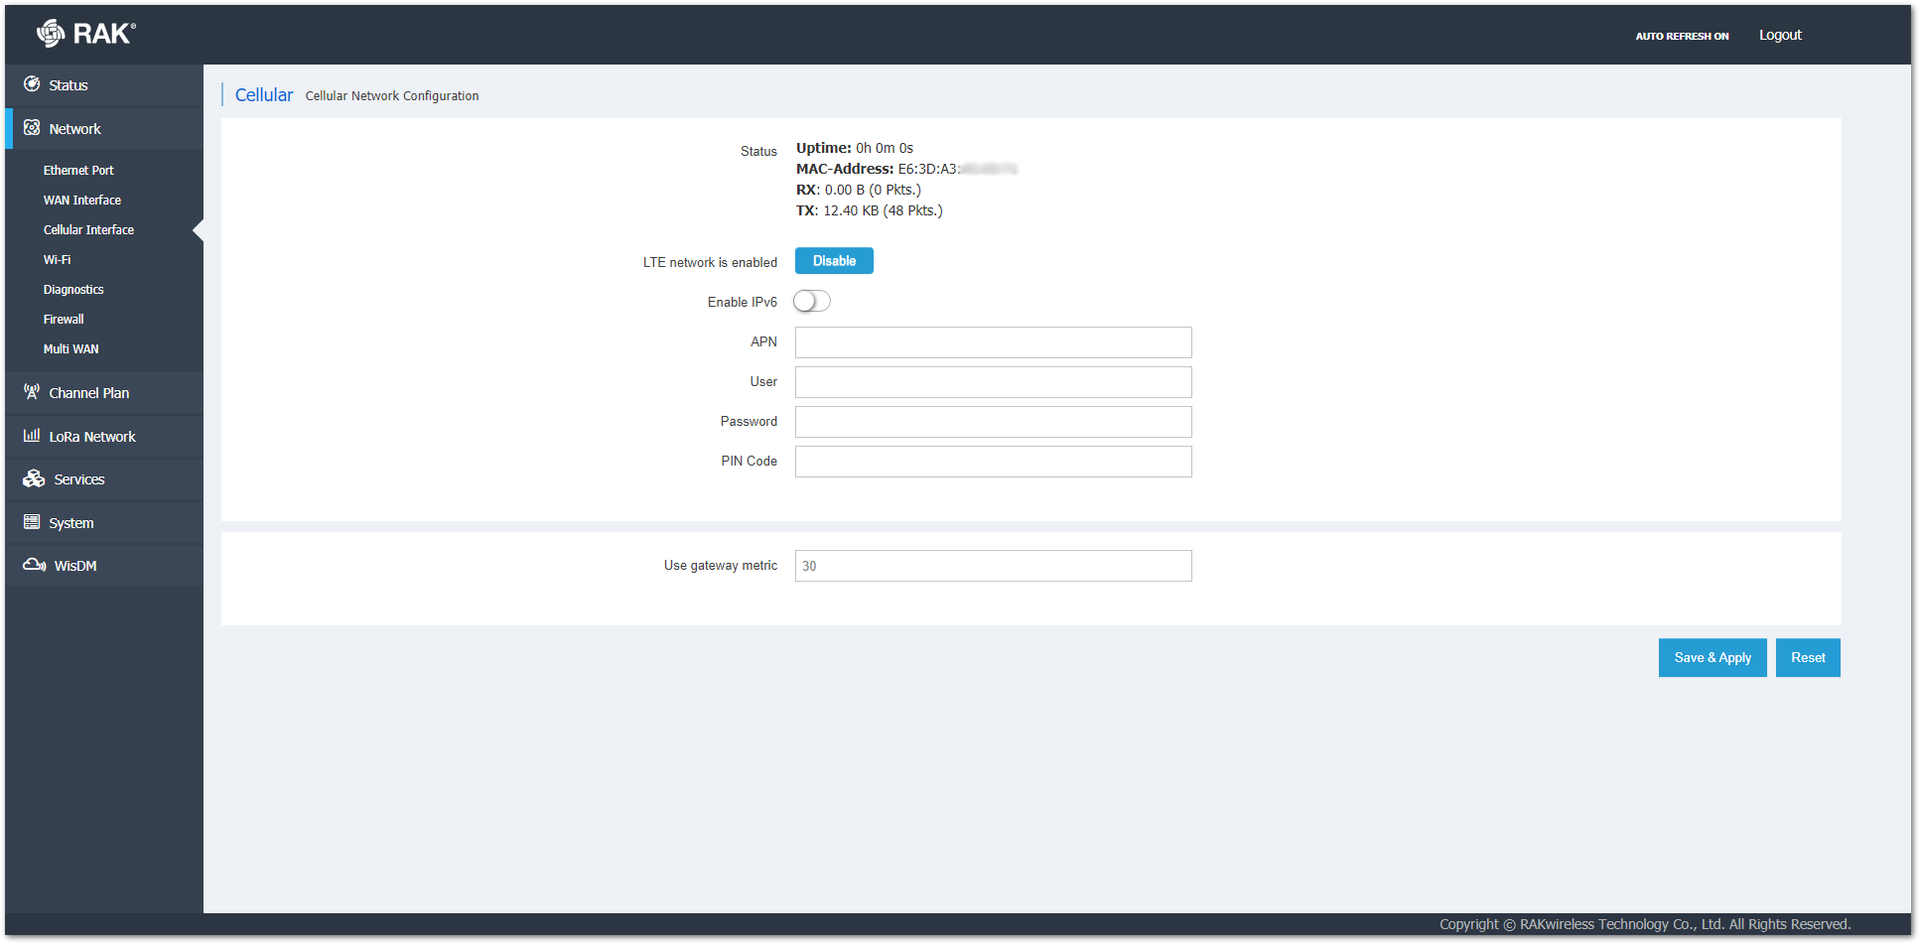 Figure 1: Cellular Interface Page
- Status: This shows the Uptime, MAC-Address, RX (received packets), and TX (sent packets).
- LTE network is enabled: A button that enables/disables the interface.
- Enable IPv6: Enables the Internet Protocol version 6 for the Cellular interface.
- APN: The Access Point Name of the SIM provider (filled if needed).
- User: Username used for authorization.
- Password: Password for authorization.
- PIN Code: The PIN code of the SIM Card (filled if needed).
Wi-Fi
This page is where you can make changes in the Wireless connection. Enabling/Disabling the Wireless interface can be done via the blue button at the top. Additionally, you can pick a radio channel or leave it on Autoconfiguration (default). By default, your mode will be Access Point. The available options are:
- Access Point: Only AP will be available for accessing the gateway. When using this mode, you will see a field Wireless Access Point.
- ESSID: This field shows the name of the AP of the gateway. The name can be changed according to your desires. The default name is RAKXXXX_YYYY, where 'XXXX' is the model of the gateway (e. g. 7249), and 'YYYY' are the last symbols of the MAC address of the gateway.
- Encryption: You can choose between the four standards to use to protect the AP - No Encryption, WPA-PSK, WPA-PSK2, or WPA-PSK/WPA2-PSK Mixed Mode. The last option is recommended.
- Key: In selecting an Encryption, a Key field will pop up. You must enter a password, which will be used to connect to the AP.
- Hidden: You can hide the AP by enabling this.
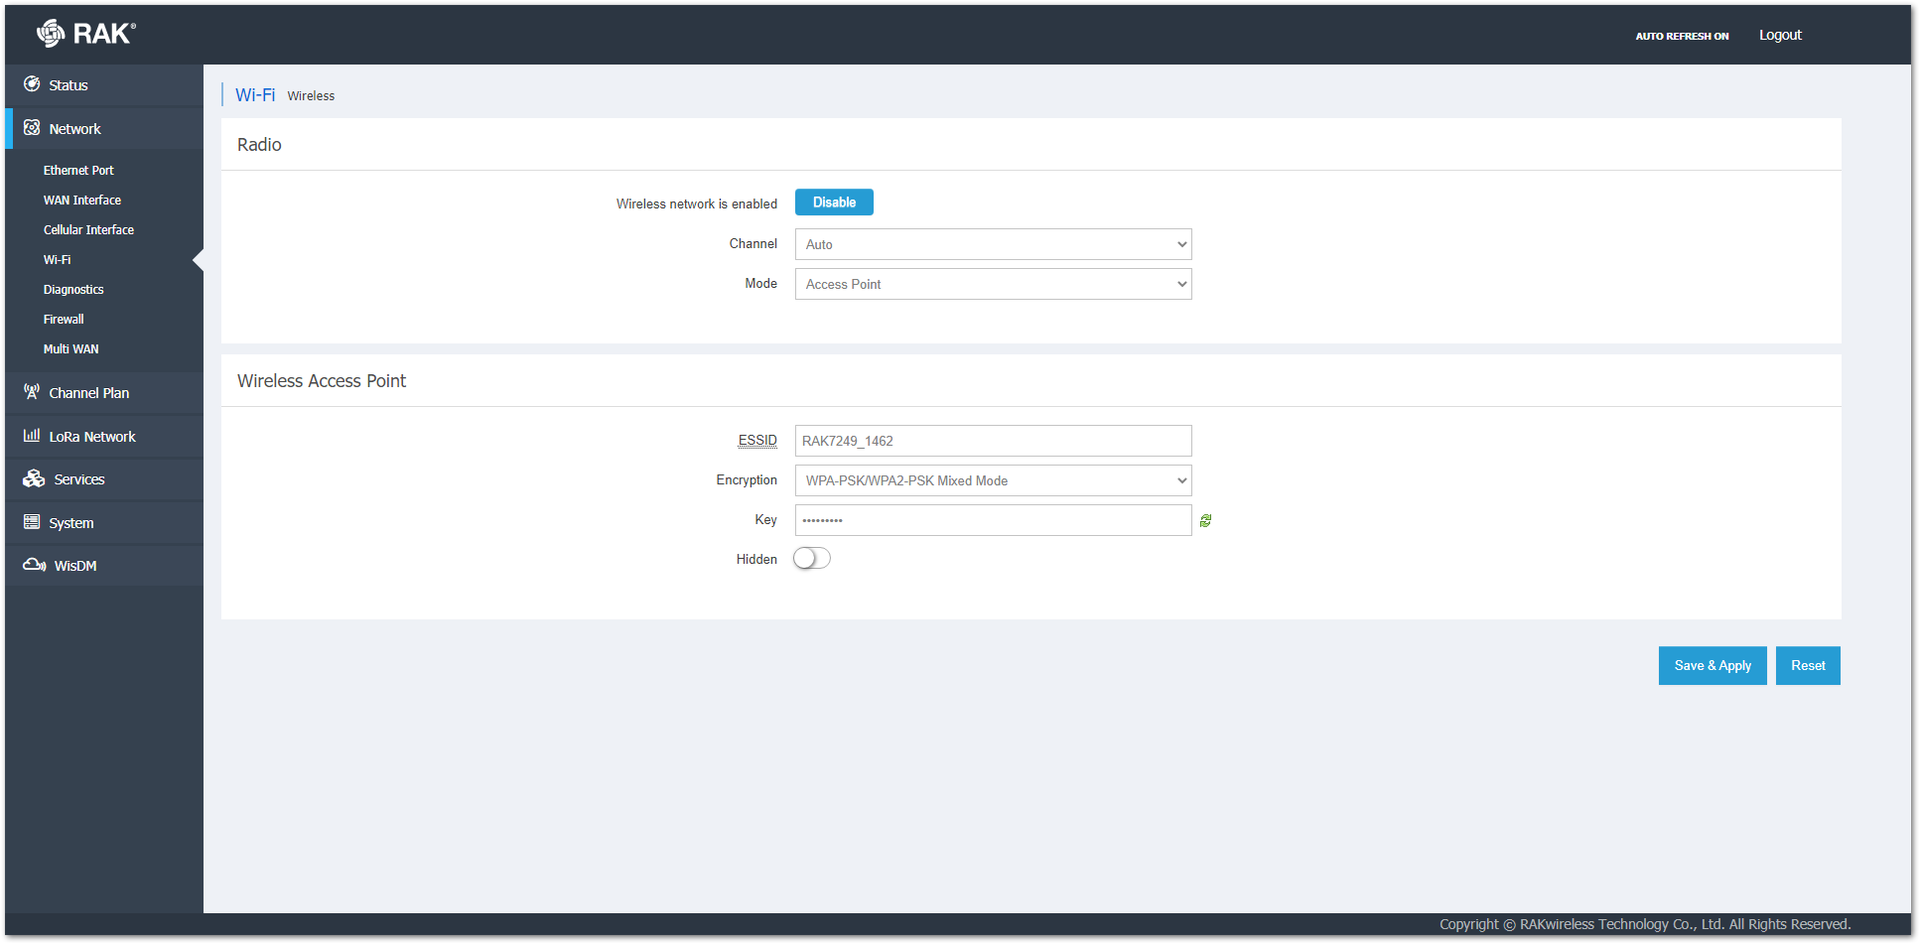 Figure 1: Access Point Mode
- Client: Only the wireless client will be active. By this mode, you can easily connect the gateway to a wireless network. When selecting this mode, a Wireless Client field will appear.
- ESSID: You must type the name of the wireless network, to which they want to connect the gateway to.
- Encryption: You choose the encryption the wireless network is using. They can choose between four (4) standards - No Encryption, WPA-PSK, WPA-PSK2, or WPA-PSK/WPA2-PSK Mixed Mode.
- Key: With selecting an Encryption, a Key field will pop up. You must type the password that is used by the wireless network.
- Below the Wireless Client menu, there is another menu. The first element is the Status field where you can check statistics about the gateway (Uptime, MAC-Address, TX, RX, and IPv4 Address). You can also configure the protocol to be used for connecting to the network.
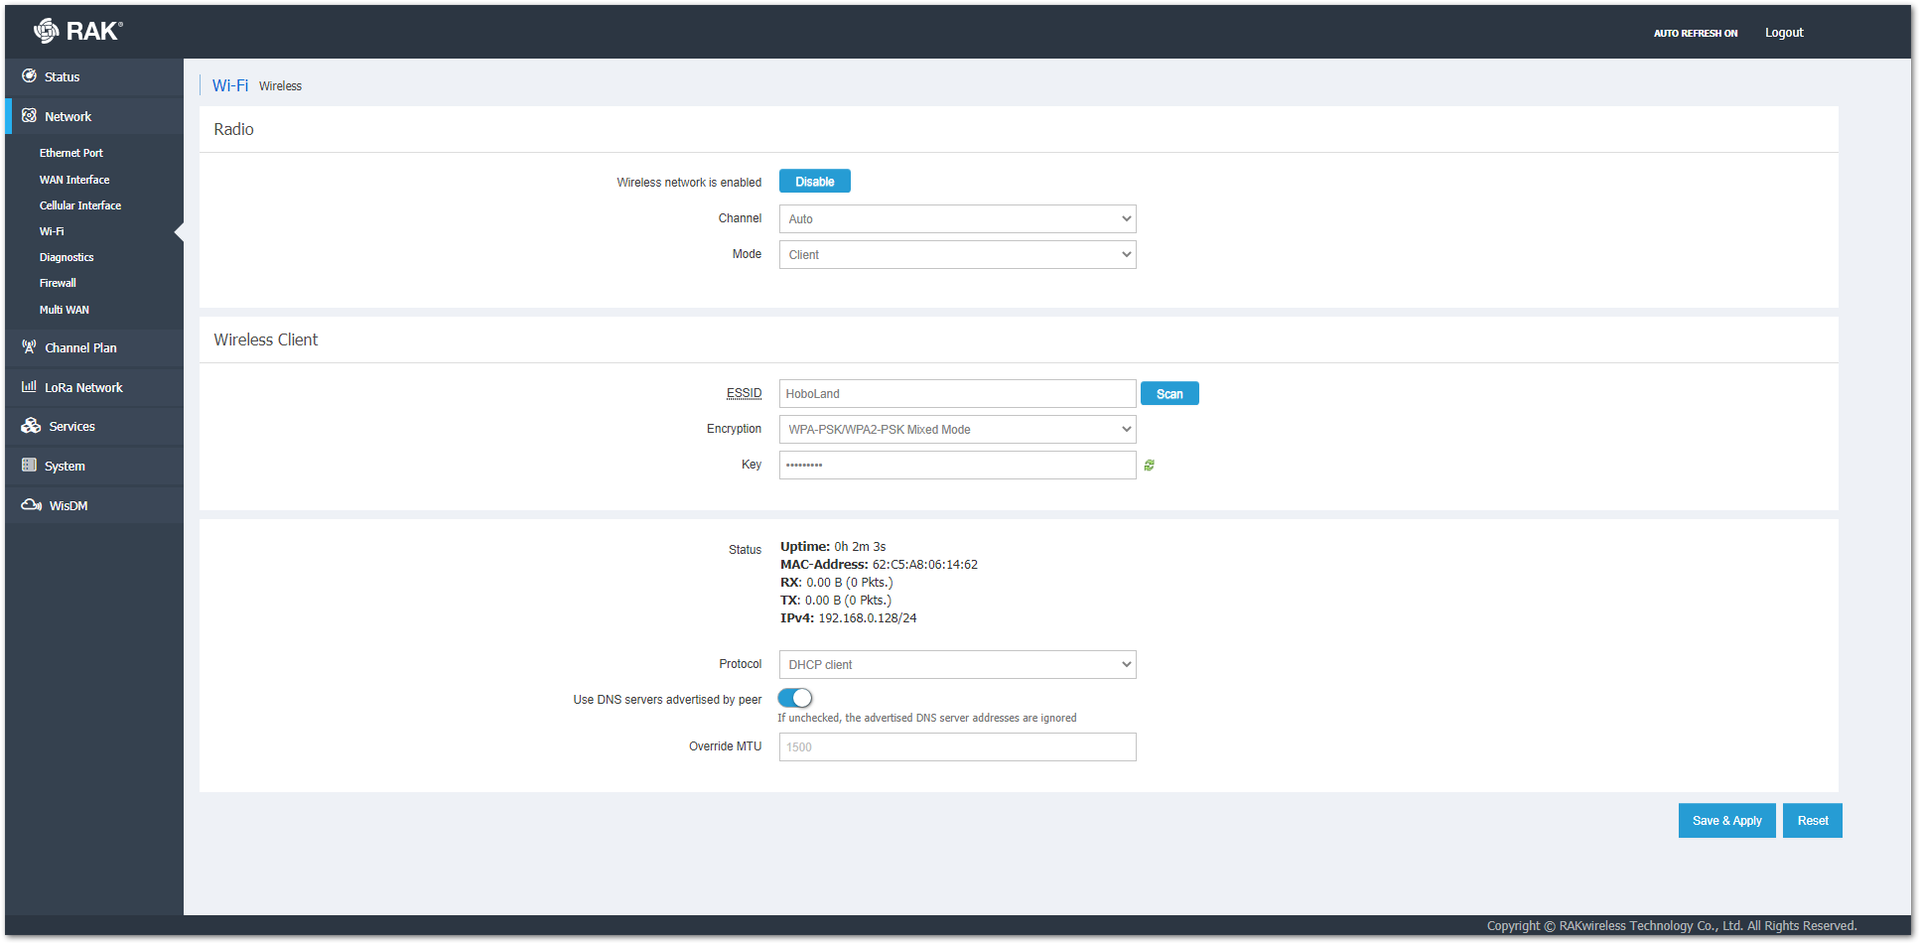 Figure 1: Client Mode Page
There are 2 options for the protocol:
- Static address: Allows you to put a static address that will be used by the Gateway.
- DHCP: The gateway will use the address that the router's DHCP server assigns to it.
When Static address is selected, more settings pop up:
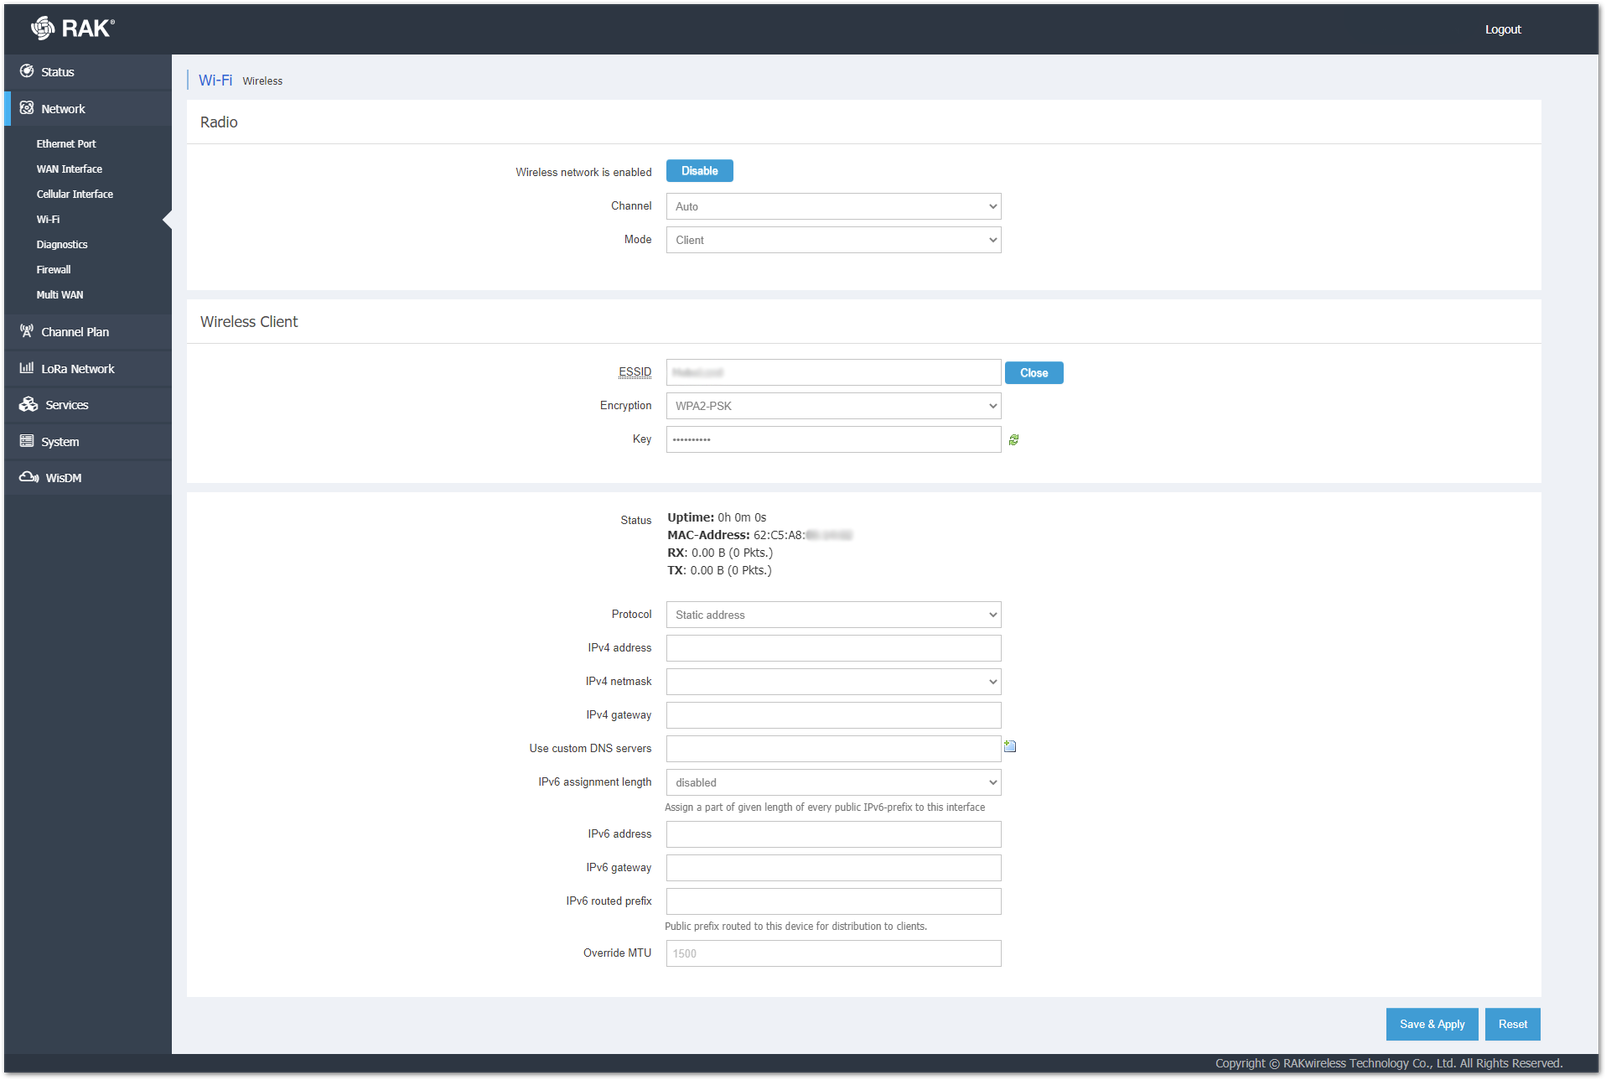 Figure 1: Client Menu with Static Address Page
IPv4 address: The static address in Internet Protocol version 4.
IPv4 netmask: The subnet mask in Internet Protocol version 4.
IPv4 gateway: The address that will be assigned to the Gateway in Internet Protocol version 4.
Use custom DNS servers: Flipping the DNS switch allows you to enter a custom DNS server address.
IPv6 assignment length: You can assign a part of given length of every public IPv6-prefix to this interface.
IPv6 address: The static address in Internet Protocol version 6.
IPv6 gateway: The address that will be assigned to the gateway in Internet Protocol version 6.
IPv6 routed prefix: A public prefix routed to this device for distribution to clients.
Override MTU: You can set the gateway MTU size (Default is 1500).
- Access Point + Client: Both of the previous modes will be available.
- Wireless Access Point: See Access Point configuration to set up AP protection.
- Wireless Client: See Client configuration to connect the gateway to a wireless network.
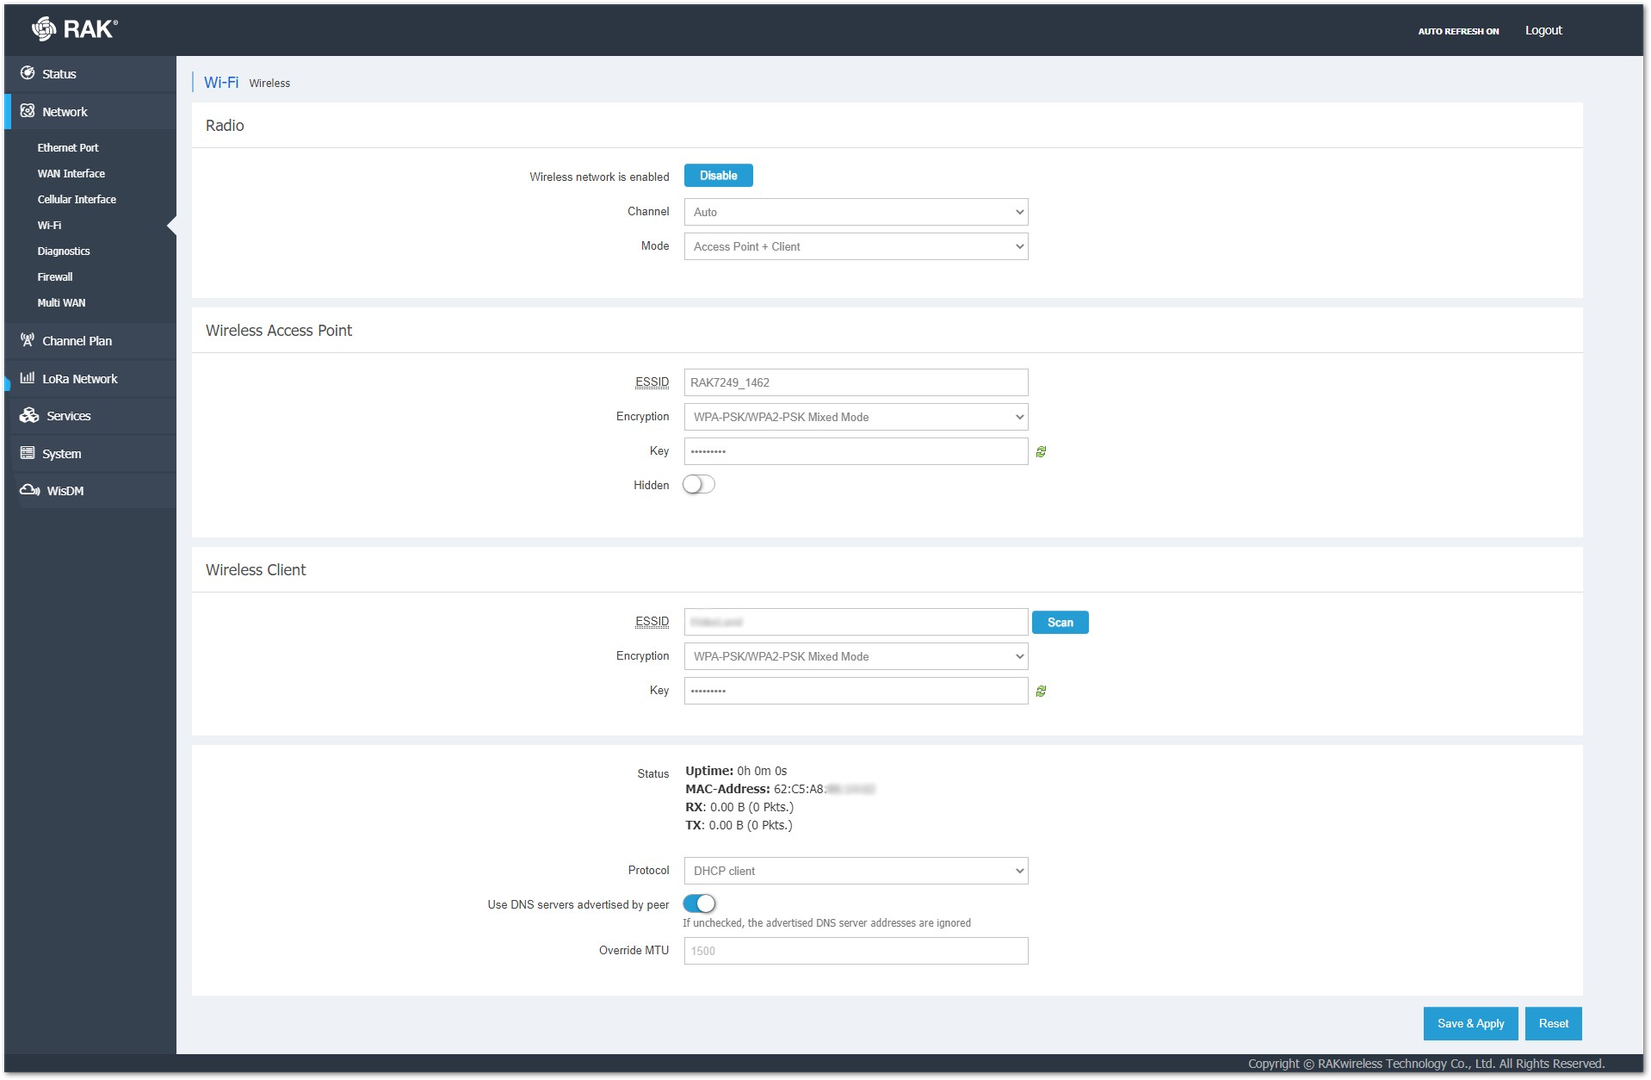 Figure 1: Access Point + Client Mode
Additionally, you can choose a preferred protocol for the Wi-Fi interface - DHCP client and Static address. The menu is the same as the WAN Interface.
To see how to configure each mode, refer to Wi-Fi Modes Configuration documentation.
Diagnostics
This is where you can perform checks via the built-in tools: Ping, Traceroute, and Nslookup.
You can either enter an URL or an IP Address in the text box and execute the command with the button. Both IPv4 and IPv6 are supported (chosen via the drop-down menu). The results are conveniently displayed in a CLI box.
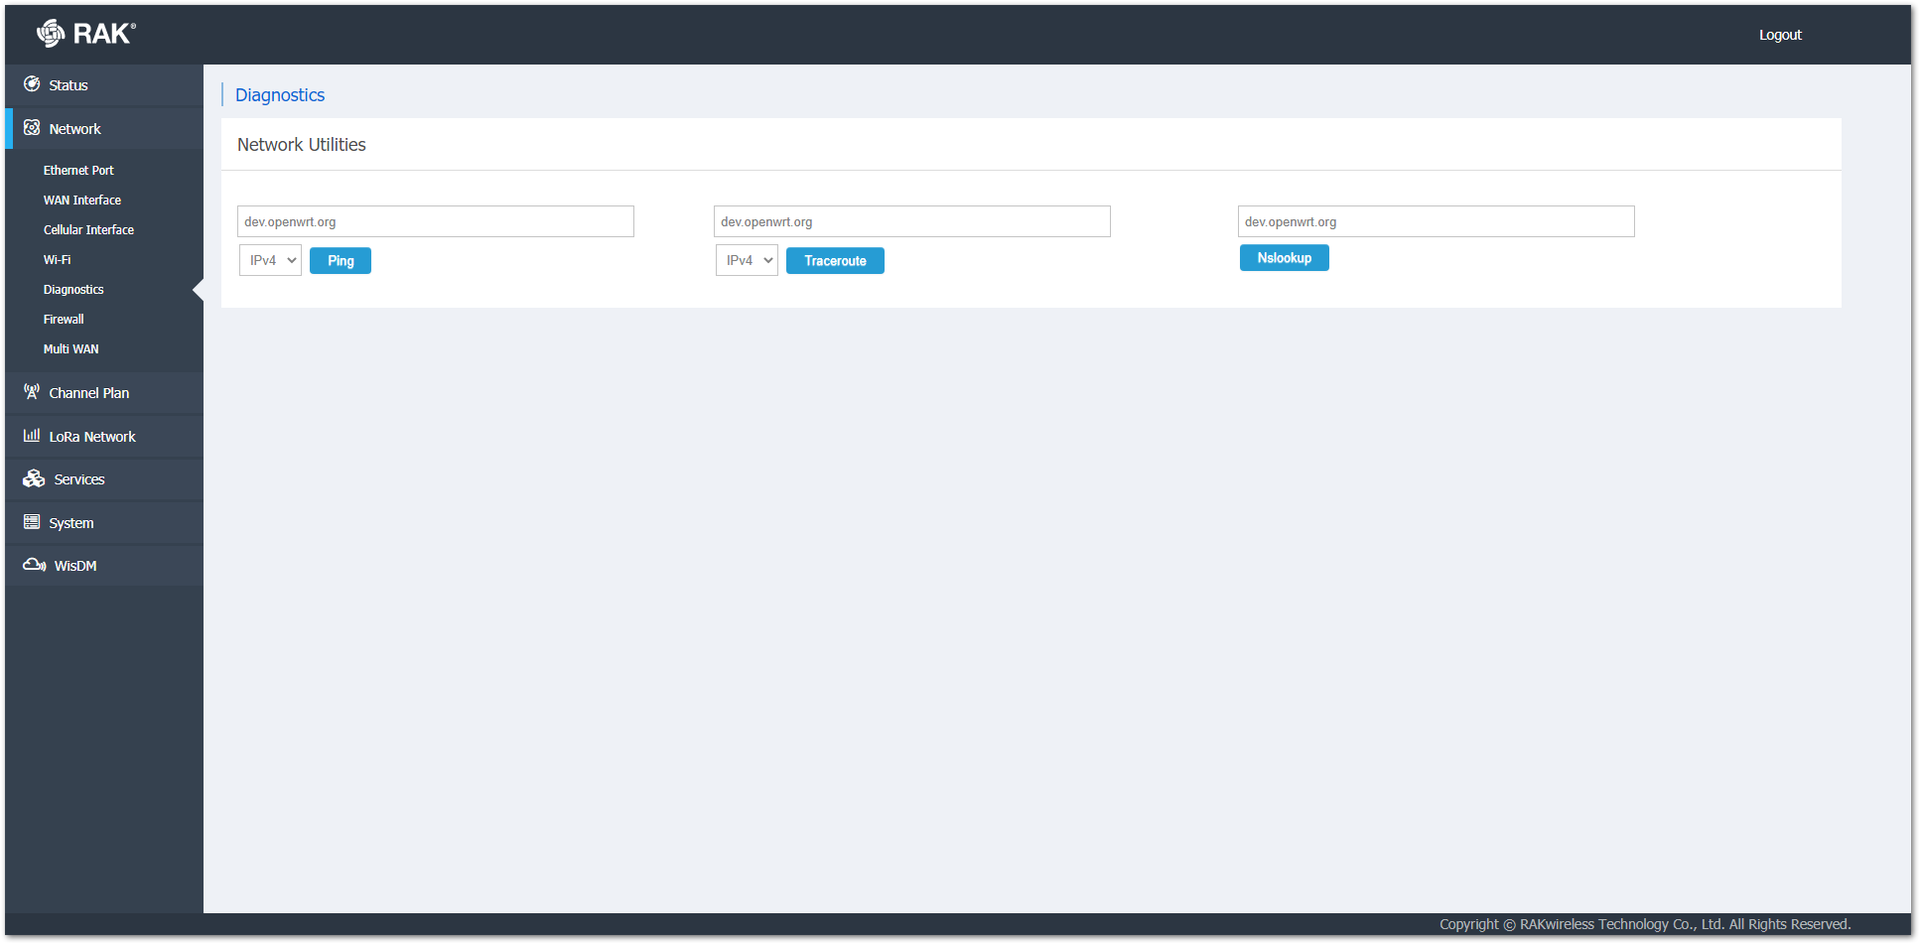 Figure 1: Diagnostics Page
Firewall
The Firewall settings won’t be discussed in detail in this document due to the large variety of settings to be configured. This document will give a simple overview of the interface instead.
The Firewall page has a few separated tabs:
- General Settings: This tab has two fields. The first field is the General Settings tab where general settings can be done: Enable/Disable SYN-flood protection, Drop invalid packets on/off, and Input/Output/Forward settings. The second field is for Zones settings where you can set up separate settings for the zones.
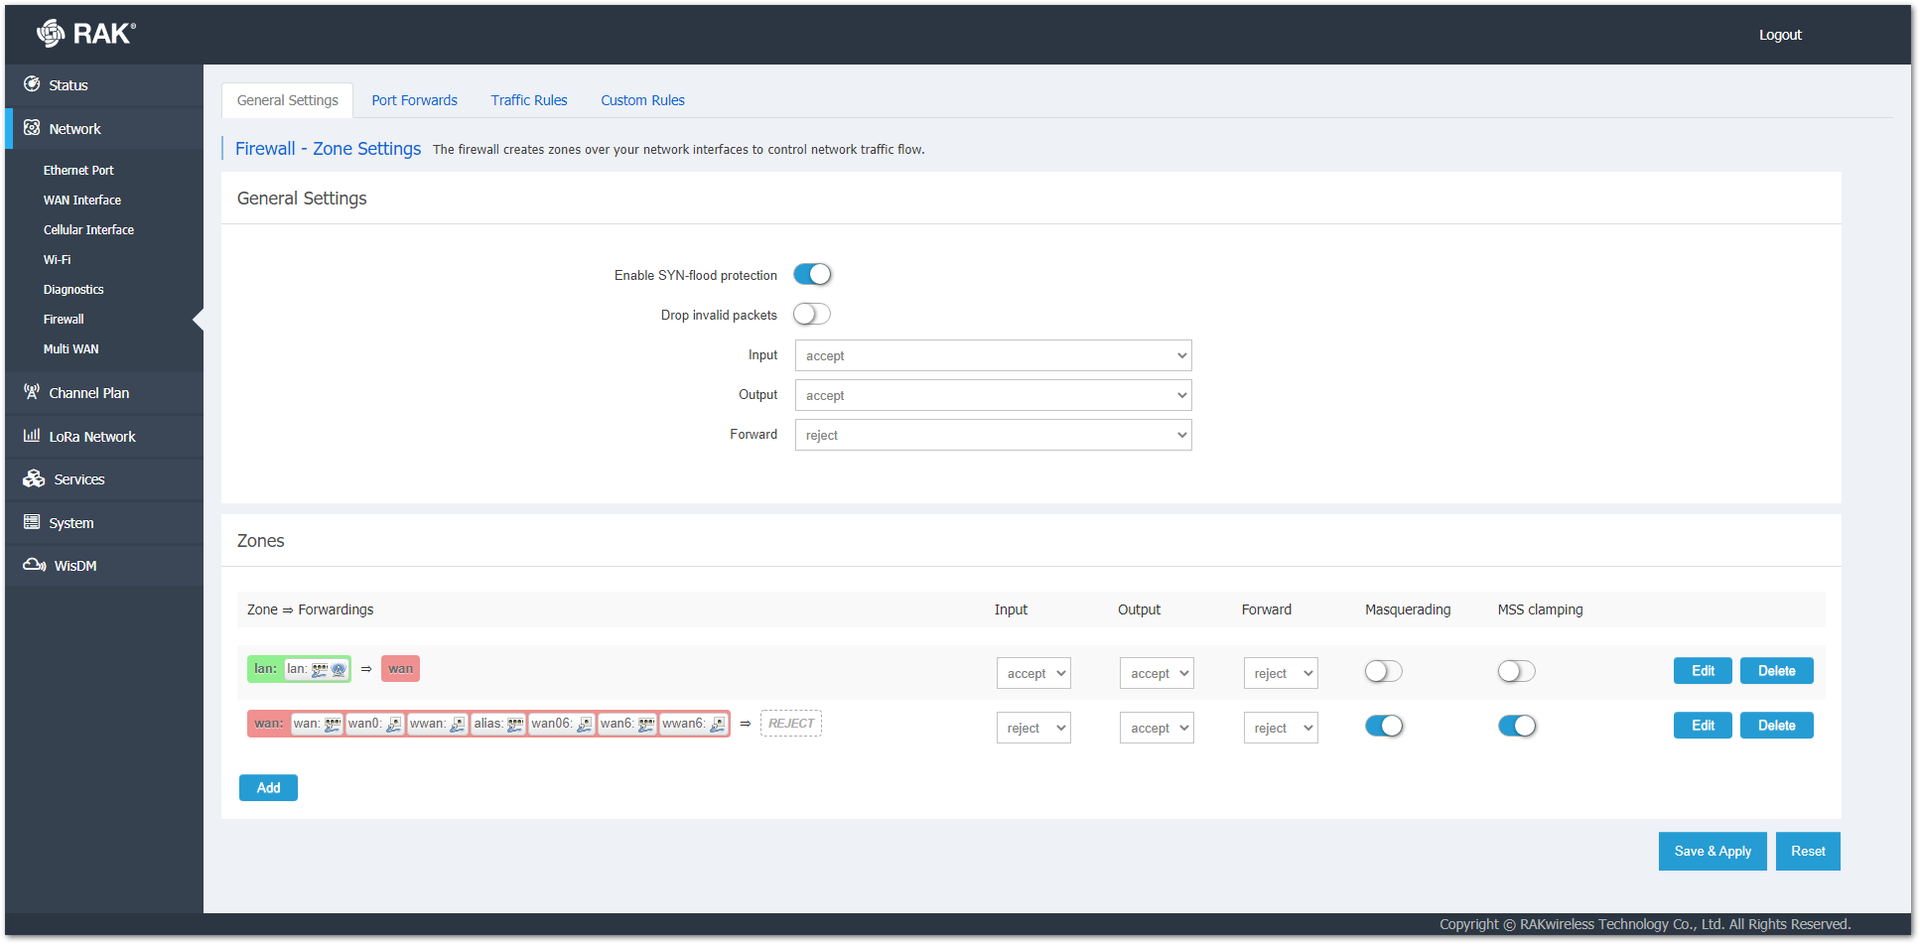 Figure 1: General Settings Tab
- Port Forwards: This tab allows you to set up the port forwards. Port forwarding allows remote computers on the Internet to connect to a specific computer or service within the private LAN. In the tab, there is a register with the port forwards that are already set up, and below is a couple of fields to set up a new port forward.
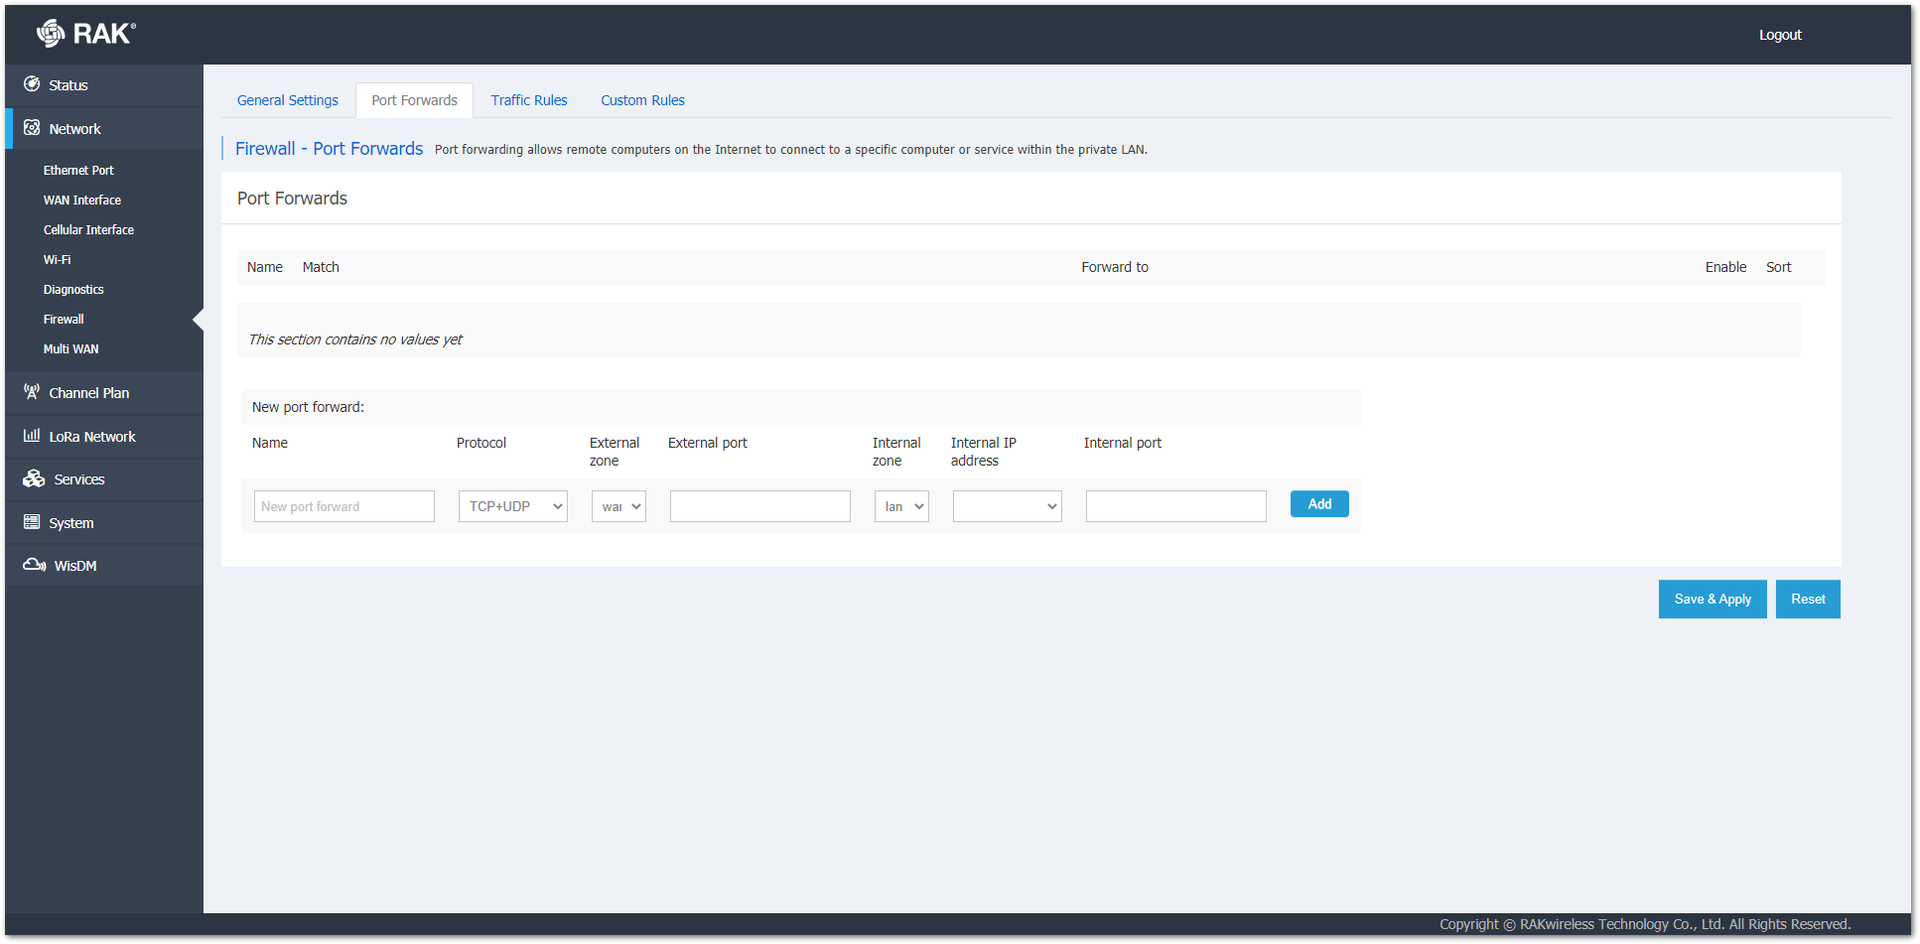 Figure 1: Port Forwards Tab
- Traffic Rules: This tab allows you to set up the traffic rules. Traffic rules define policies for packets traveling between different zones, for example, to reject traffic between certain hosts or to open WAN ports on the router.
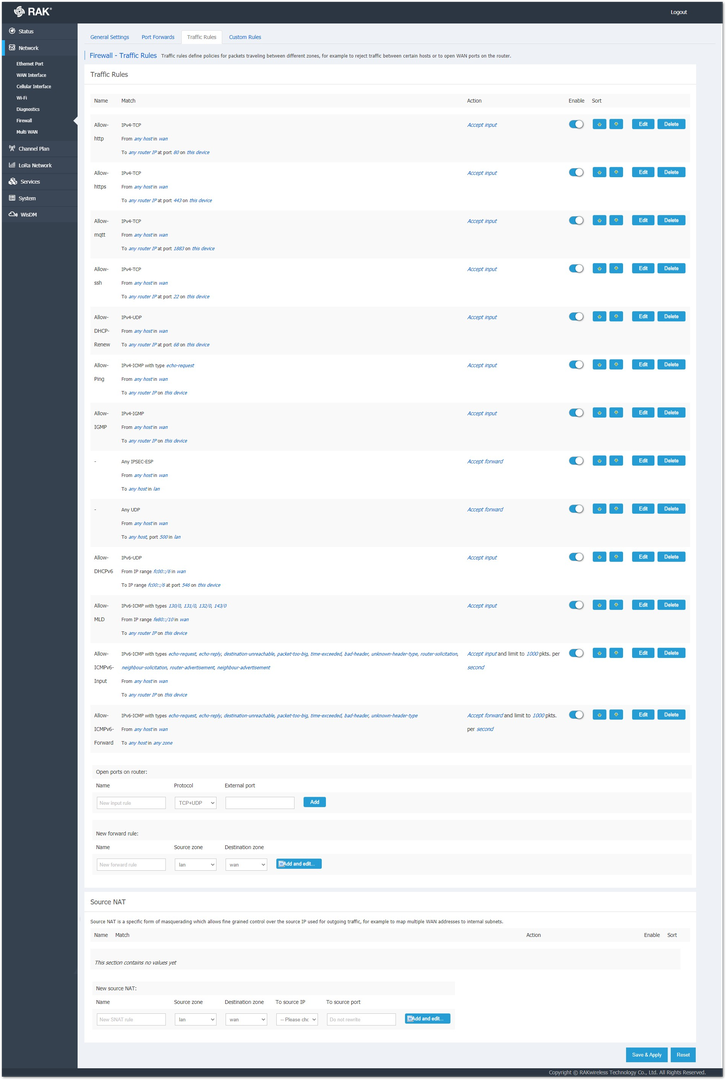 Figure 1: Traffic Rules Tab
- Custom Rules: This tab allows you to execute arbitrary iptables commands which are not otherwise covered by the firewall framework. The rules that will be written is interpreted as a shell script.
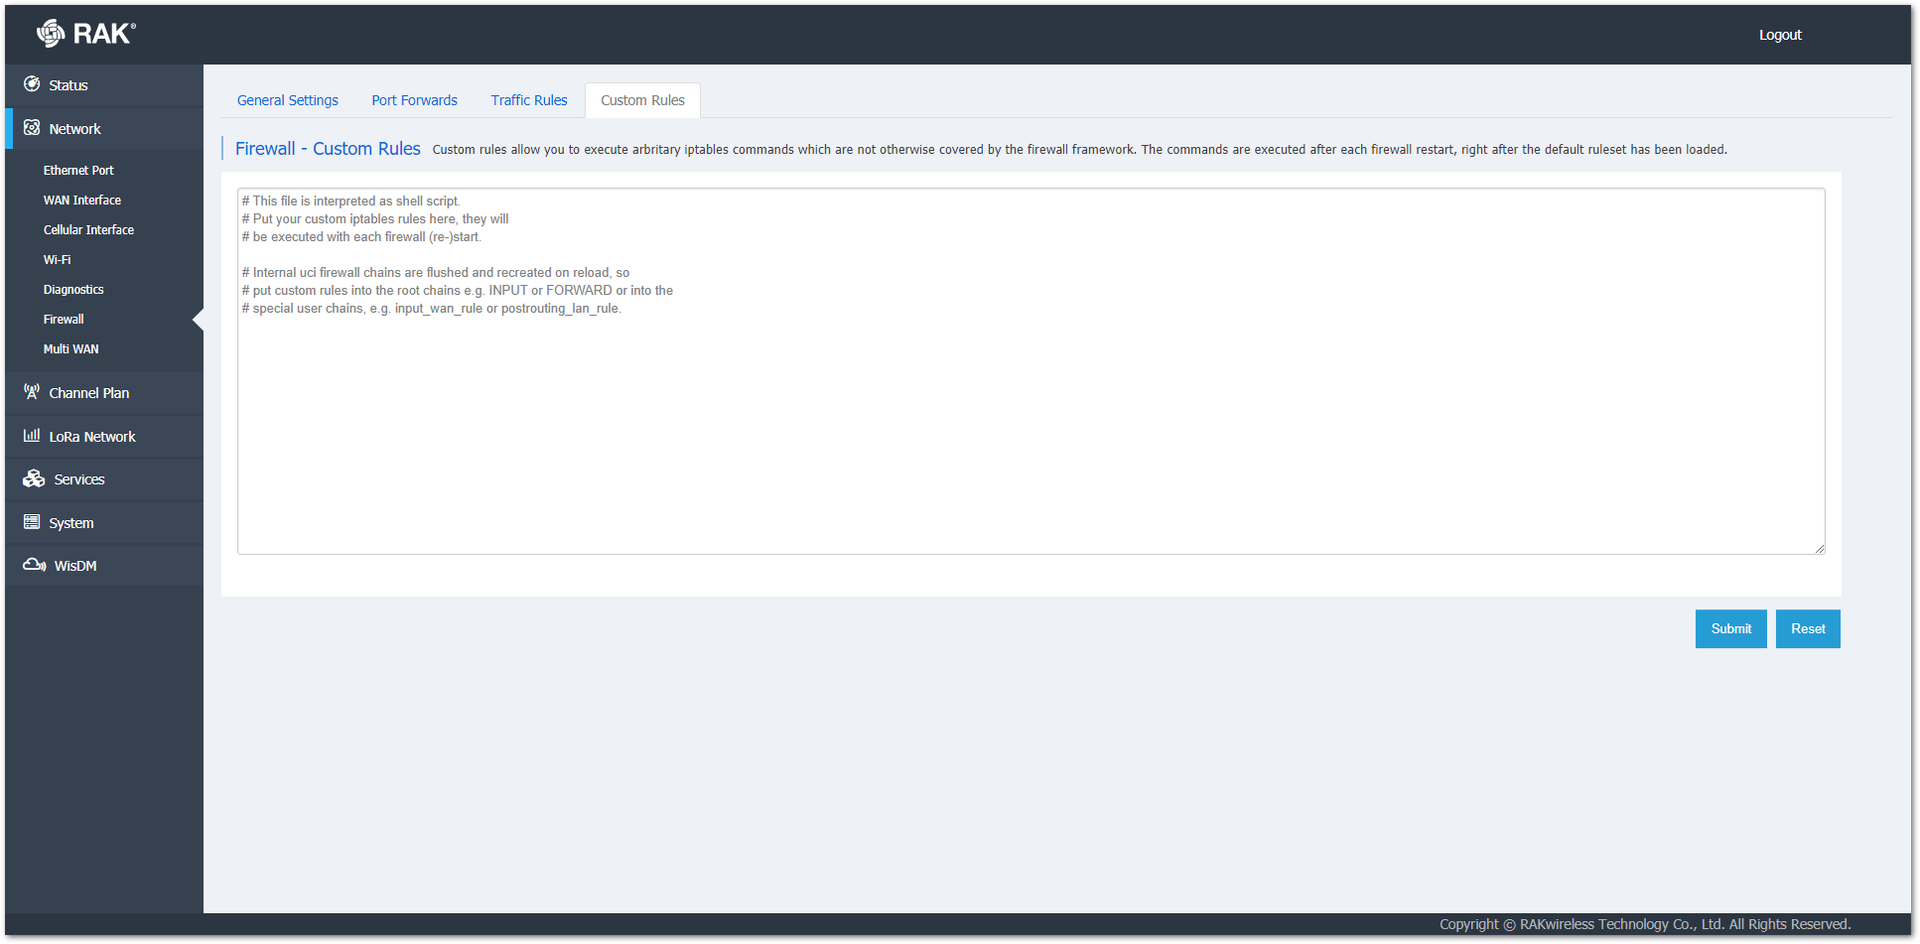 Figure 1: Custom Rules Tab
Multi WAN
In the Multi WAN menu, you can can set a priority for all the interfaces. If highest priority WAN source goes down, other in line will be used to access Internet. In the WAN Source Status, it shows which interface is available.
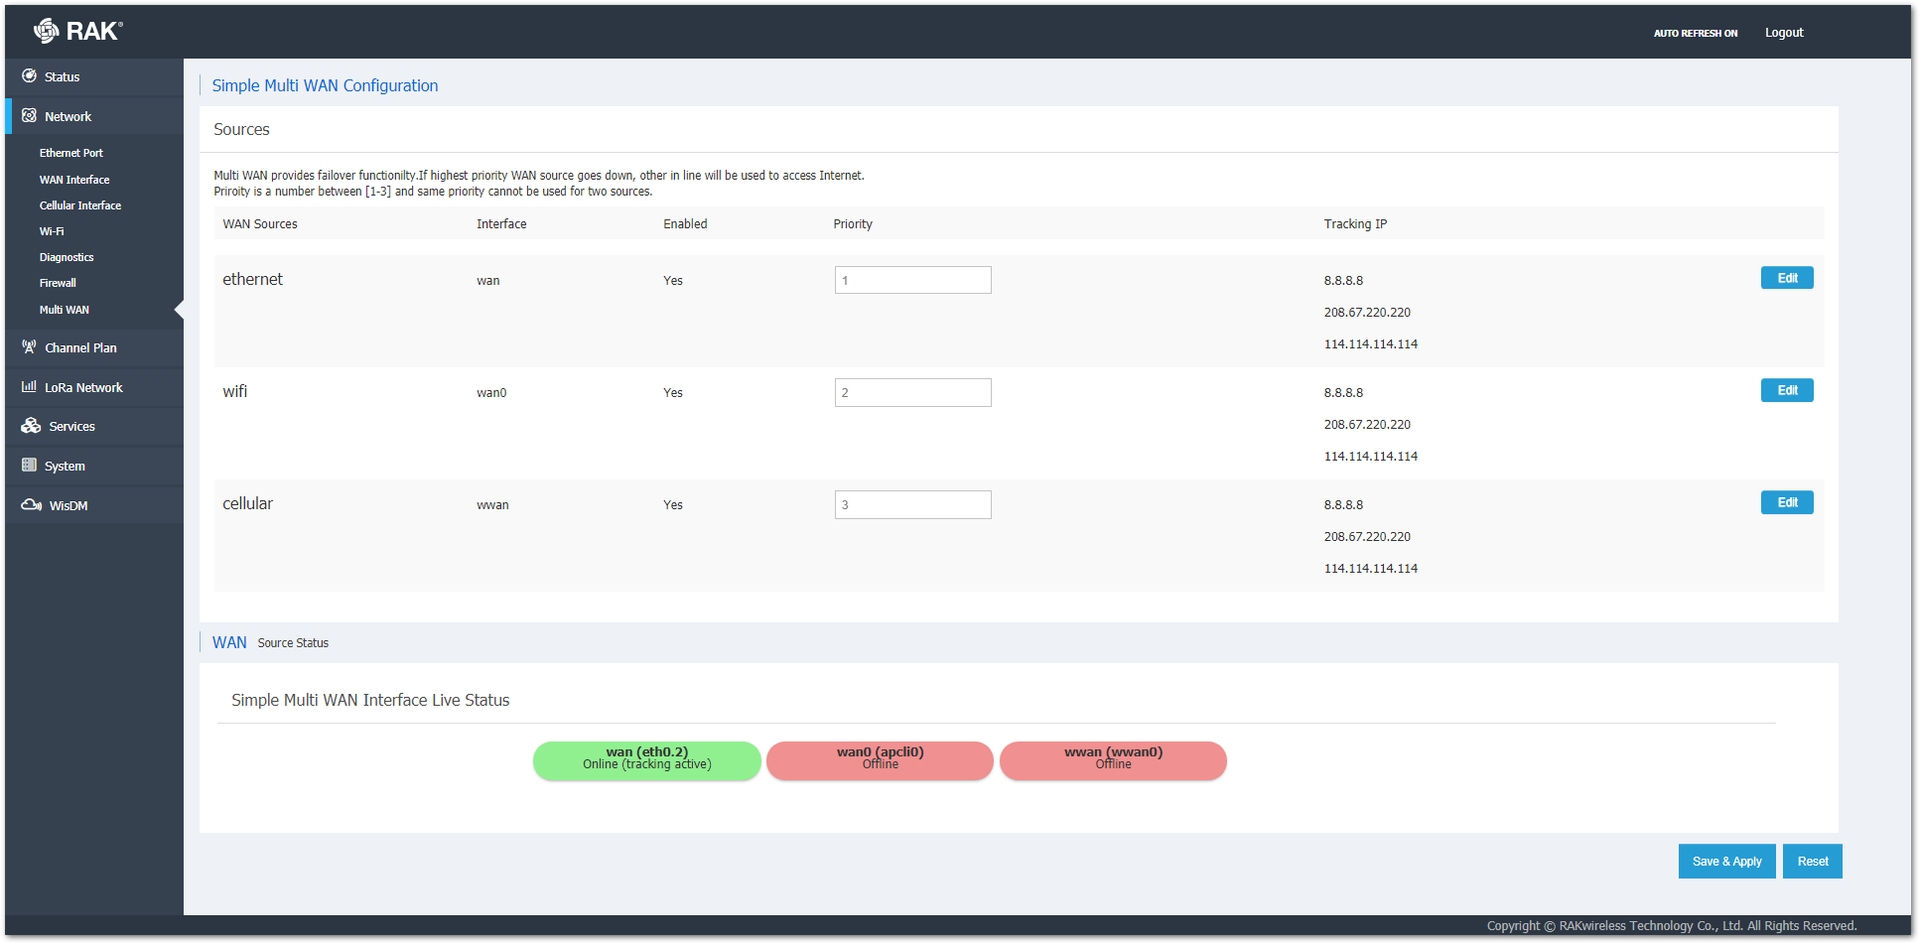 Figure 1: Multi WAN Tab
Channel Plan
In the Channel Plan, you can set up the operating frequency of the gateway. These frequency channels are the ones that the gateway will use to both receiving and transmitting from/to LoRa nodes. The first field on the page is for the Region that the gateway is set to. You can also change the region, corresponding to the frequency band for their country. The other modifications that can be done are LoRaWAN Public (on/off), Multi-SF LoRa Channel, Standard Lora Channel, and FSK Channel.
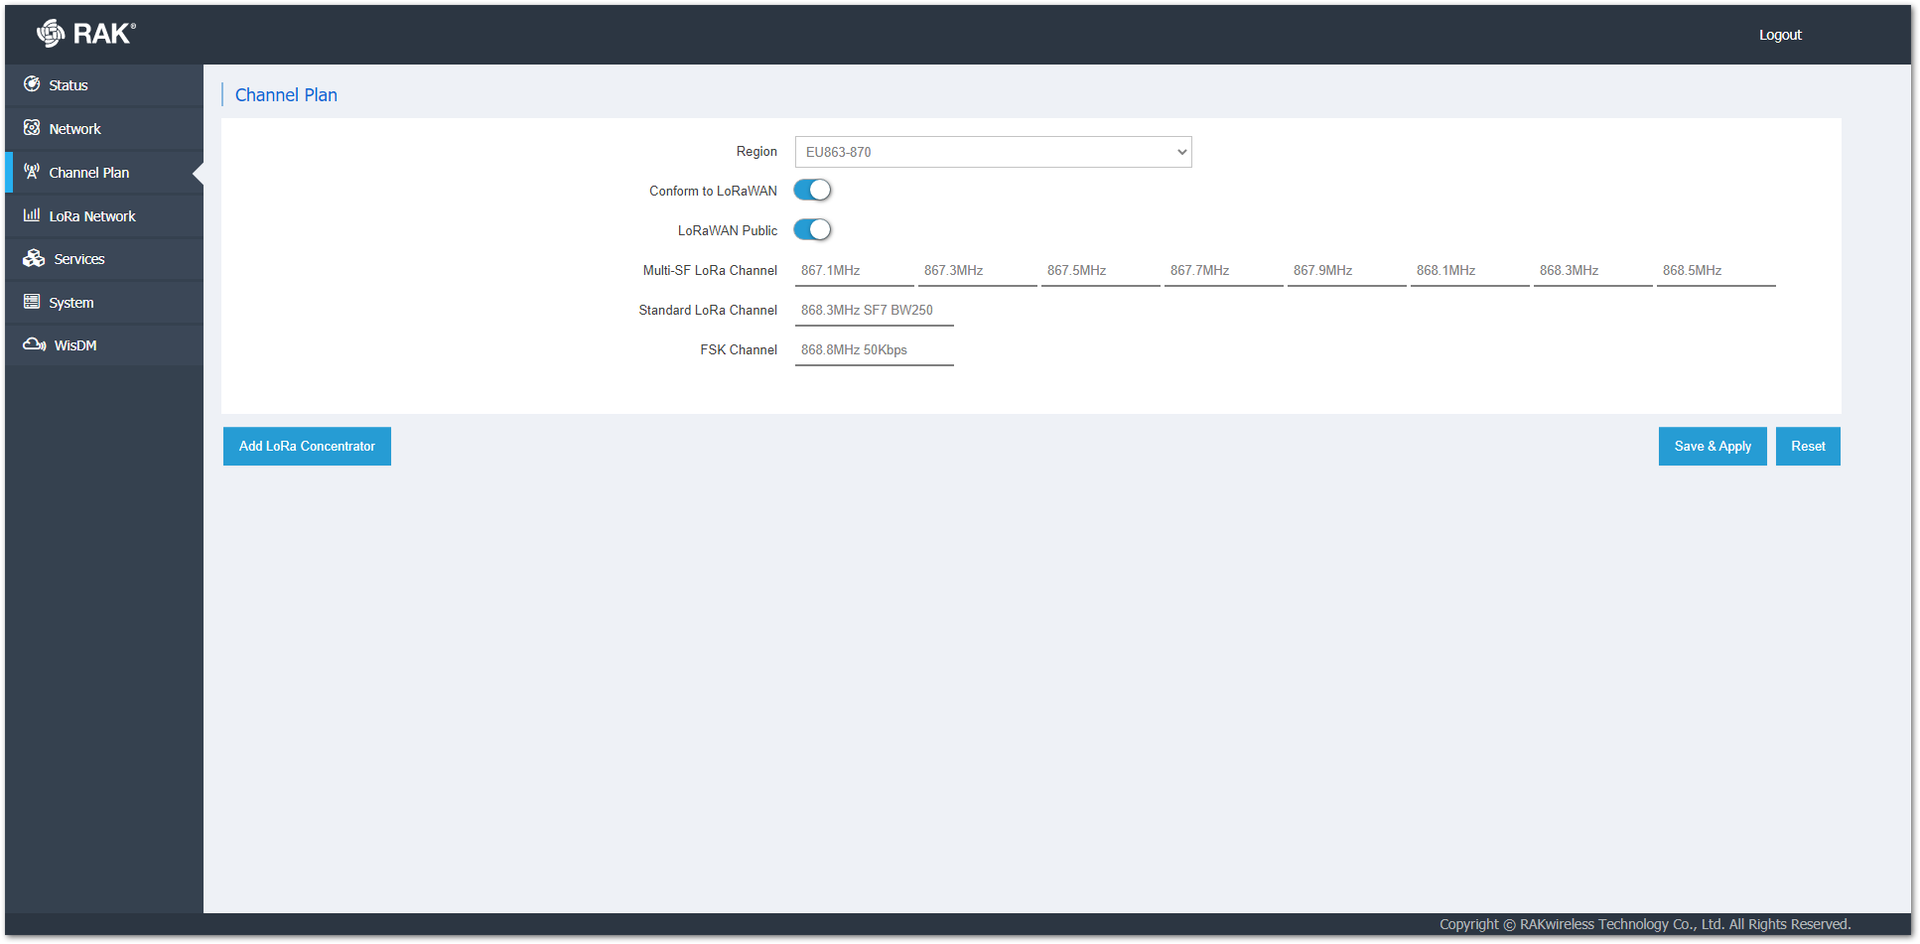 Figure 1: Channel Plan Page
There is also the button Conform to LoRaWAN that when turned off, it will give you a possibility to set up a Radio Configuration for each concentrator.
 Figure 1: Switch to Advanced Mode Tab
LoRa Network
Network Settings
Here, the working mode of the gateway is set up. In the LoRaWAN Network Settings field, you can find the Gateway EUI and set the Mode (Packet Forwarder, Basics Station, and Network Server) and Log Level (Error, Warning, Notice, Info, and Debug). Depending on the chosen mode, the set of available settings change.
Packet Forwarder
- General Setup: All the needed variables for configuration are as follows:
- Protocol: You can choose what protocol will be used by the gateway.
- Server Address: The URL of the LoRa Server (in the example: the EU TTN address).
- Server Port Up/Down: These are the ports of the LoRa Server that are going to be used for inbound and outbound traffic.
- Push Timeout (ms): The time delay for the server response after sending uplink data.
- Statistic Interval (s): The time interval of how often statistics are pushed to the server.
- Keepalive Interval (s): the interval of which the gateway send data to make sure that the server is aware that the gateway is online. For example, the MQTT bridge will unsubscribe from the topics after a certain period of inactivity.
- Automatic data recovery: A feature that allows LoRa frames to be stored on the SD card (provided there is one in the slot). If the gateway loses connection to the LoRa Network Server, upon restoring the connection, the buffered messages will be forwarded, so no data is lost. This is done in blocks of 8 (FIFO) until all are cleared from the buffer.
- DGRAM MTU: The size of the maximum transmission unit. Default is 1400.
- Auto-restart Threshold: This variable defines how many times the Keepalive Interval can expire before the Packet Forwarder restarts.
- Is LoRaWAN Network: When NO is chosen, frames that are not compliant with the LoRaWAN specification will be forwarded (in case of a proprietary LoRa Server solution). By default, YES is selected and non LoRaWAN packets are dropped.
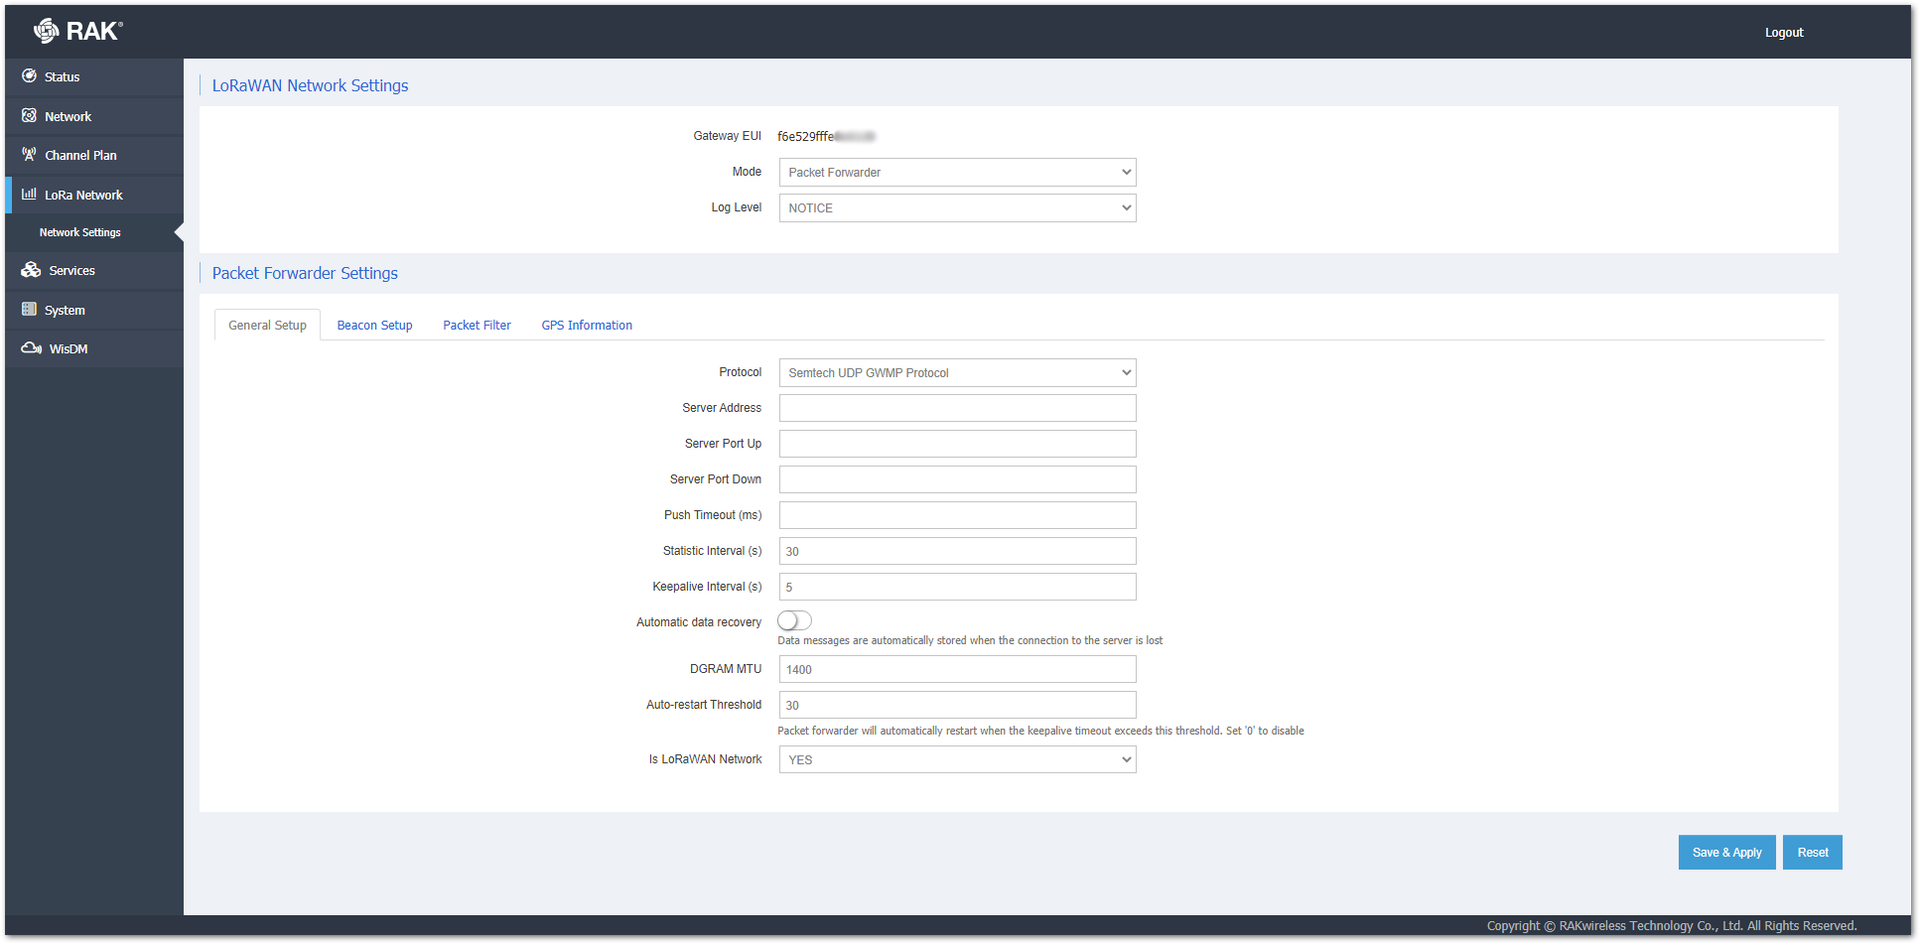 Figure 1: General Setup Tab
-
Beacon Setup
- Beacon Period: How often the beacon is broadcasted.
- Beacon Frequency (Hz): The frequency of the beacon.
- Beacon Channel Number: This is the channel number of the beacon.
- Beacon Frequency Step: The frequency step between beacon channels (in Hz).
- Beacon Spreading Factor: The spreading factor of the beacon.
- Beacon Bandwidth: The bandwidth the beacon is going to use.
- Beacon Tx Power: This is the transmit power of the beacon.
-
Packet Filter
- Enable White List Mode: Enable/disable the functionality that can filter incoming traffic and only forward packets from certain nodes to optimize bandwidth usage over the backhaul.
- OUI List: A white list filtering option.
- Network ID List: A white list filtering option.
- Enable Auto Filter: Functionality that allows nodes to be automatically dropped following a set of the parameters listed below it.
- Discard Period: A period threshold of discard time for nodes (in seconds).
- Join Period: A period threshold of Statistics on the latest join request (in seconds).
- Join Interval: Time interval threshold of the same device EUI twice consecutive join request (in seconds).
- Join Count 1: Maximum count of join requests allowed during Join Interval.
- Join Count 2: Maximum count of join requests allowed during the Join Period.
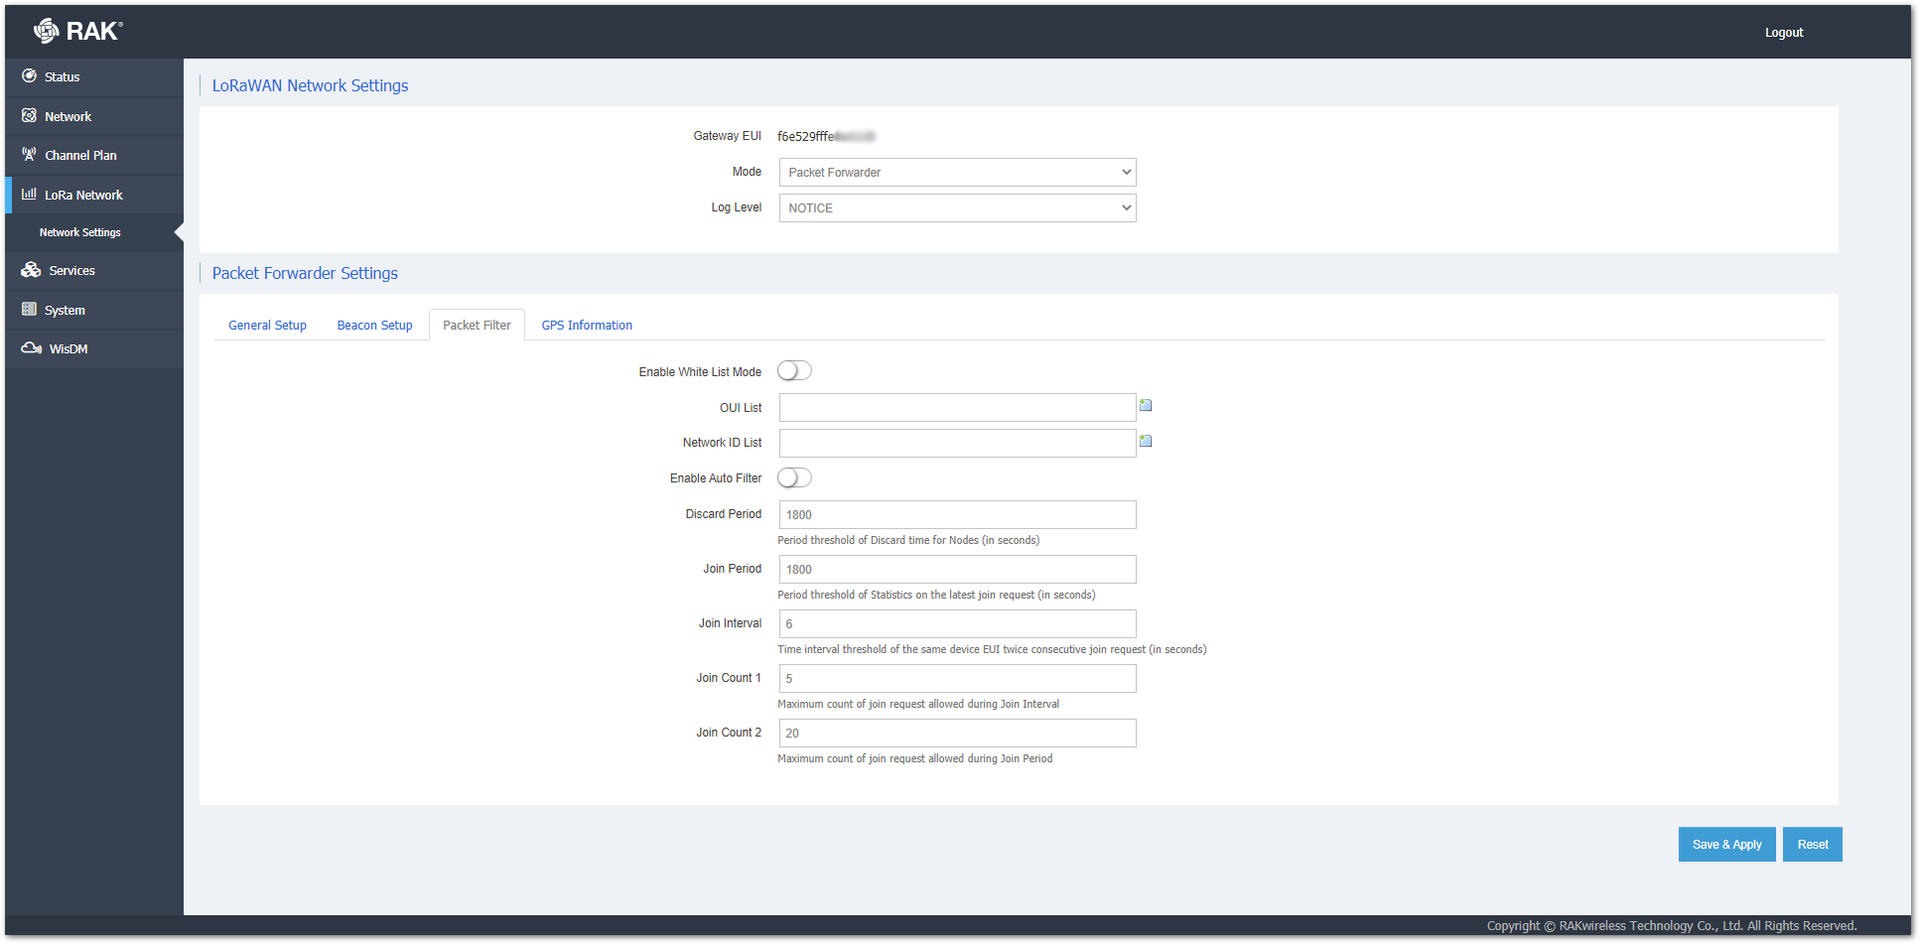 Figure 1: Packet Filter Tab
- GPS Information
- Fake GPS: You can turn on/off the fake GPS functionality and manually set Latitude, Longitude, and Altitude.
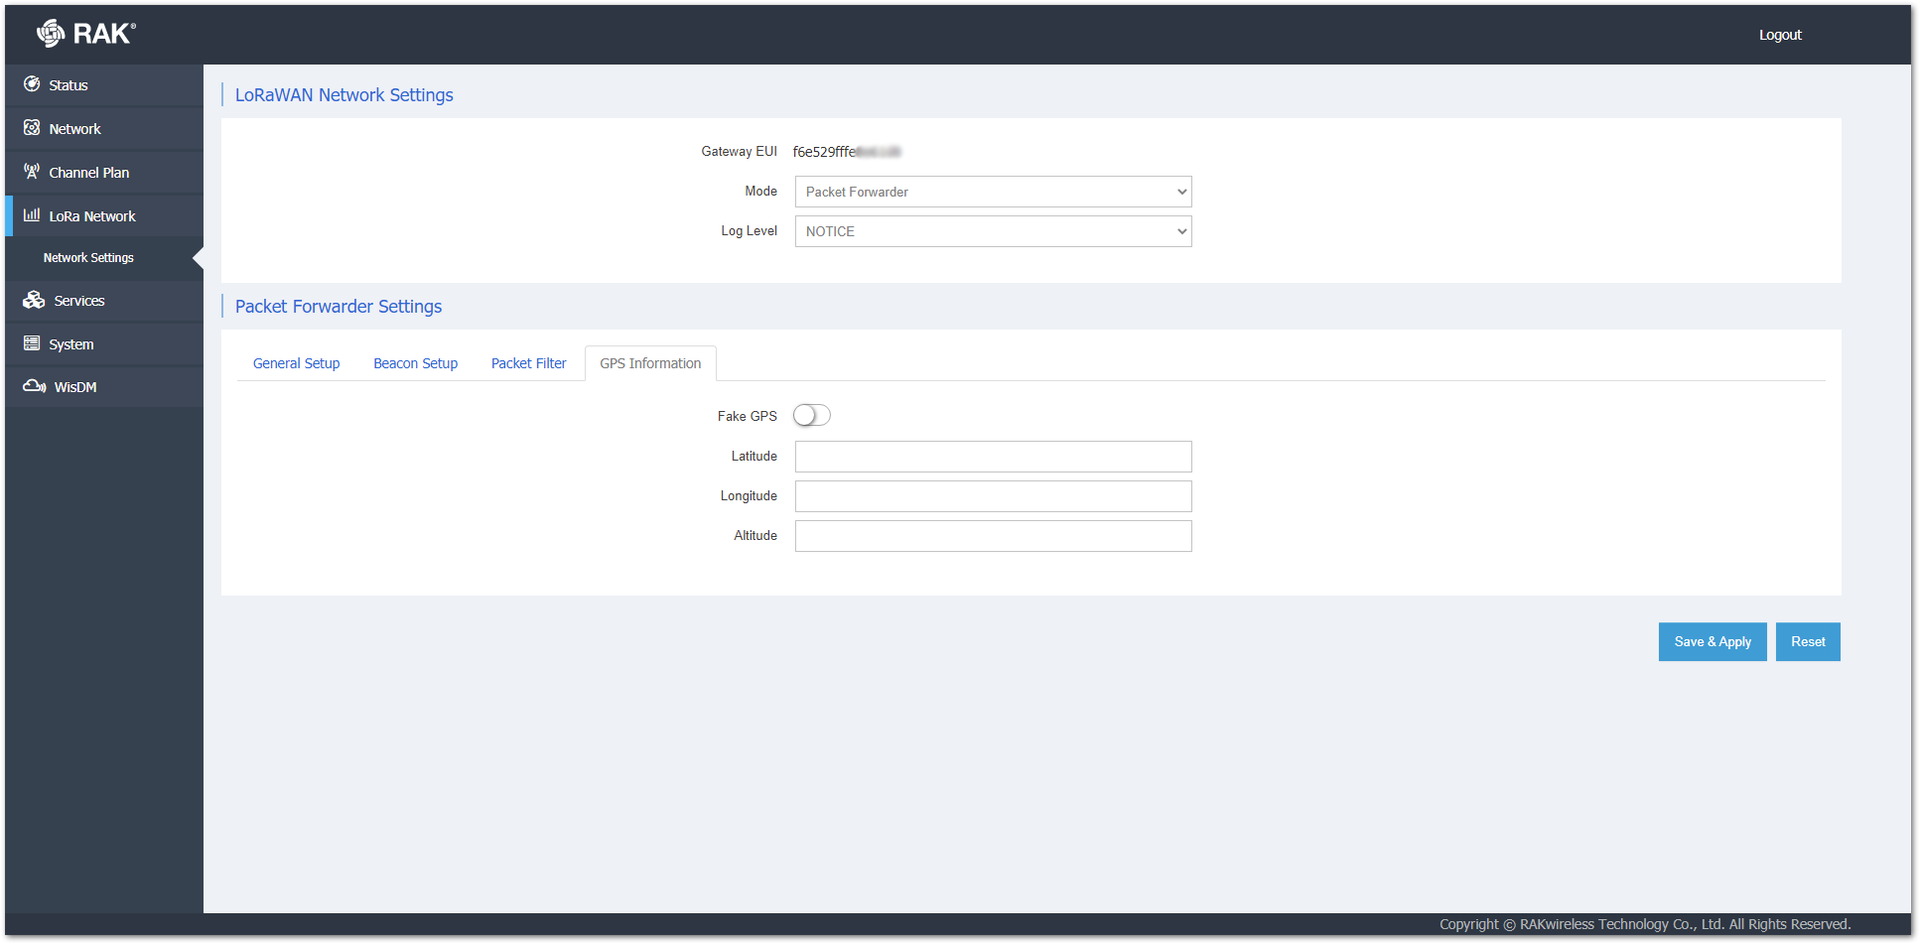 Figure 1: GPS Information Tab
MQTT Bridge Settings
If you choose an MQTT Bridge option in the Protocol field of the General Setup of the Packet Forwarder working mode, a new field with configuration options will pop up below. The Beacon Setup, Packet Filter, and GPS Information tabs stay the same.
- General Setup
- MQTT Broker Address: The IP address of the Gateway where the MQTT Broker is hosted.
- MQTT Broker Port: The corresponding port (default port is 1883).
- MQTT Protocol Version: You can choose between V3.1 and V3.1.1. There is very little difference between them, and you can refer to the document: Differences between 3.1.0 and 3.1.1.
- Client ID: An ID that is used to associate with the topic. If the field is left empty, a random one will be generated.
- Clean Session: When this function is enabled, the Broker will not store any subscription information or undelivered messages.
- Will Retain: When this function is enabled, the last message published will be retained.
- Qos: You can set the desired Quality of Service level.
- keepalive: The keepalive interval is in seconds. Default is 10.
- Enable User Authentication: This function enables Encryption of the transmitted data. You need to configure the Certificates used to encrypt the data to secure authentication being performed.
- SSL/TLS Mode: When enabled (disabled by default), you can choose between three modes, CA signed server certificate, Self-signed server certificate, and Self-signed server & client certificate, with their corresponding options.
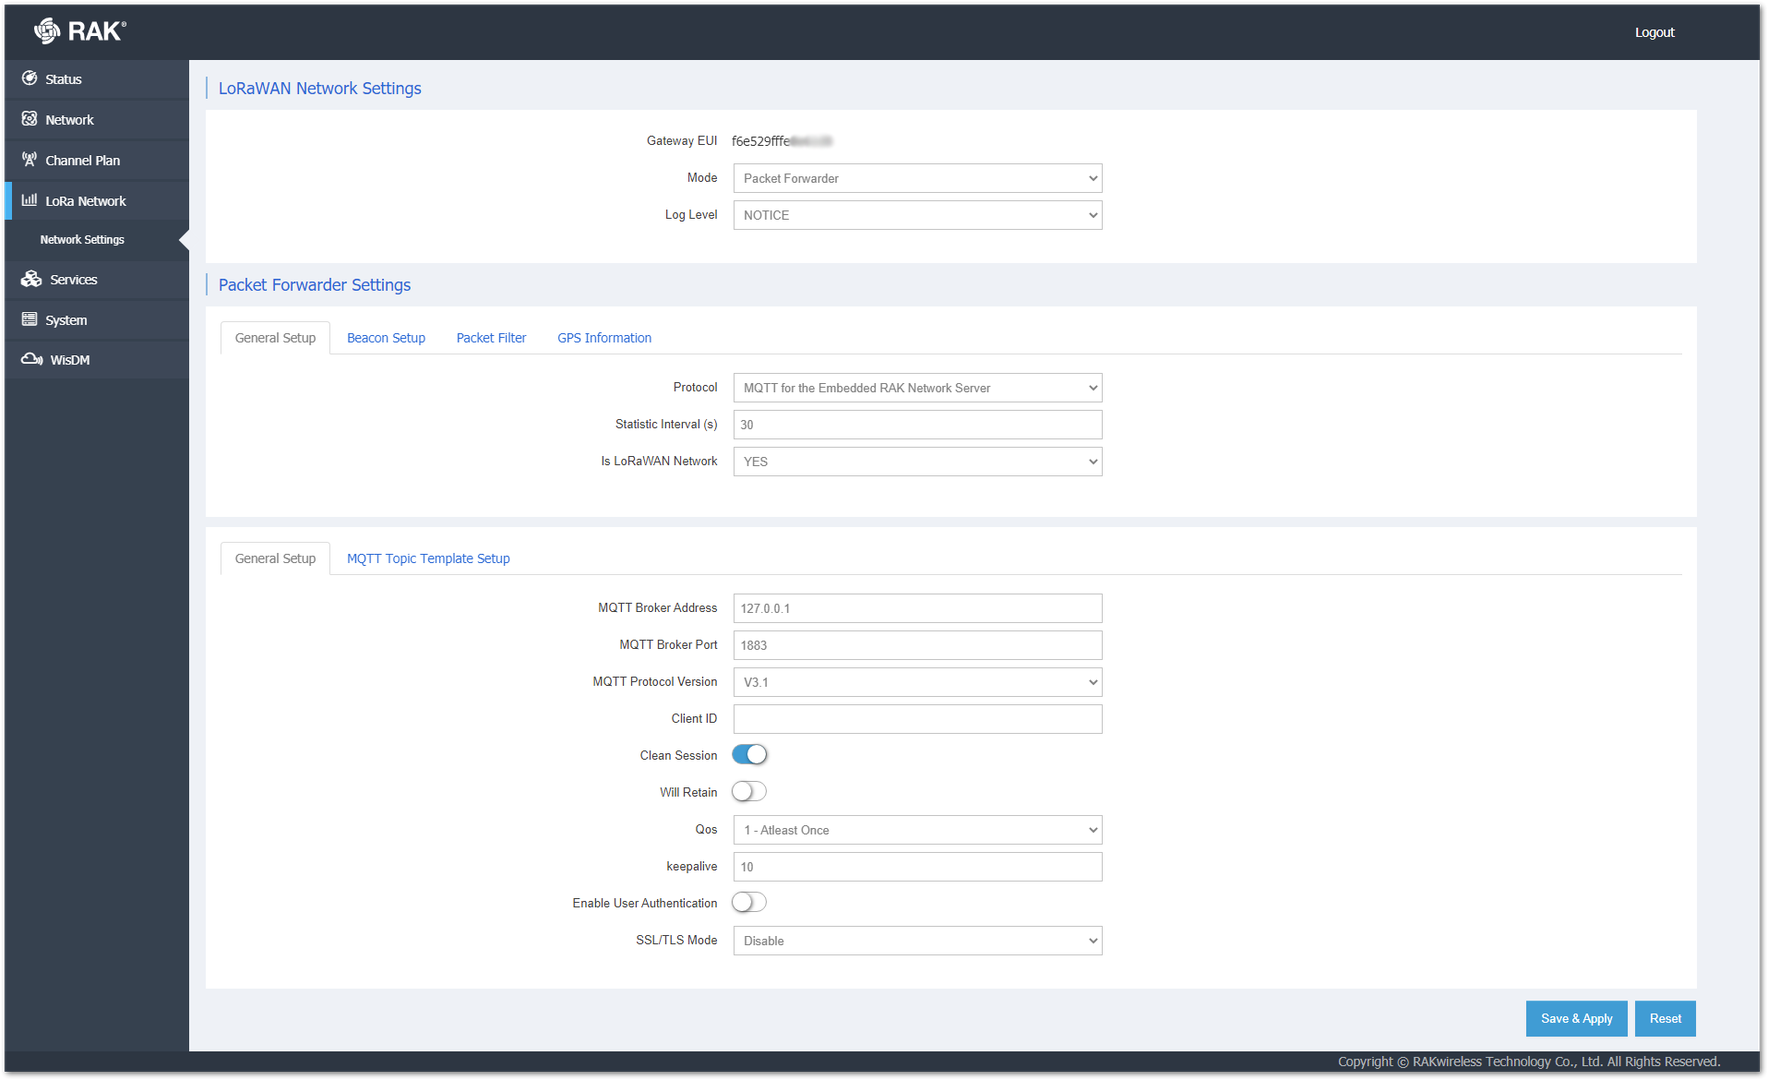 Figure 1: General Setup Tab
- MQTT Topic Template Setup: There are two types of templates, depending on which LoRa Network Server Type you have have chosen.
 Figure 1: ChirpStack 2.x Topic Template
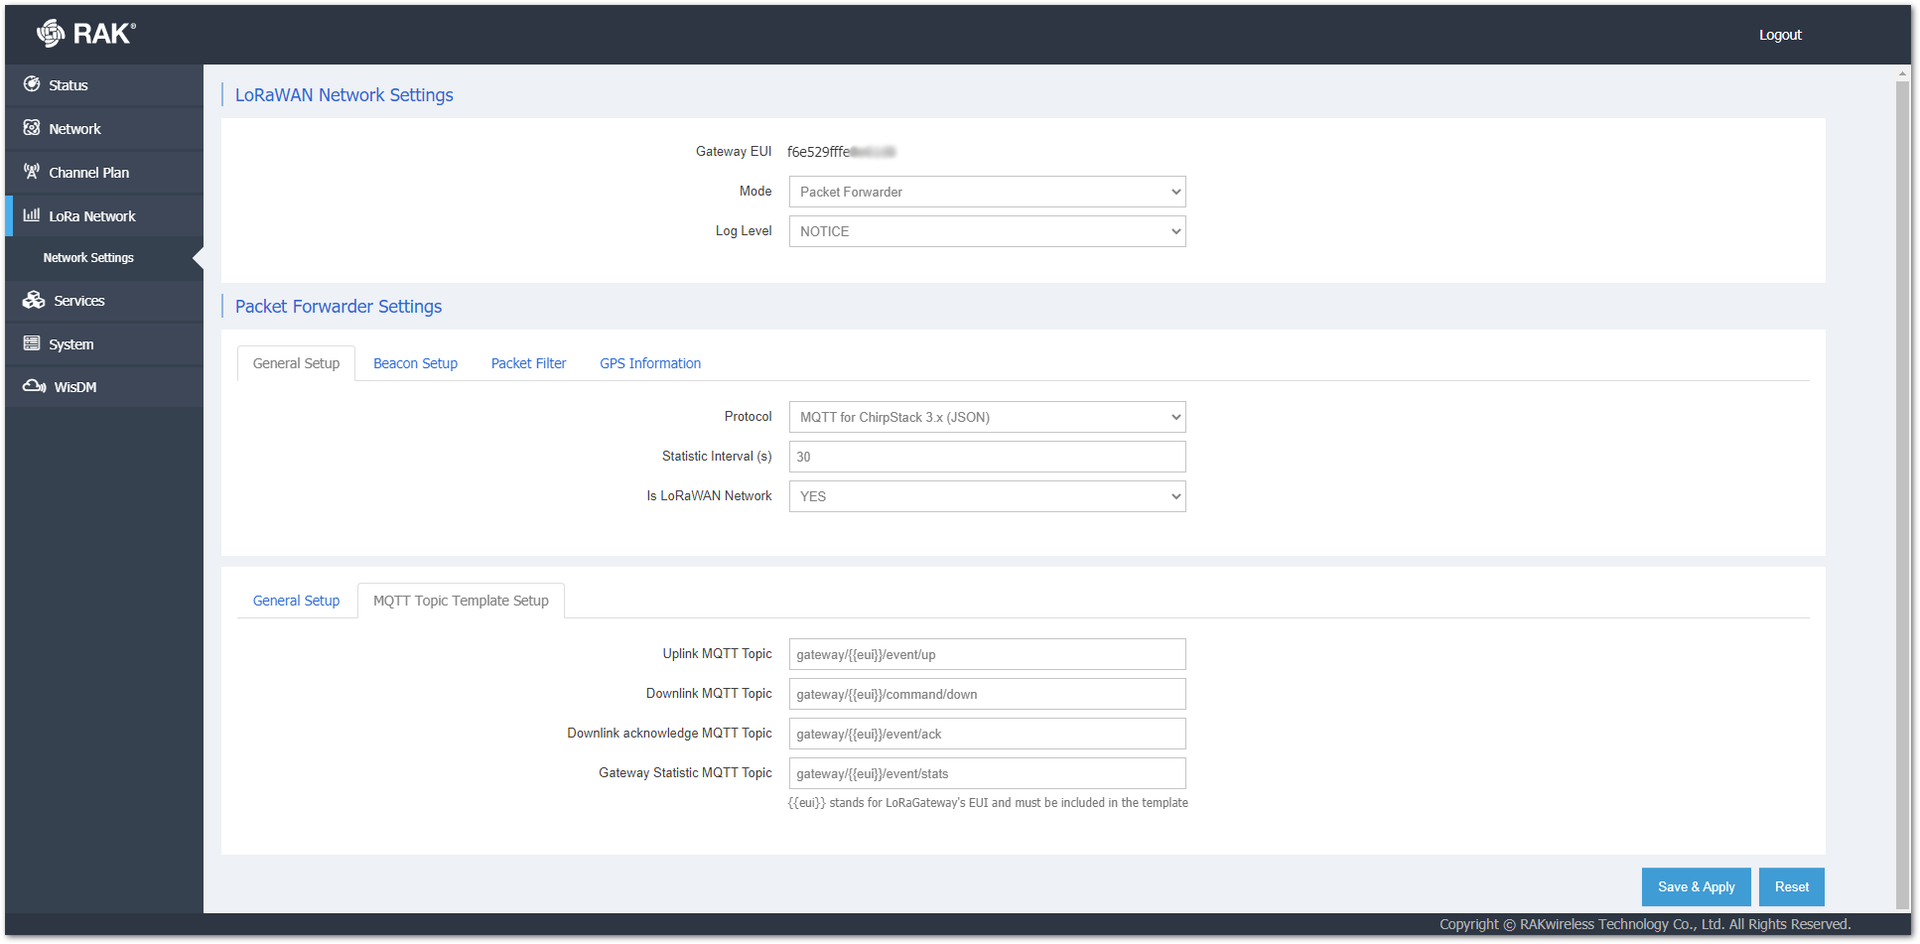 Figure 1: ChirpStack 3.x Topic Template
Basics Station
By choosing this working mode, you can configure the gateway to work as a Basics Station with three options: CUPS Boot Server, CUPS Server, and LNS Server. For further information, refer to the LoRa Basics Station site.
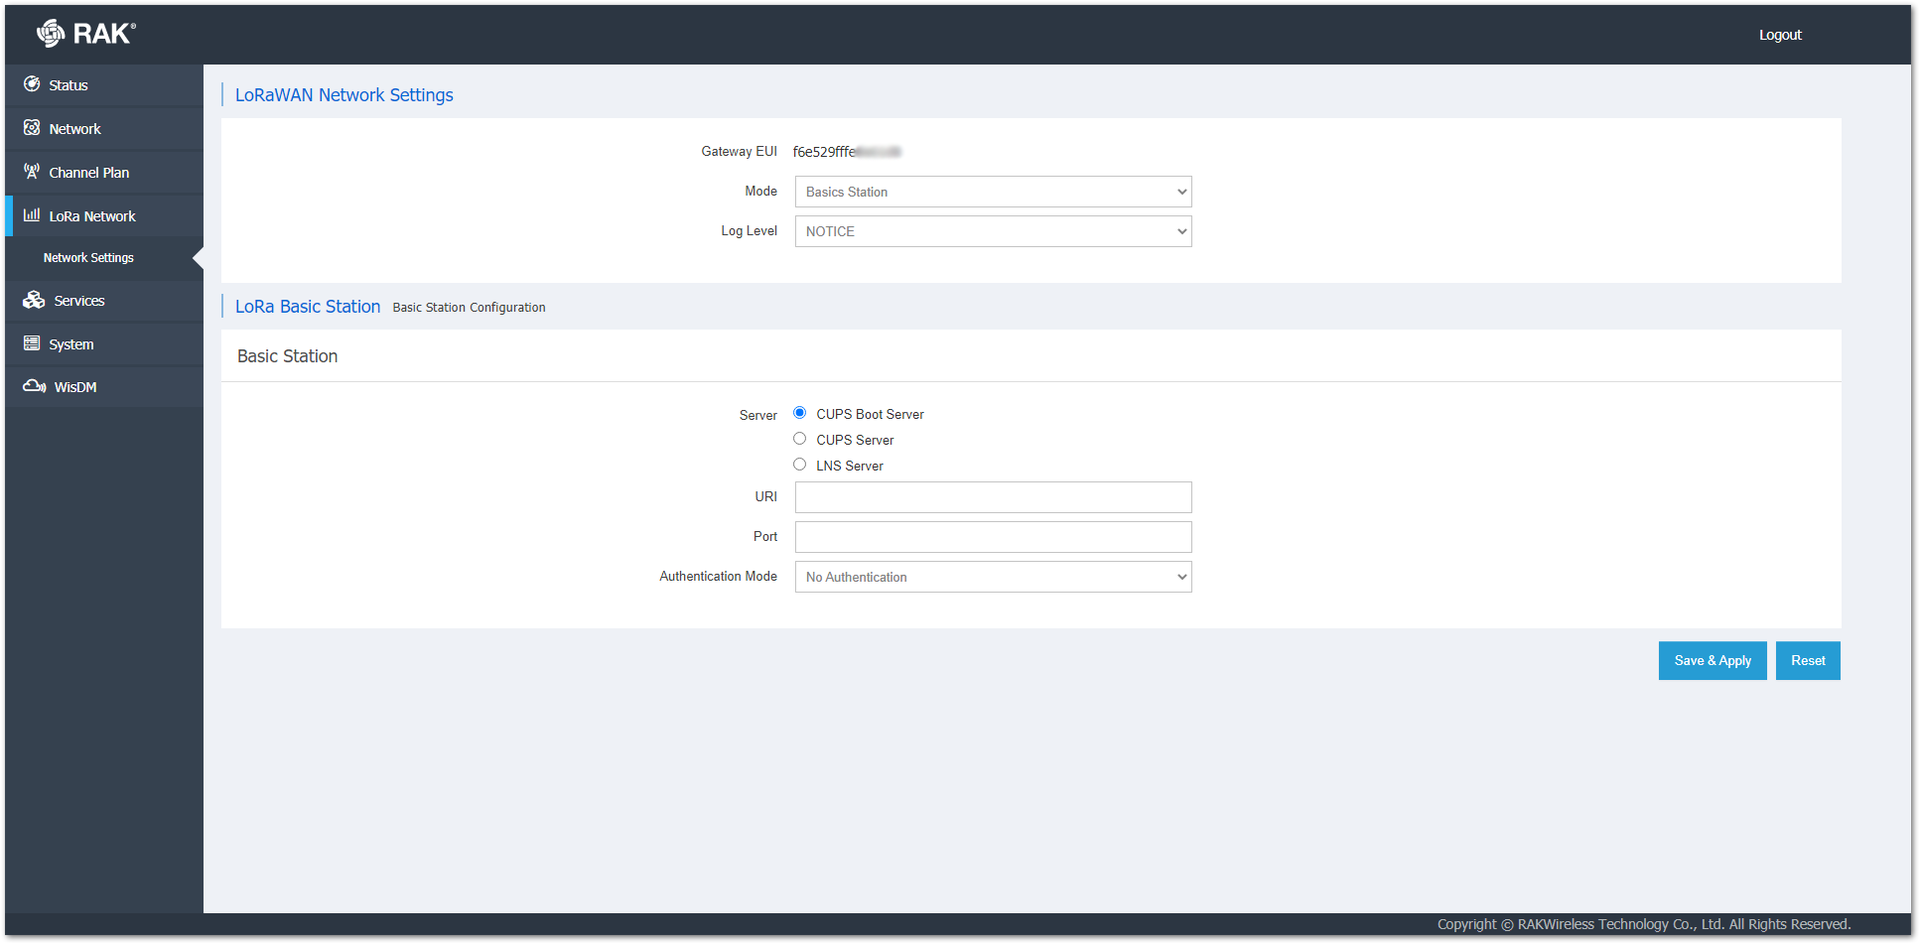 Figure 1: Basics Station Configuration
Each option requires:
- URI: The address of the server to which the gateway is going to connect.
- Port: Corresponding port of the server.
- Authentication Mode: You can choose between the four options with their corresponding fields:
- No Authentication: The server requires no authentication.
- TLS Server Authentication: The server requires a trust file to authenticate.
- TLS Server and Client Authentication: The server requires trust, certificate, and key files for authentication.
- TLS Server Authentication and Client Token: The server requires a trust file and a client token.
Network Server
Network Server is the place where the configuration of the Built-in Network Server are done.
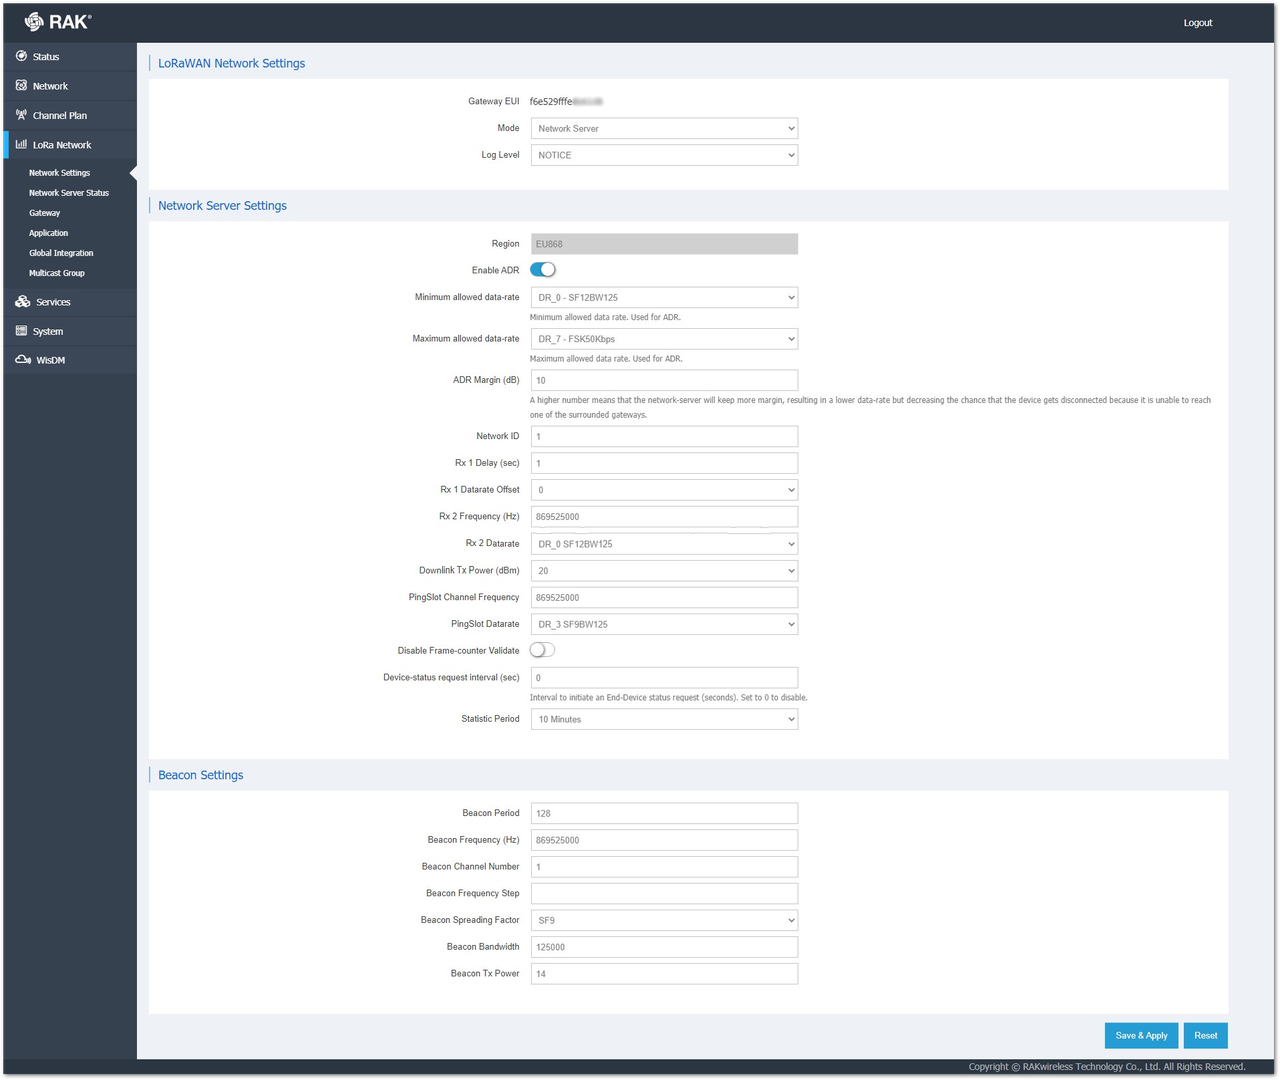 Figure 1: Network Server Configuration
-
Network Server Settings:
- Region: The field only displays the chosen region. It can’t be changed here as this is done in the Channel Plan menu.
- Enable ADR: Enables/disables Adaptive Data Rate.
- Minimum/Maximum Allowed data-rate: DR0 to DR7 can be selected to limit the ADR possible values range. Depends on the Region.
- ADR Margin (dB): Visible only when ADR is enabled. It is a value to keep in dB to make sure that the data rate is not overestimated resulting in poor performance (error rate and range).
- Network ID: A decimal number to distinguish between networks if you deploy multiple ones.
- Rx 1 Delay (sec): The delay of the first receive window in seconds.
- Rx 1 DataRate Offset: This determines the data rate of the downlink frames originating from the gateway for the Rx1 window. By default, it is 0 – identical to the uplink.
- Rx 2 Frequency (Hz): The frequency of the second receive window in Hz.
- Rx 2 Datarate: The Data Rate of the frames to be sent in the second receive window.
- Downlink Tx Power (dBm): This is useful if you want to use a larger antenna with more gain. Values from -6 to 20 are permissible.
- PingSlot Channel Frequency: The frequency used for the PingSlot.
- PingSlot Datarate: The minimum duration of each ping slot.
- Disable Frame-counter Validate: This function turns on/off the Frame counter validation.
- Device-status request interval (sec): This shows how often should the end-devices be polled for their status Log Level.
- Statistic Period: Shows how often the statistics will be gathered.
-
Beacon Setup
- Beacon Period: How often the beacon is broadcasted.
- Beacon Frequency (Hz): The frequency of the beacon.
- Beacon Channel Number: This is the channel number of the beacon.
- Beacon Frequency Step: The frequency step between beacon channels (in Hz).
- Beacon Spreading Factor: The spreading factor of the beacon
- Beacon Bandwidth: The bandwidth the beacon is going to use.
- Beacon Tx Power: This is the transmit power of the beacon.
For a detailed tutorial on how to configure your gateway when using either LNS or CUPS server, refer to LNS and CUPS Configuration documentation.
Network Server Status
A dedicated page of the Built-in Network Server. The data is displayed in tables and graphs.
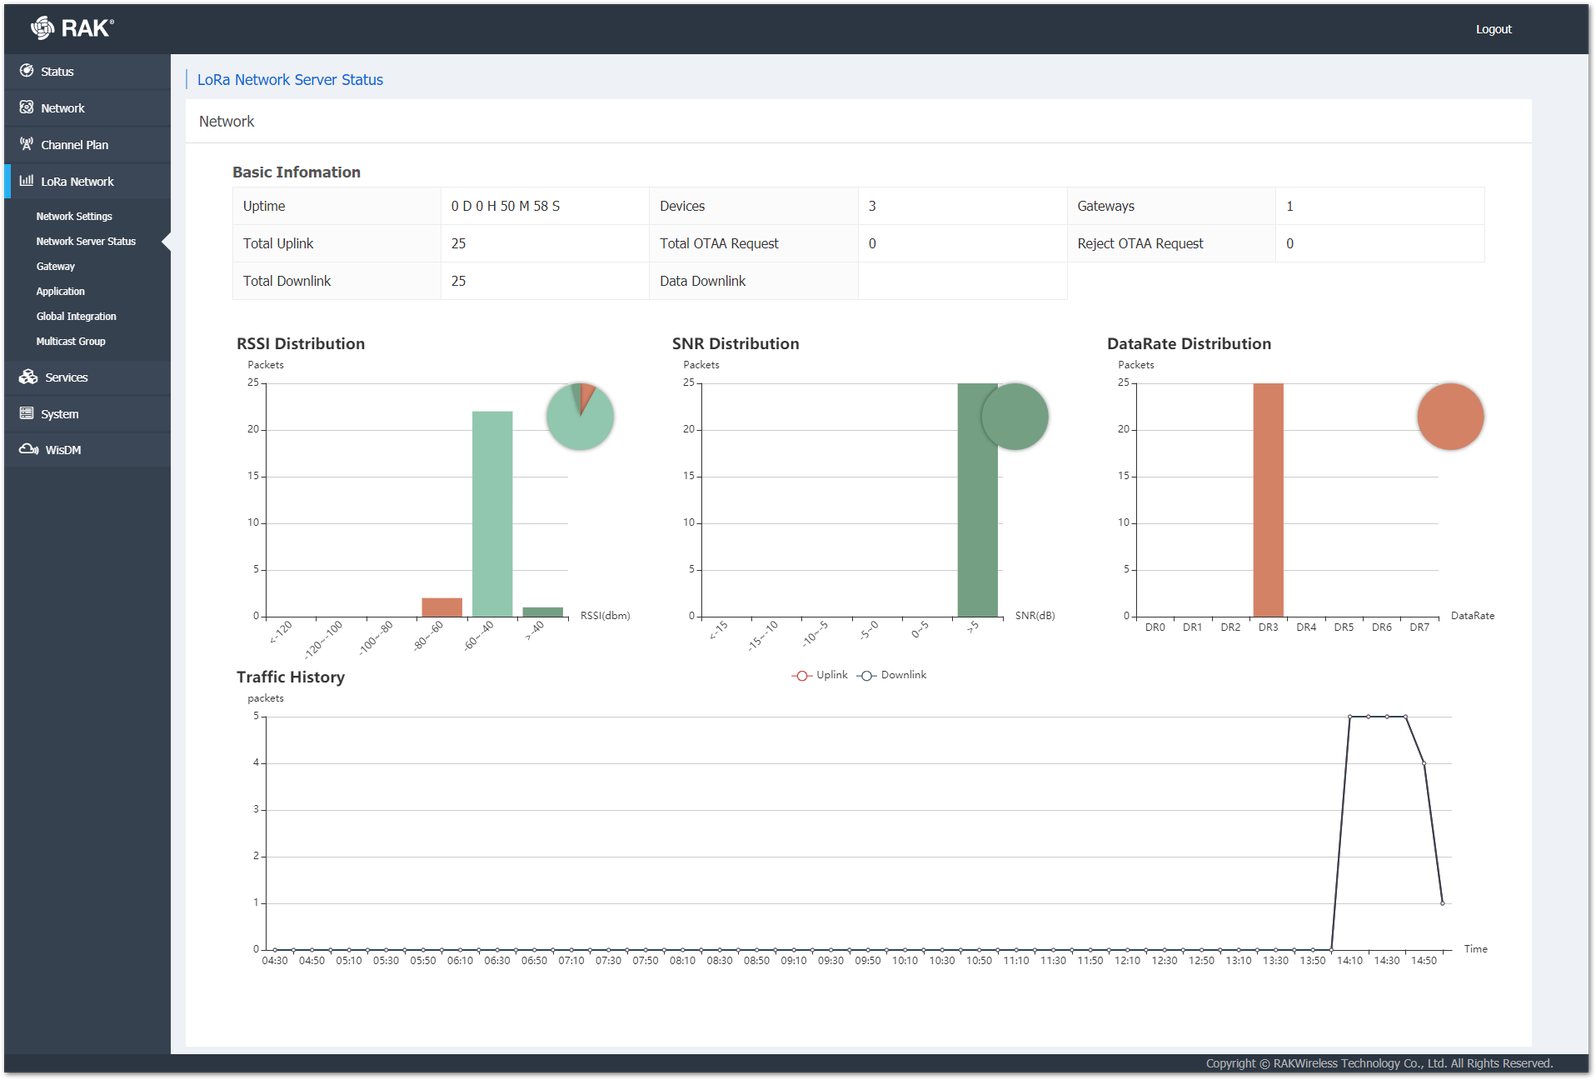 Figure 1: Network Server Status Page
-
Basic Information
- Uptime: The time the Built-in Server has been working without interruption.
- Devices: The total amount of end-devices that are currently authenticated with the server.
- Gateways: The total amount of gateways that are forwarding frames to the server.
- Total Uplink: The total uplink frames processed.
- Total Downlink: The total downlinks frames transmitted.
- Data Downlink: The total downlink frames that carry data (non-services).
- Total OTAA Requests: The total authentication requests submitted by end-nodes.
- Rejected OTAA Request: The total authentication requests that were rejected.
- Data Downlink: The data that is sent by the gateway.
-
RSSI Distribution: This graph reflects the RSSI in increments of 20 dBm starting from -120 dBm and going up to -40 dBm. You can get an idea of how many of the total packets received fall within a certain RSSI level.
-
SNR Distribution: This graph reflects the SNR in increments of 5 dB starting from -15 dB and going up to 5 dB. You can get an idea of how many of the total packets received fall within a certain SNR level.
-
DataRate Distribution: The percentage of packets that have a certain Data Rate (DR0 to DR7)
-
Traffic History: A general graph reflecting the amount of traffic in packets versus time.
Gateway
In this tab, you can add external gateways to work with the LoRa Network Server. The current gateway doesn’t need to be added as the Network Server is working on it. Fill in the EUI of the gateway you want to add and click the Add button.
- General Setup
- MQTT Broker Address: The IP address of the machine where the MQTT Broker is hosted (default is
127.0.0.1for the built-in one). - MQTT Broker Port: The corresponding port (default port is 1883).
- MQTT Protocol Version: You can choose between V3.1 and V3.1.1. There is very little difference between them, and you can refer to the document: Differences between 3.1.0 and 3.1.1.
- Client ID: An ID that is used to associate with the topic. If the field is left empty, a random one will be generated.
- Clean Session: When this function is enabled, the Broker will not store any subscription information or undelivered messages.
- Will Retain: When this function is enabled, the last message published will be retained.
- Qos: You can set the desired Quality of Service level.
- keepalive: The keepalive interval in seconds (10 default).
- Enable User Authentication: This function enables Encryption of the transmitted data. You need to configure the Certificates used to encrypt the data to secure authentication being performed.
- SSL/TLS Mode: When enabled (disabled by default), you can choose between three modes CA signed server certificate, Self-signed server certificate, and Self-signed server & client certificate, with their corresponding options.
- MQTT Broker Address: The IP address of the machine where the MQTT Broker is hosted (default is
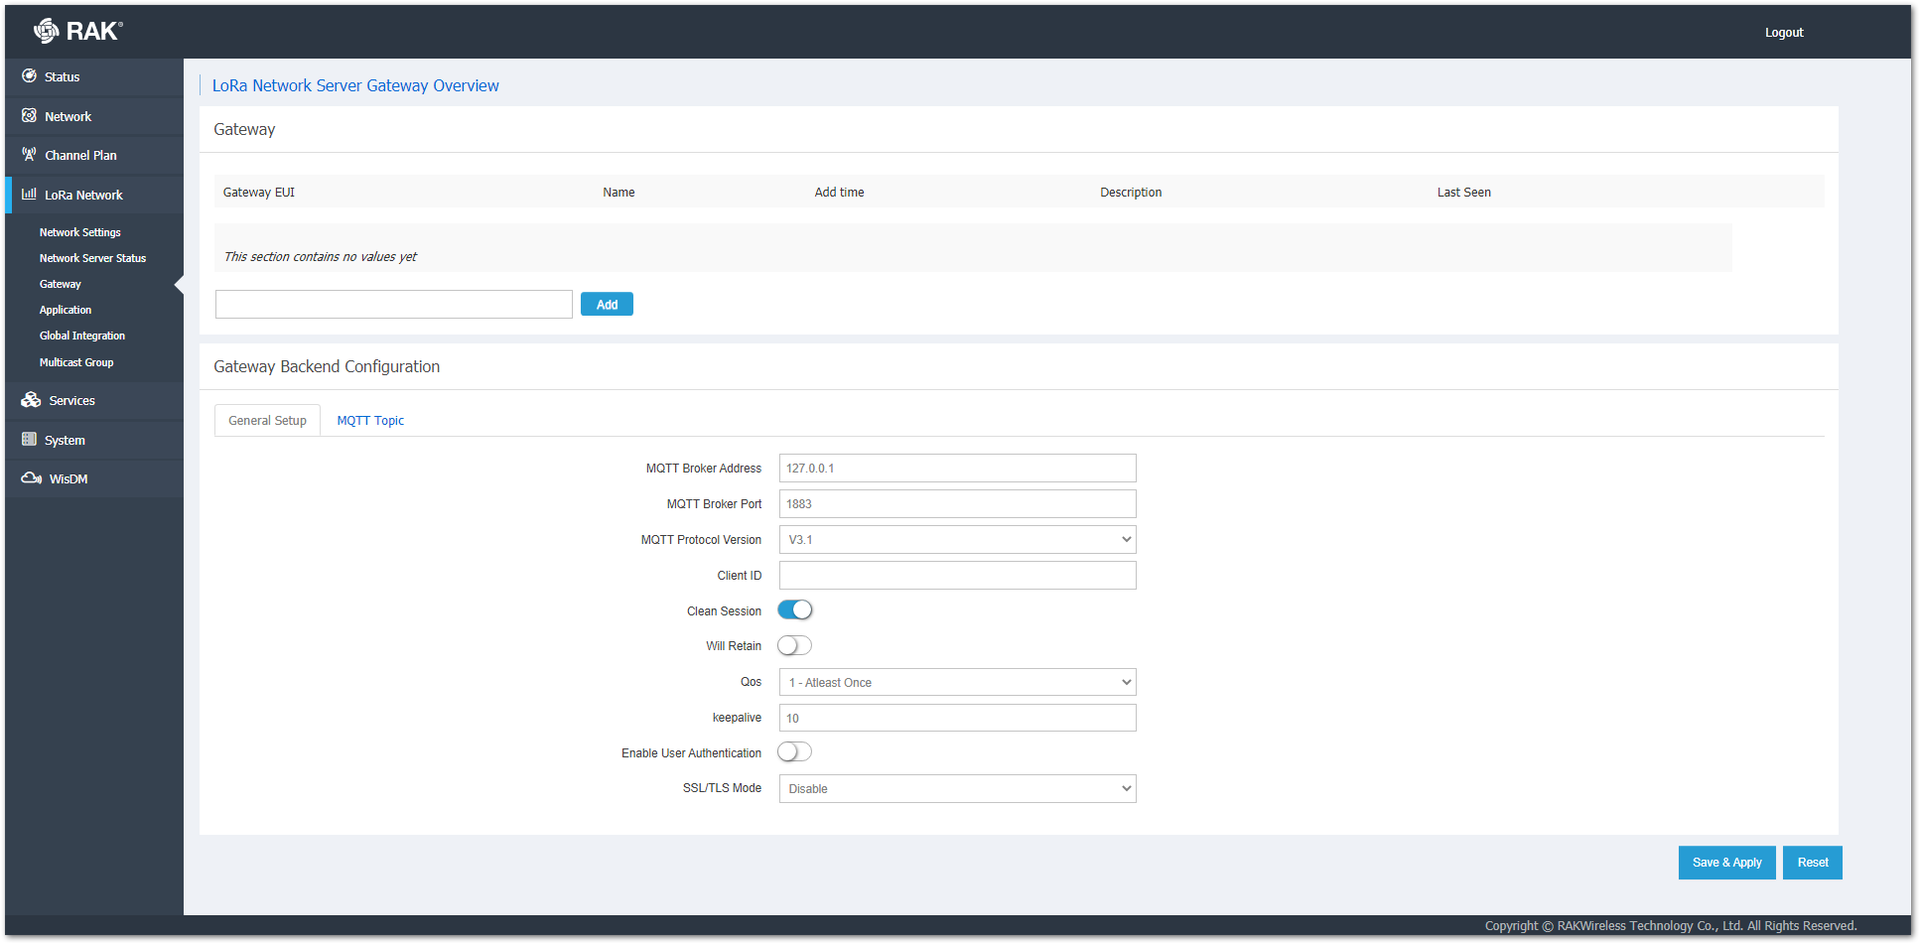 Figure 1: General Setup Tab
- MQTT Topic: Here, the topic templates can be found.
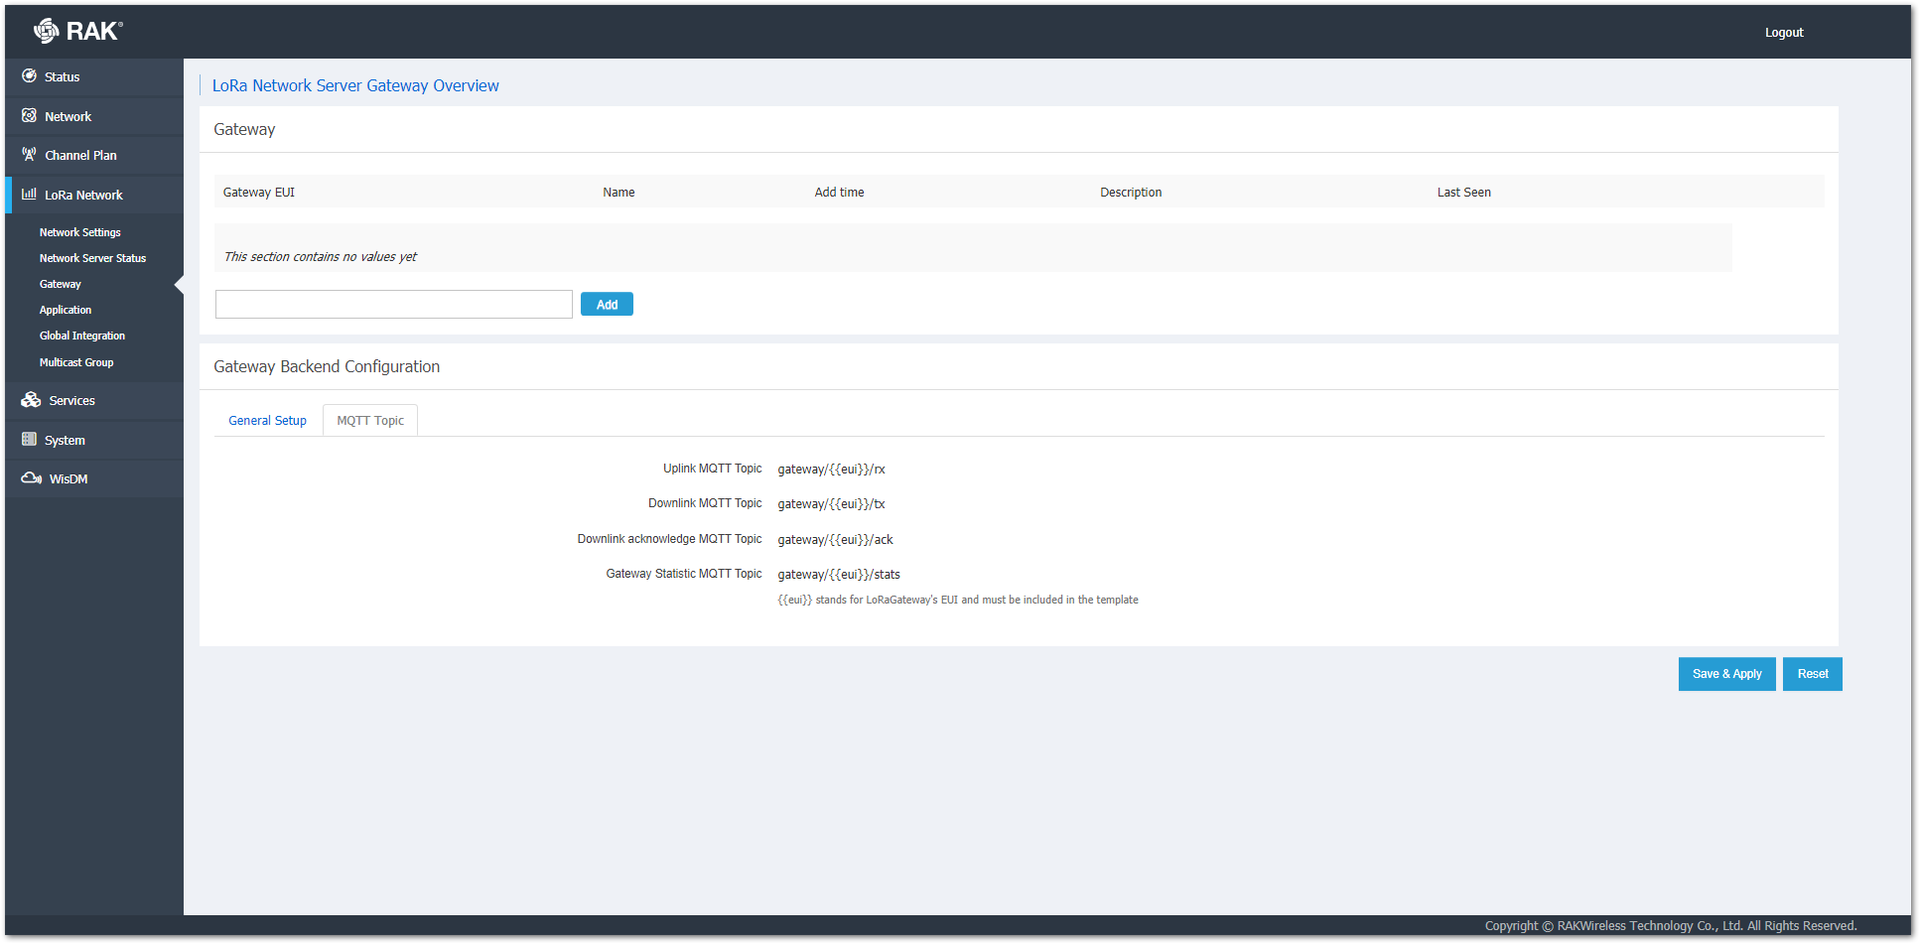 Figure 1: MQTT Topic Tab
Application
Here, an application where a device can be registered and decrypt its data payload can be created. By default, there will be no created Applications.
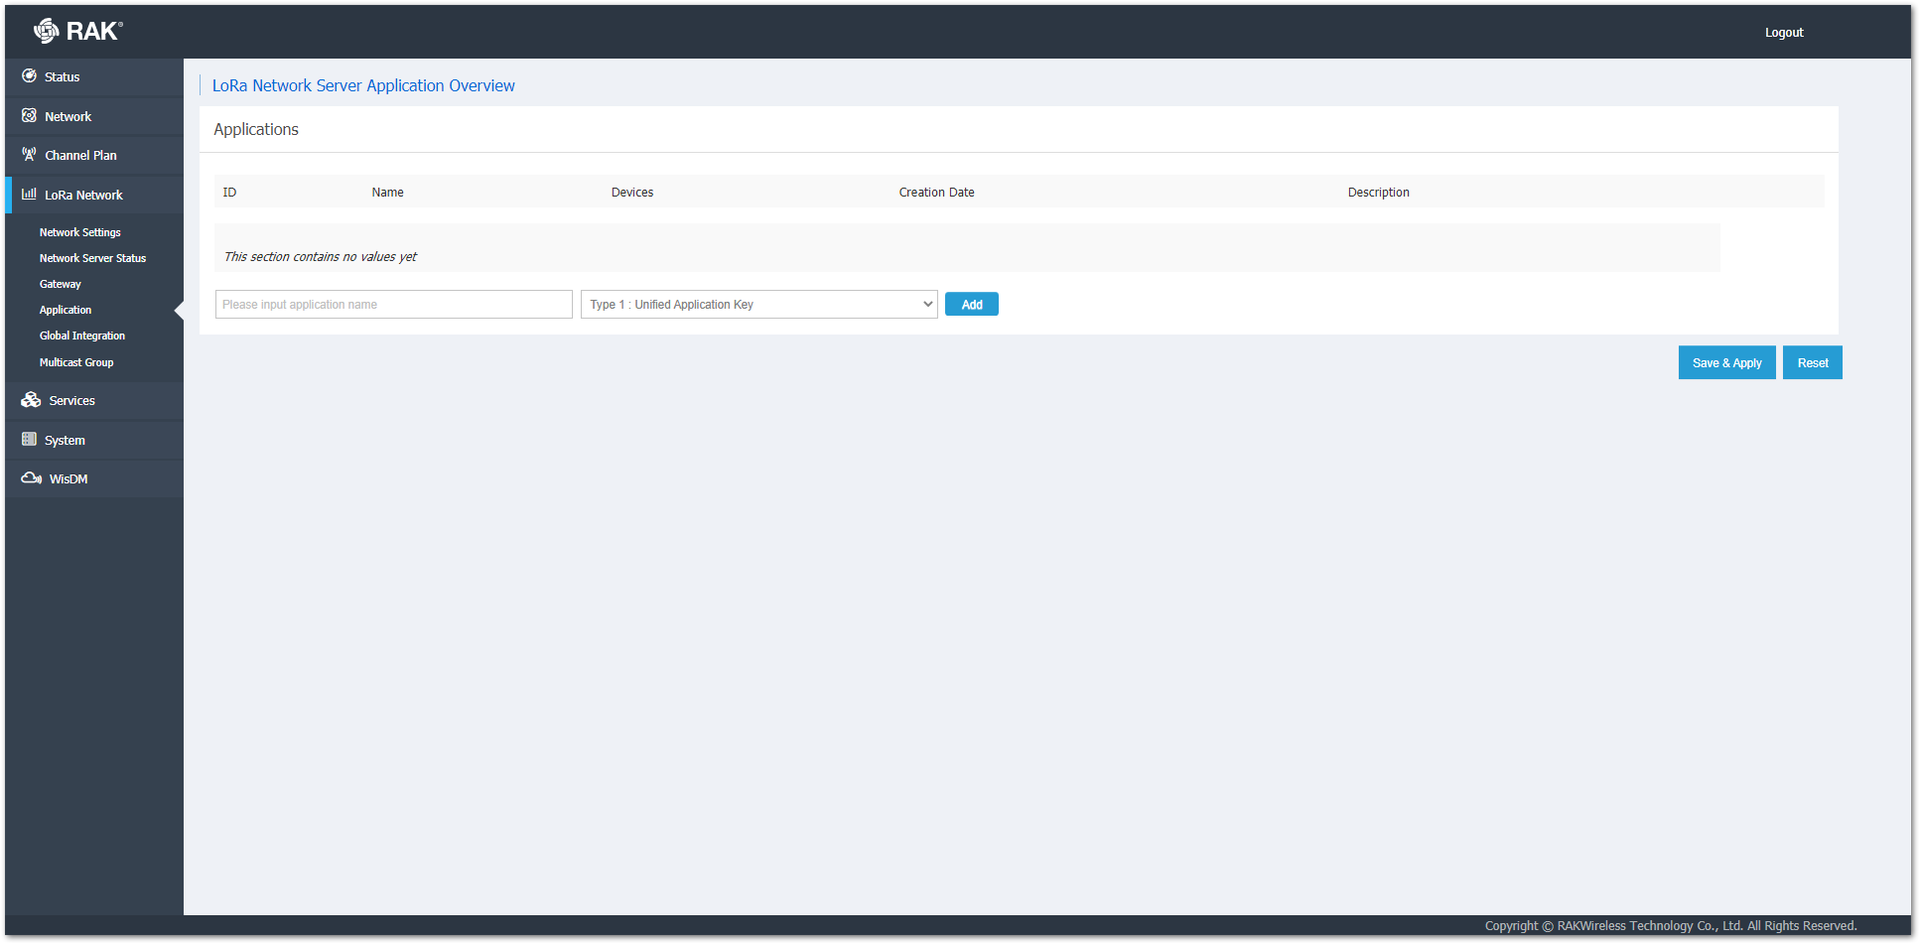 Figure 1: Application Page
To create an Application, type the name of the application in the name field, choose one of the options in the Type drop-down menu, and click the Add button.
If there are any created applications, they will be shown as a list with the option to access and edit them.
Global Integration
In this section, you can do an integration of the Built-in LoRa Application Server with an External MQTT Broker. Depending on the chosen Integration Mode, the set of options change.
- Generic MQTT mode:
- MQTT Broker Address: The IP address of the machine where the MQTT Broker is hosted (default is
127.0.0.1for the built-in one). - MQTT Broker Port: The corresponding port (default port is 1883).
- MQTT Protocol Version: You can choose between V3.1 and V3.1.1. There is very little difference between them, and you can refer to the document: Differences between 3.1.0 and 3.1.1.
- Client ID: An ID that is used to associate with the topic. If the field is left empty, a random one will be generated.
- Clean Session: When this function is enabled, the Broker will not store any subscription information or undelivered messages.
- Will Retain: When this function is enabled, the last message published will be retained.
- Qos: You can set the desired Quality of Service level.
- keepalive: The keepalive interval in seconds (10 default).
- Enable User Authentication: This function enables Encryption of the transmitted data. You need to configure the Certificates used to encrypt the data to secure authentication being performed.
- SSL/TLS Mode: When enabled (disabled by default), you can choose between three modes CA signed server certificate, Self-signed server certificate, and Self-signed server & client certificate, with their corresponding options.
- Join/Uplink/Downlink/Ack/Topic/Status/Multicast Downlink Topics: MQTT Templates of the Topics. These are just templates the topics should not be changed.
- MQTT Broker Address: The IP address of the machine where the MQTT Broker is hosted (default is
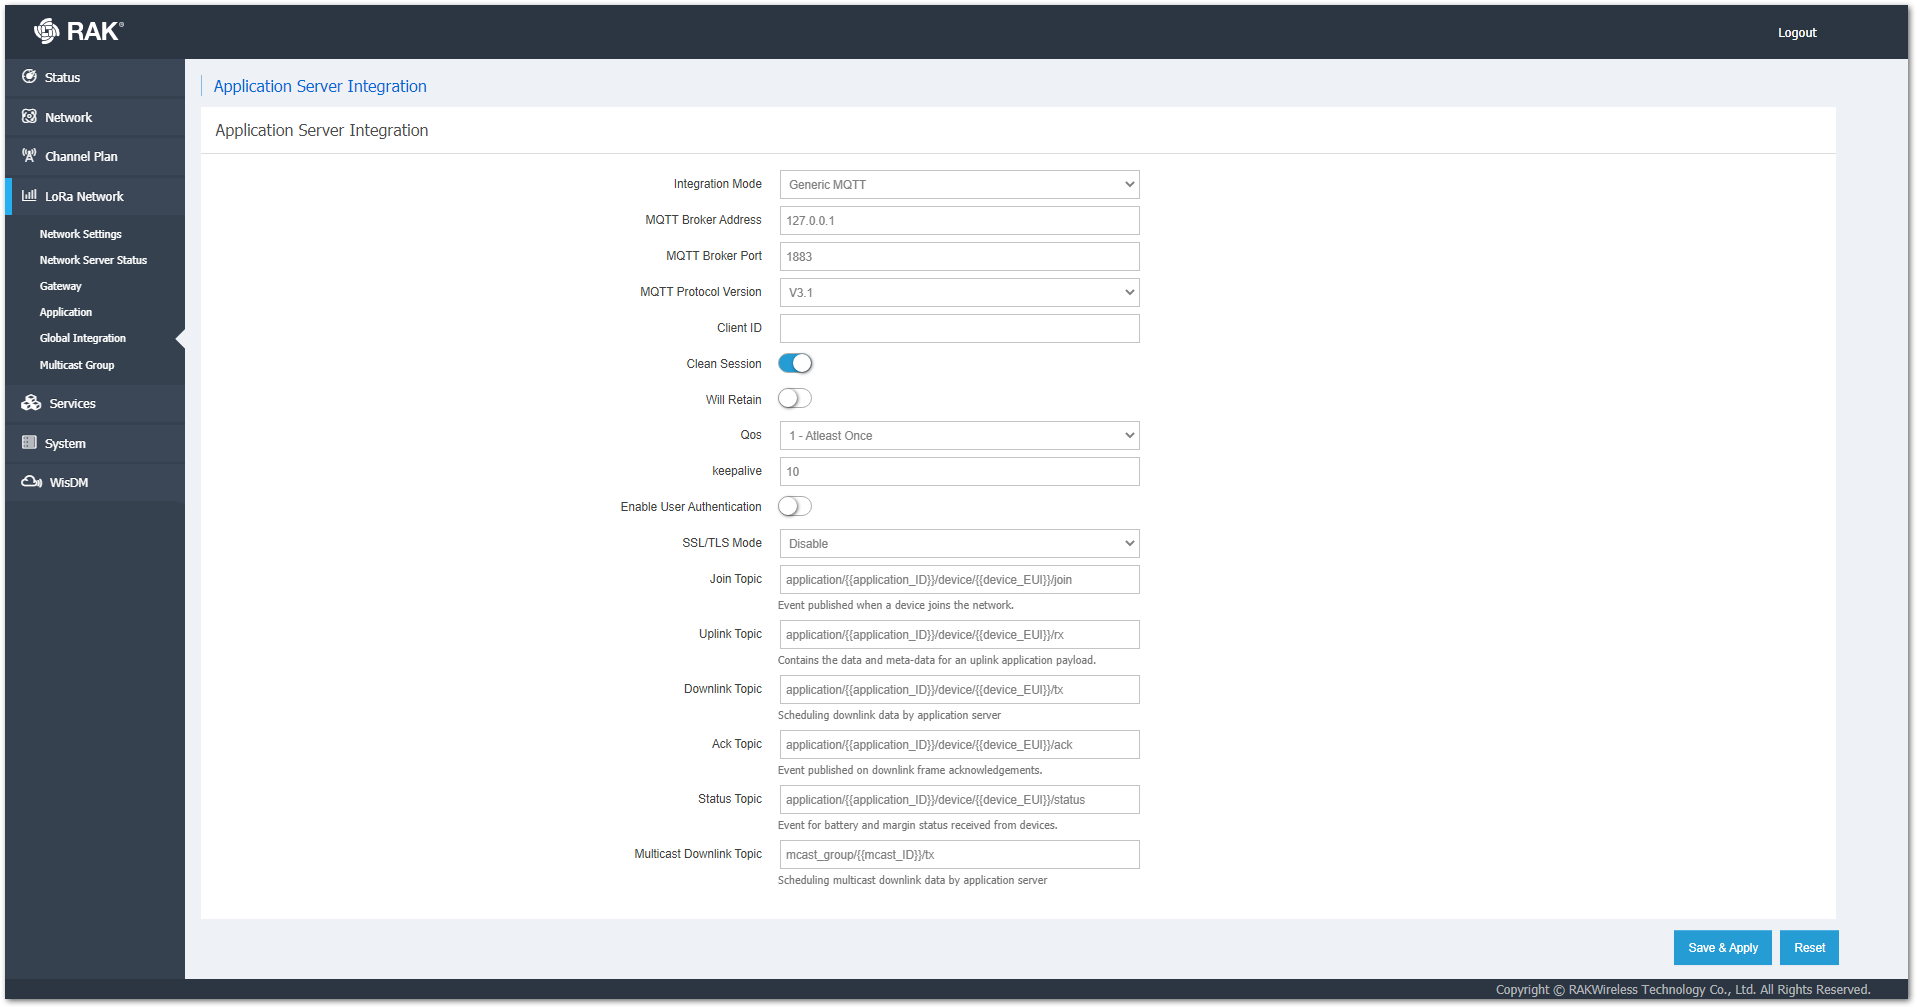 Figure 1: Generic MQTT Mode Settings
- AWS IoT Core mode:
- AWS URL: The address of the AWS.
- AWS Port: The corresponding port of the server.
- CA Certificate: CA certificate provided by the AWS IoT Core.
- Vendor Certificate: Certificate for the gateway, generated by AWS IoT Core.
- Vendor Key: Private key for the gateway, generated by AWS IoT Core.
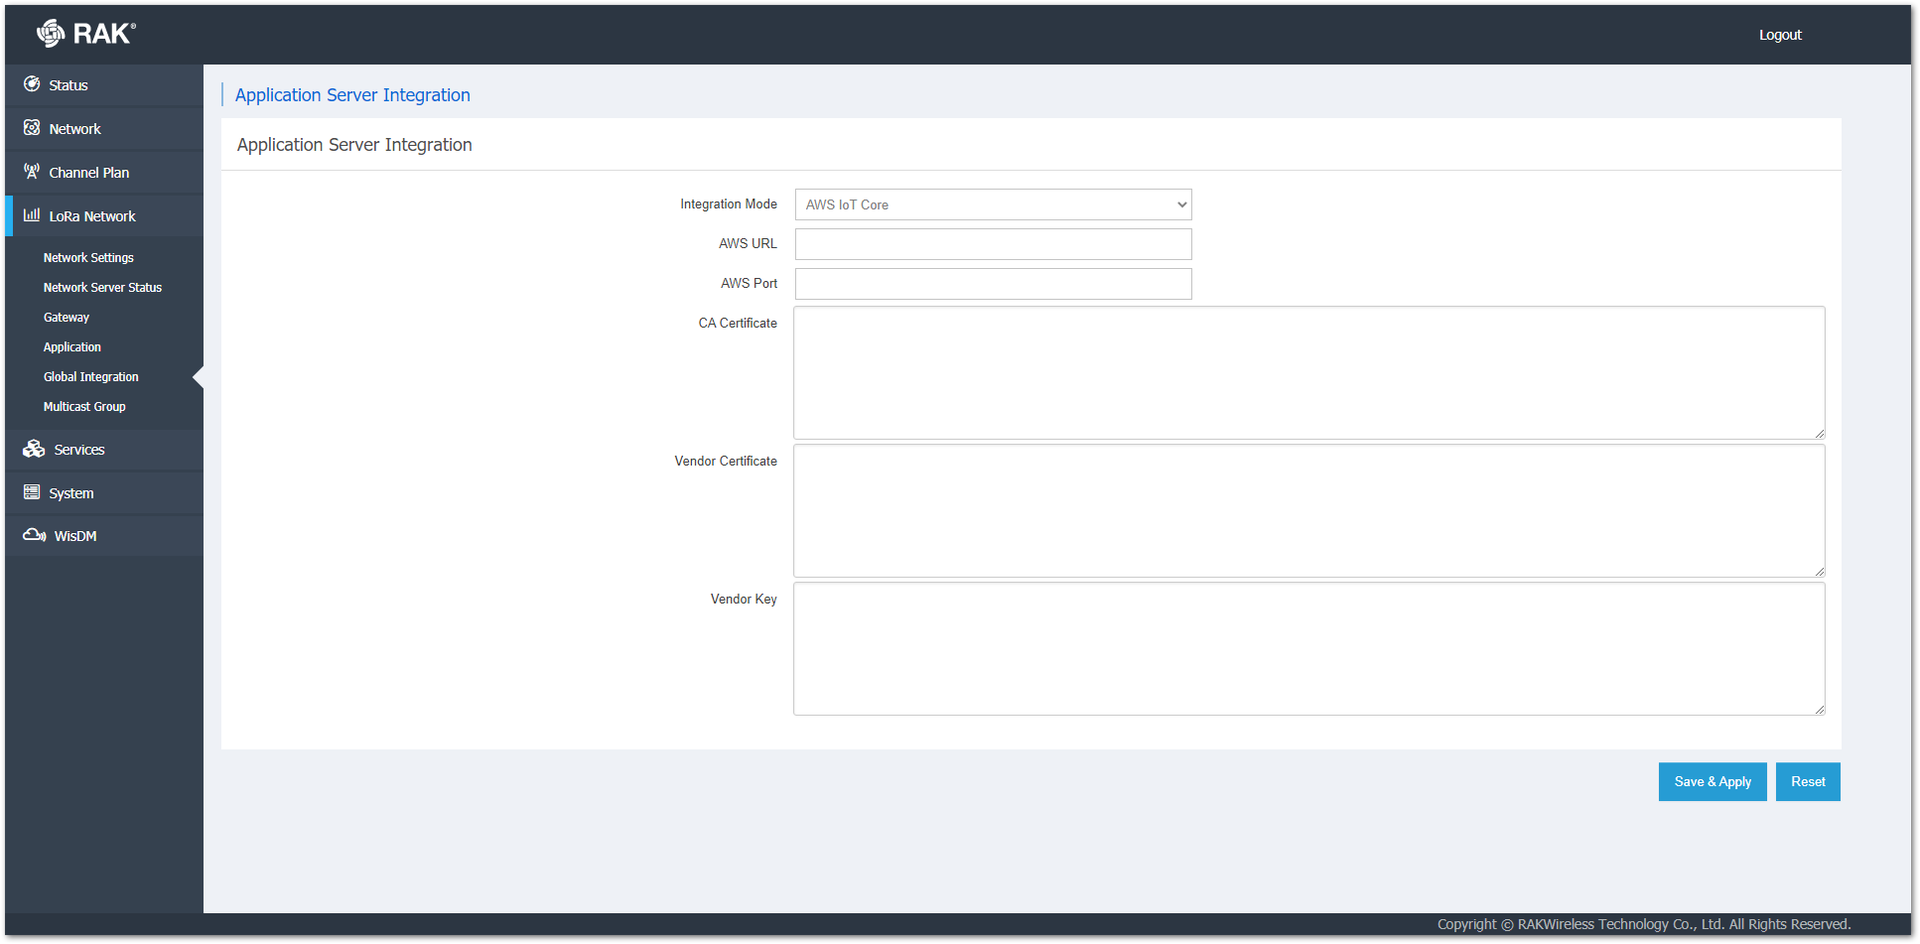 Figure 1: AWS IoT Core Mode Settings
For a detailed tutorial on how to configure your gateway when using either LNS or CUPS server, refer to Global Integration documentation.
Multicast Group
Here, you have the option to create and manage multicast groups of nodes to use for bulk-action downlinks.
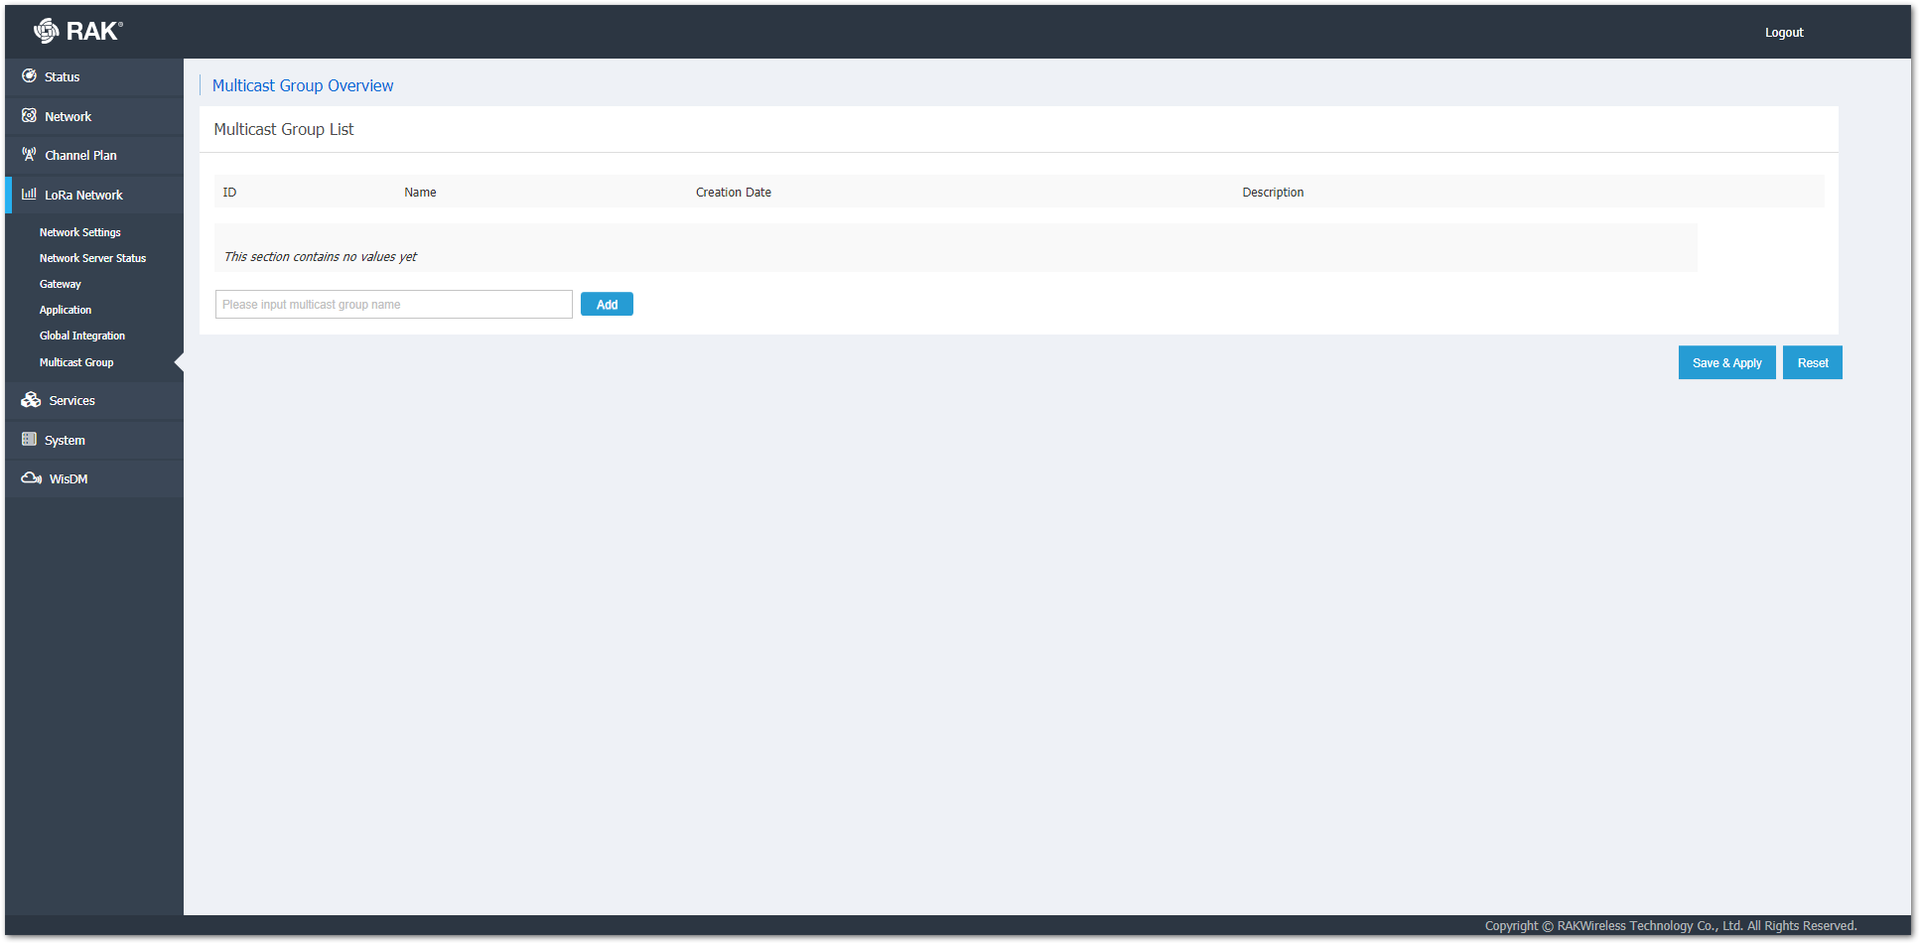 Figure 1: Multicast Group Page
To create a Multicast Group, type the name of it in the name field and click the Add button. If there are any created groups, they will be shown as a list with the option to access and edit them.
Services��
Dynamic DNS (Beta)
In this section, you can configure the DDNS. Dynamic DNS (DDNS) allows the gateway to be reached via a fixed hostname while having a dynamically changing IP address.
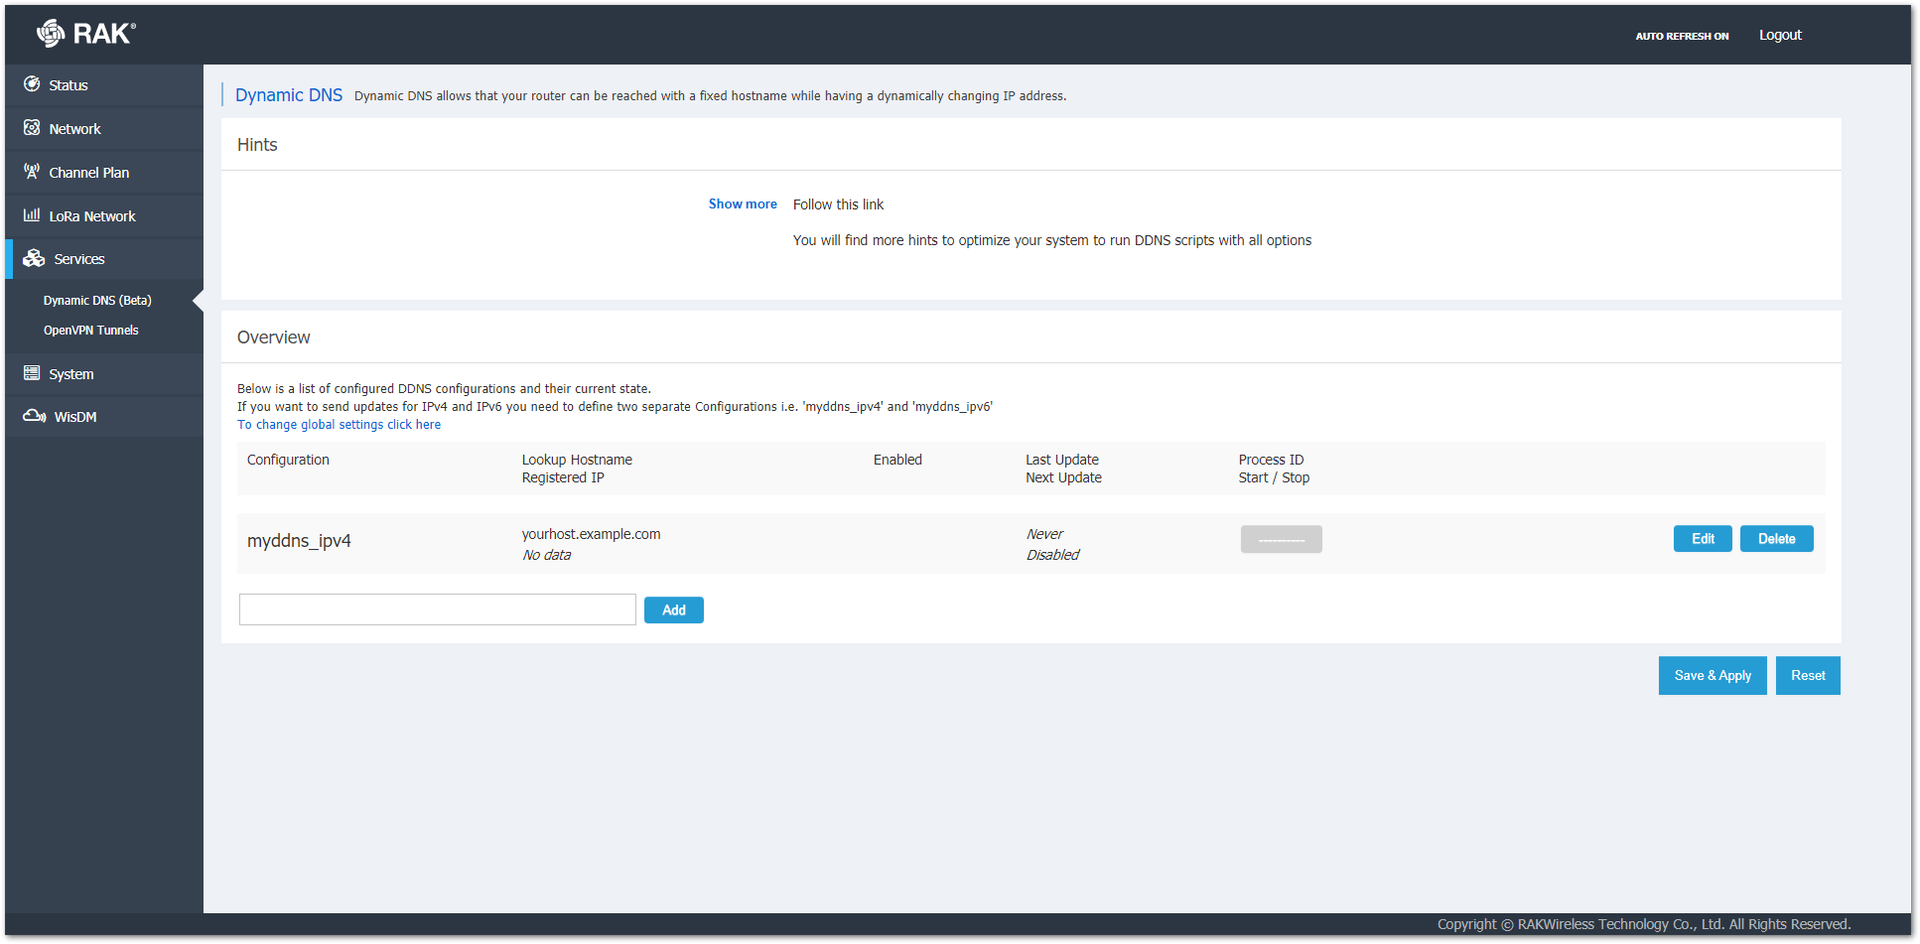 Figure 1: Dynamic DNS (Beta) Page
-
Hints: The Show more clickable text shows hints on how to configure the Dynamic DNS. A detailed tutorial on how to configure DDNS can be found in the Knowledge Hub.
-
Overview: You can change the global settings by pressing the text To change global settings click here. This will affect DDNS as a whole (both IPv4 and IPv6, for example).
If you want to have separate settings/rules for IPv4/IPv6, you need to define two sets, one for each. This can be done by filling in a name in the text box and pressing the Add button.
An IPv4 example is created by default. You can configure its parameters by pressing the Edit button.
For a detailed tutorial on how to configure the DDNSe to access the gateway, refer to Configuring DDNS documentation.
OpenVPN Tunnels
This section shows you how to create a VPN tunnel.
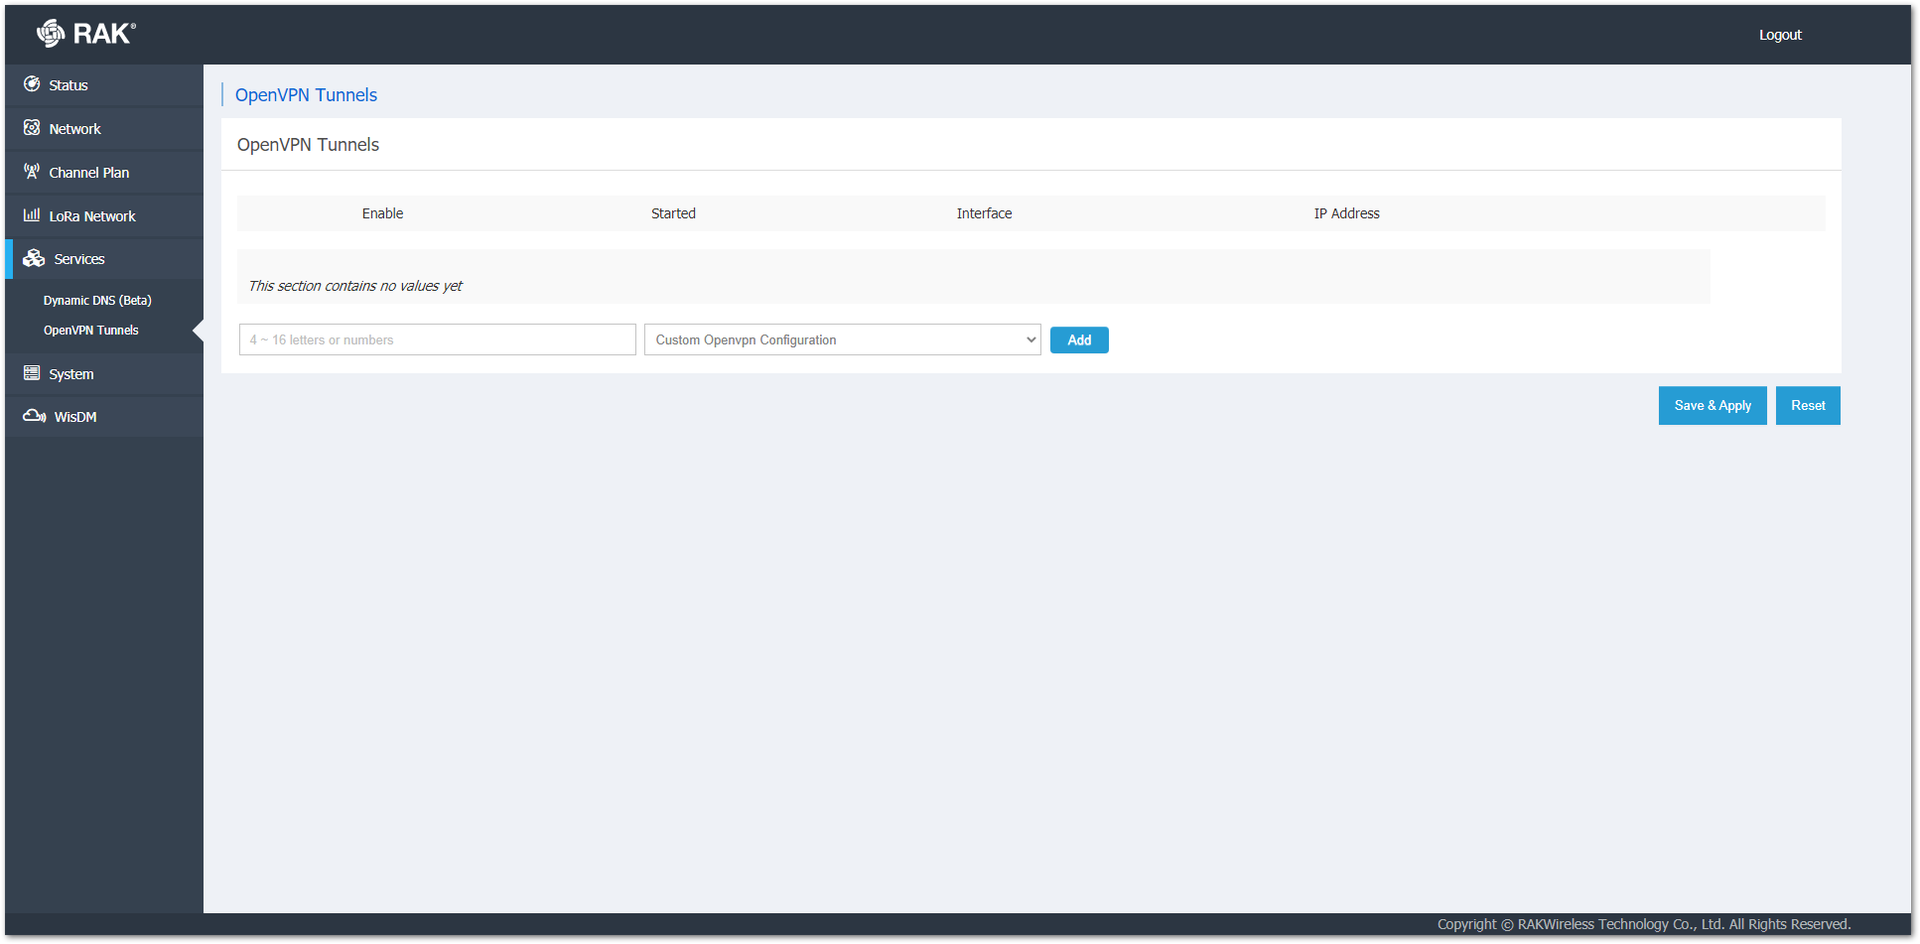 Figure 1: OpenVPN Tunnels Page
To create a tunnel, type a name for the Custom Openvpn Configuration and click on the Add button. Then you will be directed to the following page:
- Configuration: You must type the certificates for the OpenVPN.
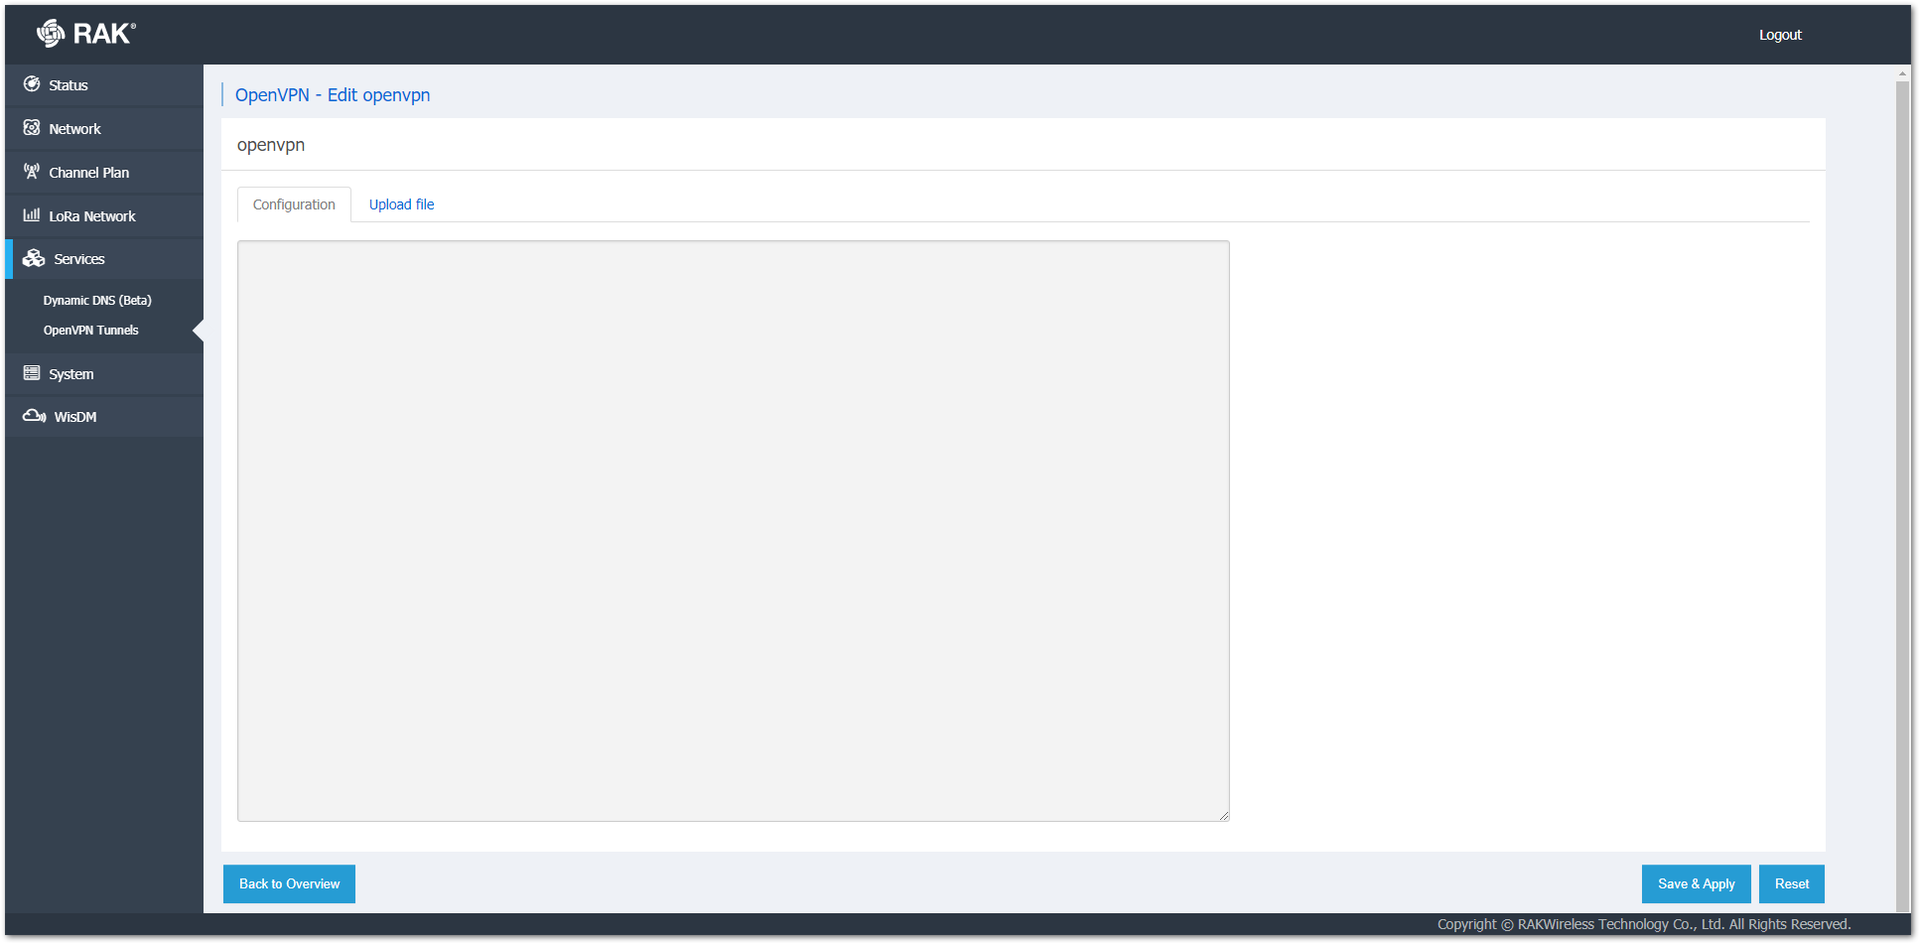 Figure 1: Configuration Tab
- Upload file: Instead of manually typing the certificate, you can upload the certificates from file.
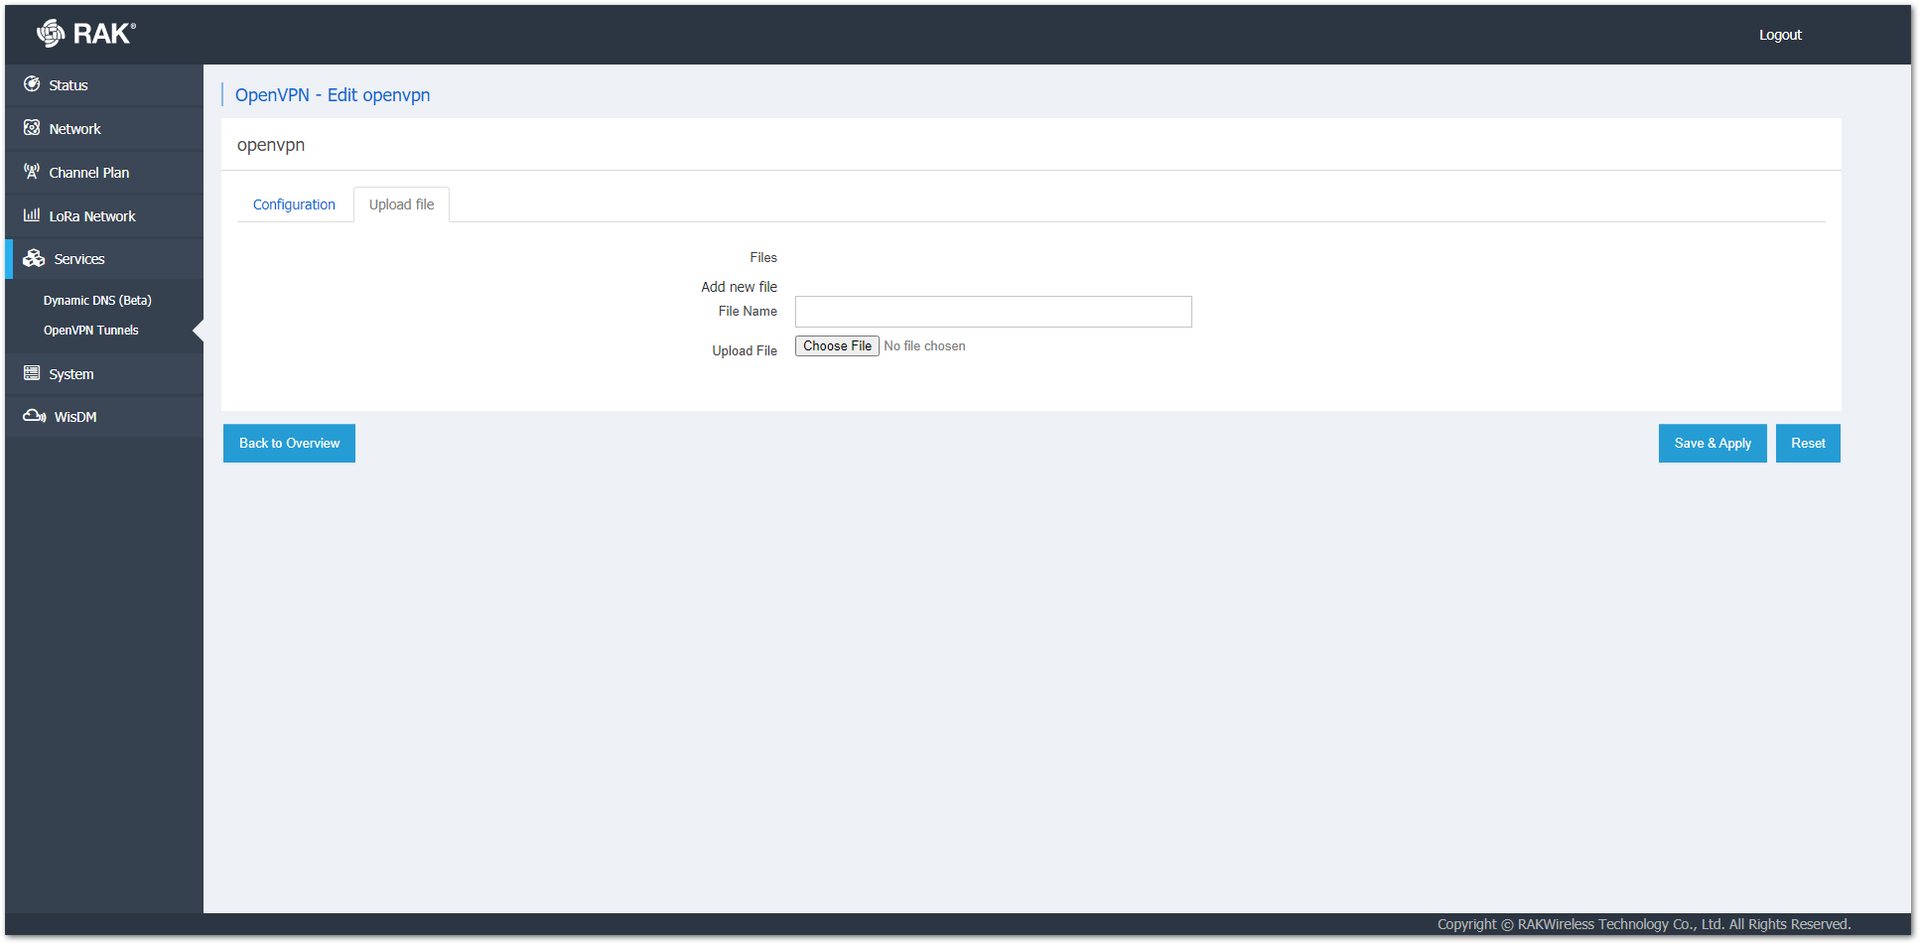 Figure 1: Upload File Tab
For a detailed tutorial in the configuring the OpenVIP, refer to OpenVPN Configuration documentation.
System
In this section, you can configure the basic aspects of the device like its Hostname or Timezone.
-
System Properties
-
General Settings: You can set the Local Time. By clicking the Sync with browser button, you can sync the internal clock of the gateway with the time of the browser.
-
Hostname: The name of the gateway. You can change it to a desired one.
-
Timezone: The time-zone of the gateway. It is a good practice to set it to the time zone of your location for synchronization (Default is UTC). Syncing the clock of the gateway is good for monitoring and debugging.
-
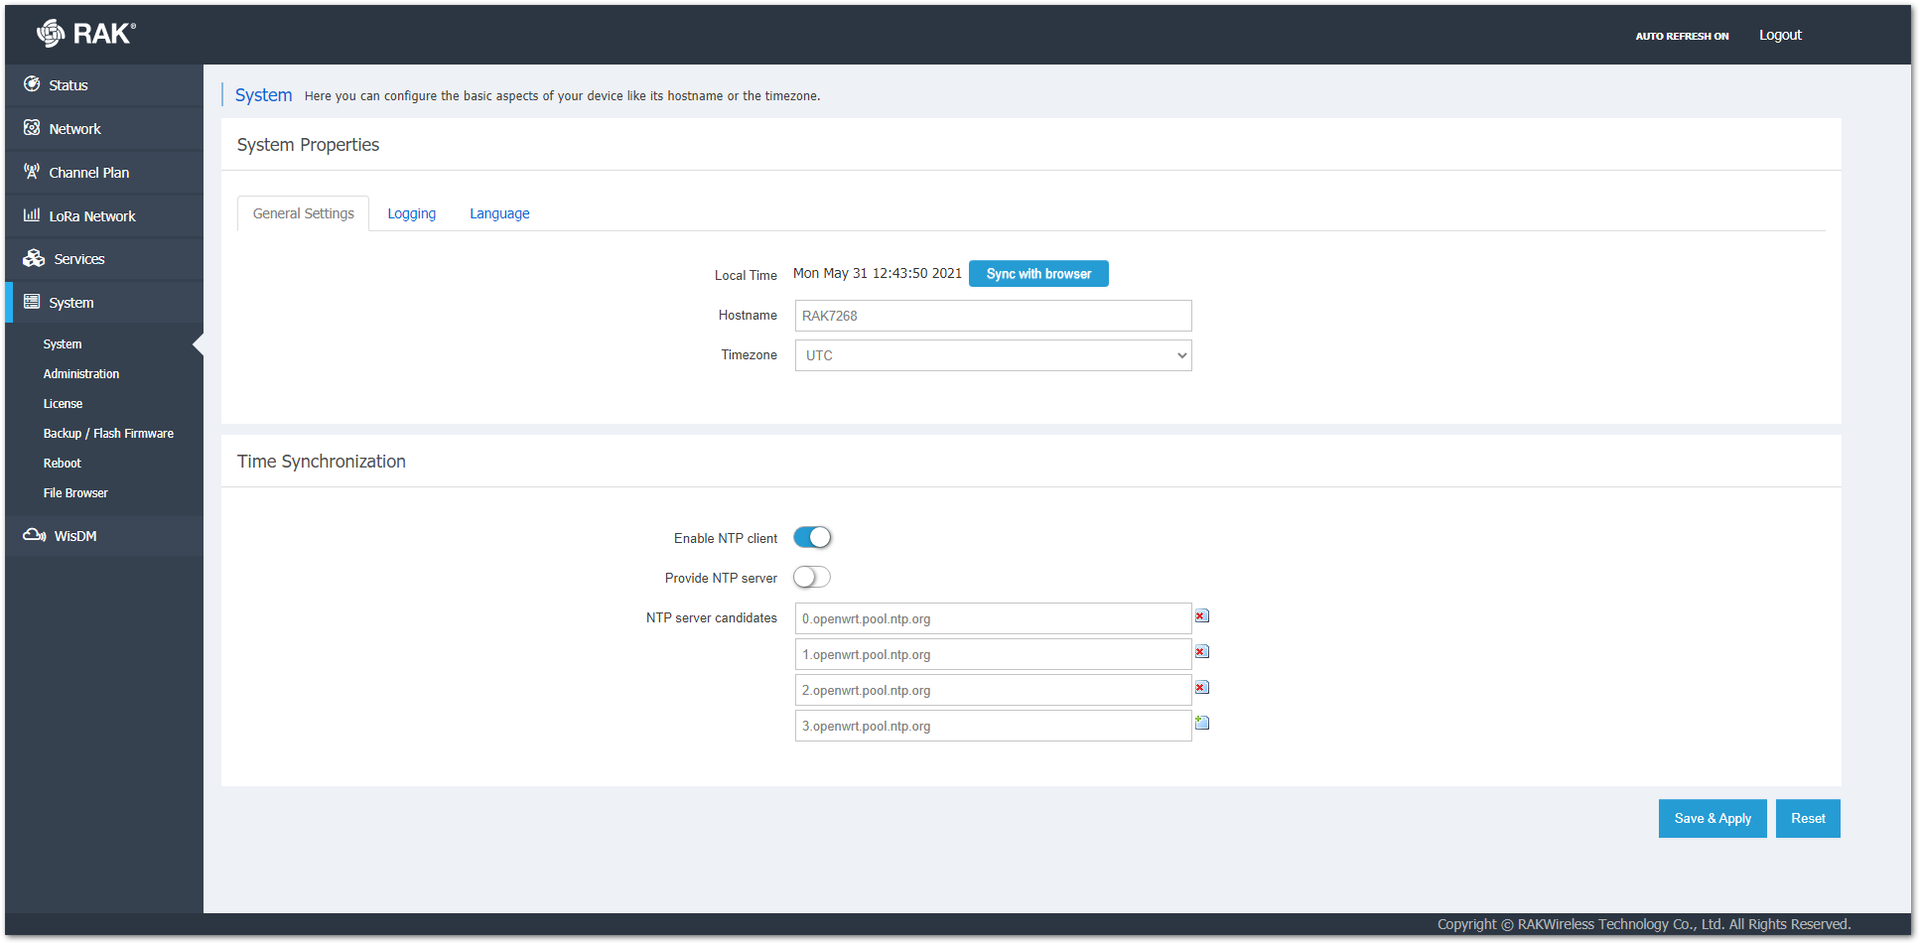 Figure 1: General Settings Tab
- Logging: You can configure how to keep a log of system events.
- System log buffer size: You can set size of the log in
kiB. - External system log server: Set the address of the external server, where the logs will be stored.
- External system log server port - Set the system log server port. By default the port is 514.
- Log output level: You can select what type of log output you want to save Debug, Info, Notice, Warning, Error, Critical, Alert, or Emergency.
- Cron Log Level: This is the level of the cron log: Normal, Debug, or Warning.
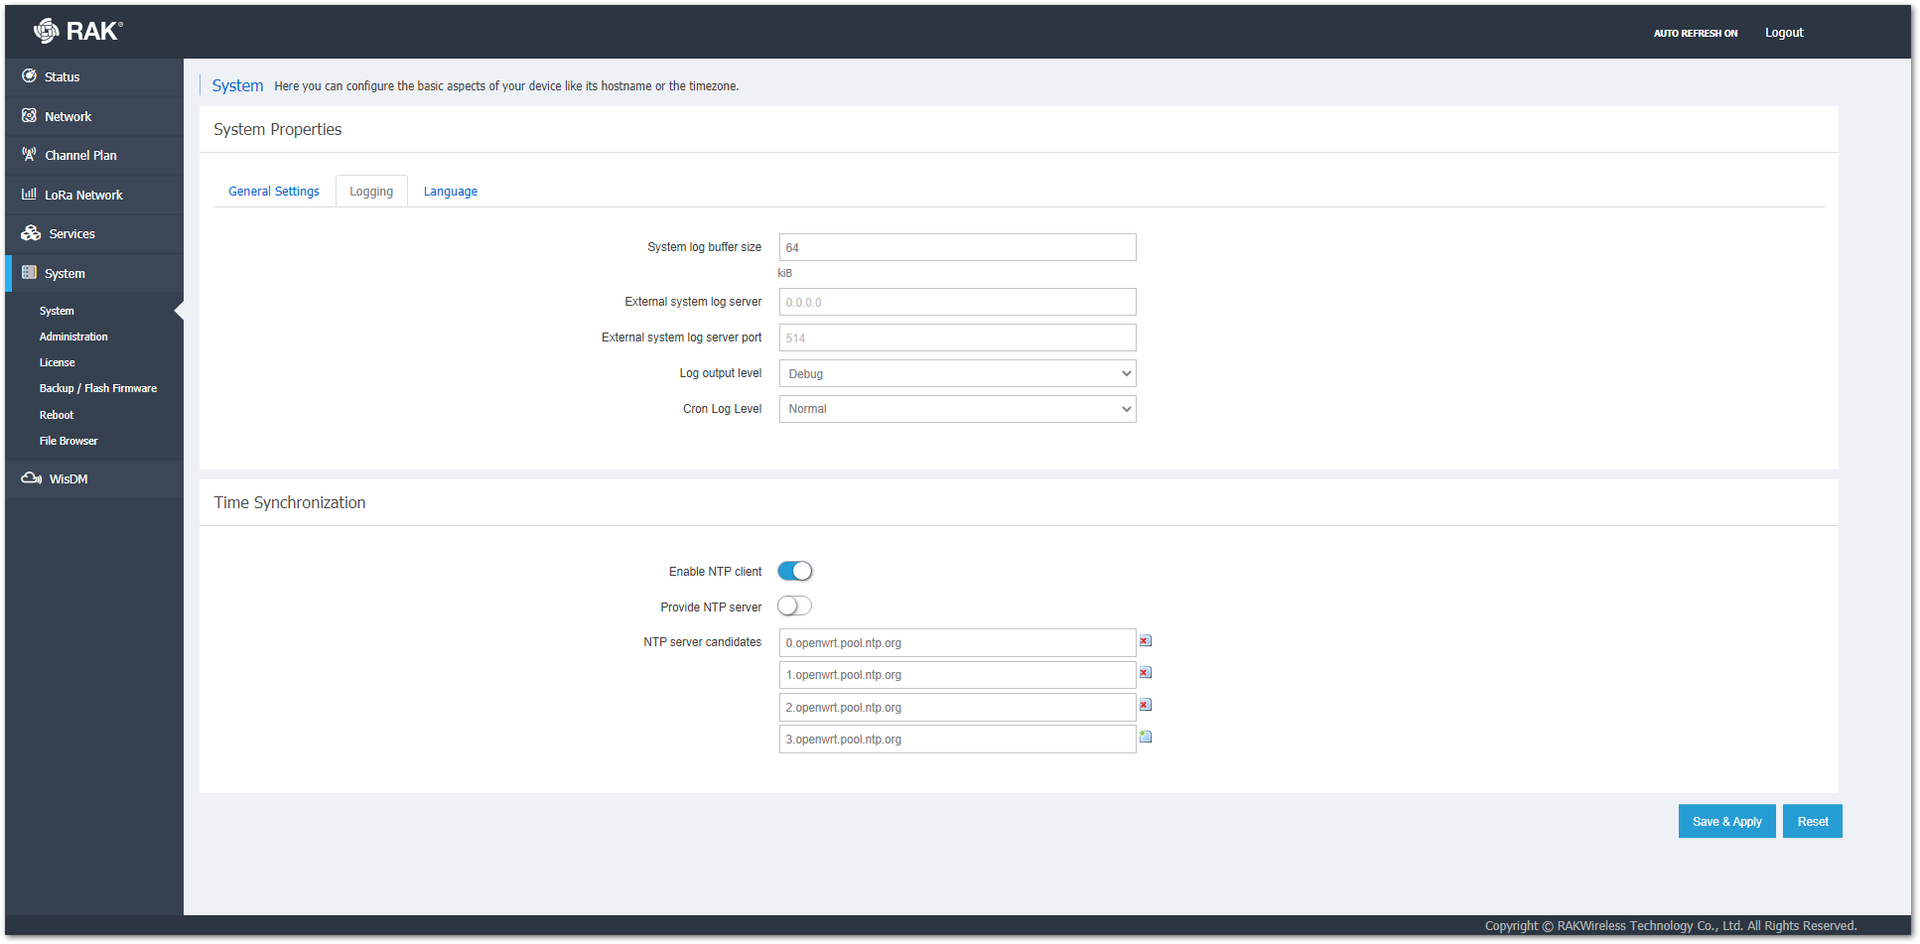 Figure 1: Logging Tab
- Language: In this tab, you can change the language of the Web UI. From the drop-down menu, you can choose a preferred language and click on Save & Apply to set the new language. Default (auto) is English.
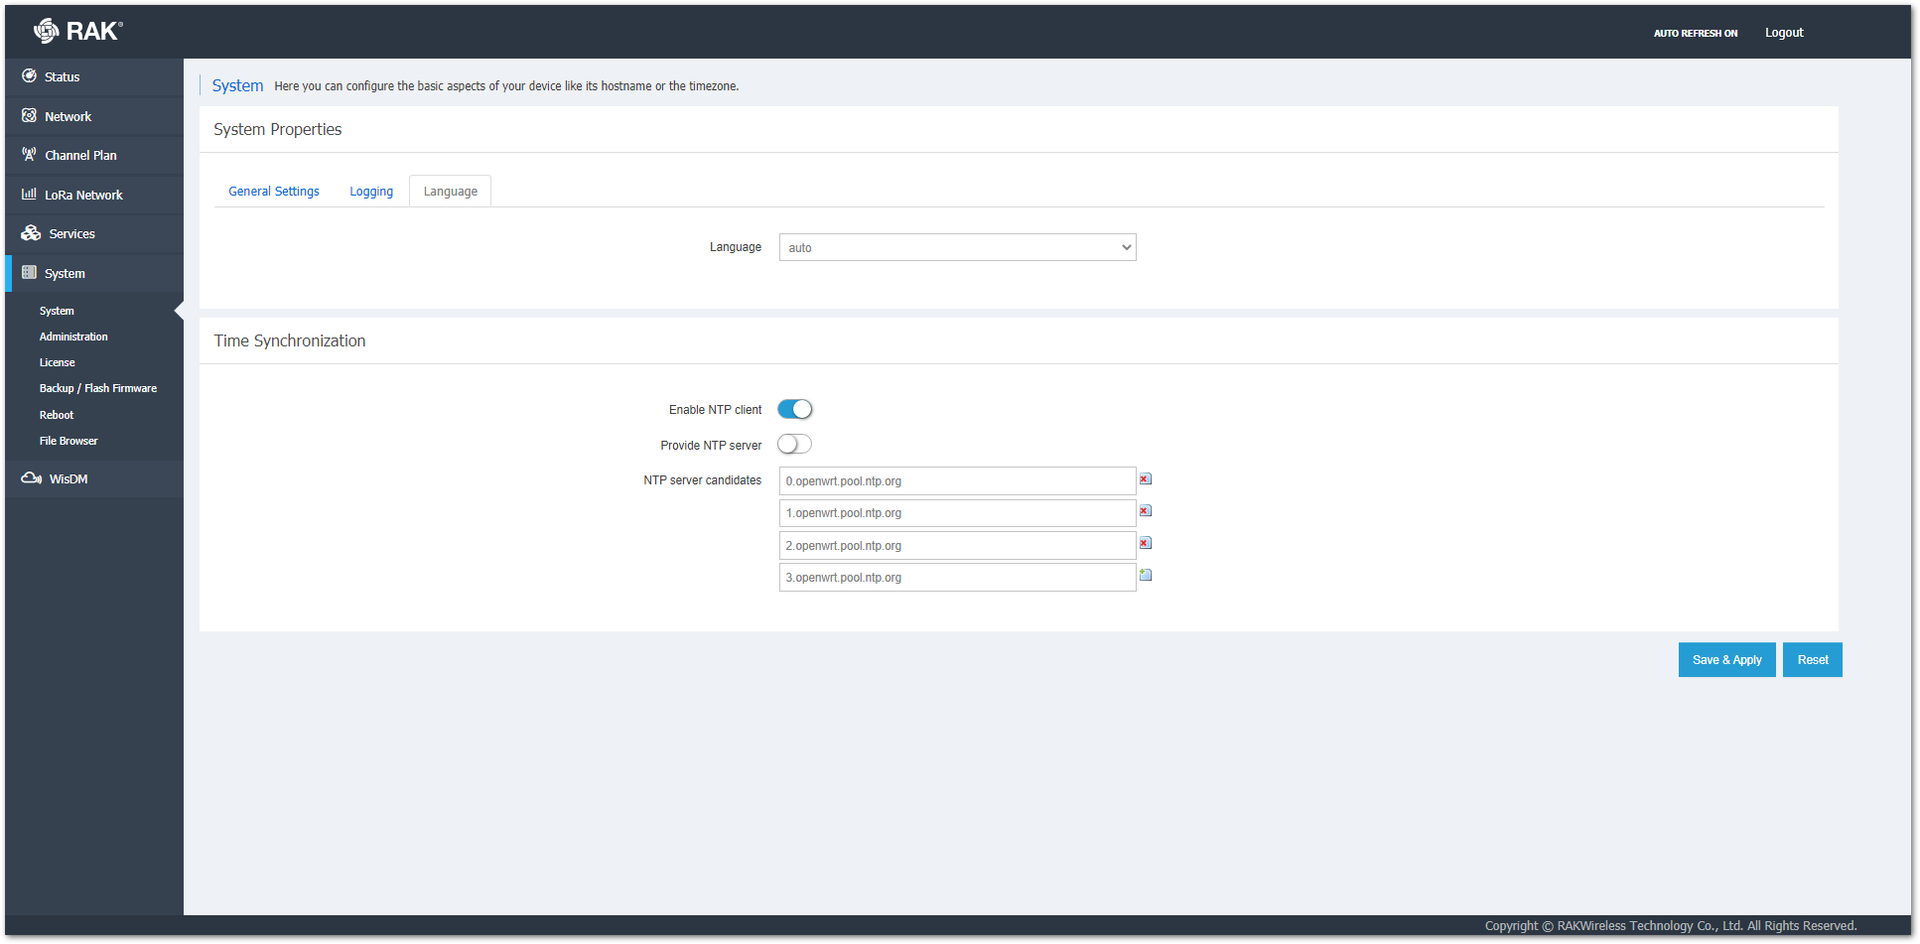 Figure 1: Language Tab
-
Time Synchronization
- Enable NTP client: Enables/disables the NTP (Network Time Protocol) client for the clock synchronization.
- Provide NTP Server: When enabled, you can set NTP servers in the NTP server candidates to synchronize the gateway’s clock.
-
Breathing light (field that is present only for RAK7268 WisGate Edge Lite 2) - This page allows you to control the status light on some of the gateways. It has three (3) options for working modes that you can select from a dropdown menu:
- All: In this mode, you get an option to set Normal Light and Abnormal light.
- The Normal light have a parameter color, where you can choose between red, green and blue, as well as frequency, where the options are slow,fast and steady.
- For Abnormal light, you can set color only. In this mode, the light on the gateway will use settings for Normal Light until a warning appear, then switch to Abnormal light.
- Warning Only: In this mode, you can set Abnormal Light only, which will start blinking as soon as warning appears.
- Disable: The light will be off regardless of warning.
- warning: in terms of this tool warnings cold occur either due to no internet connection or packet forwarder issues.
- All: In this mode, you get an option to set Normal Light and Abnormal light.
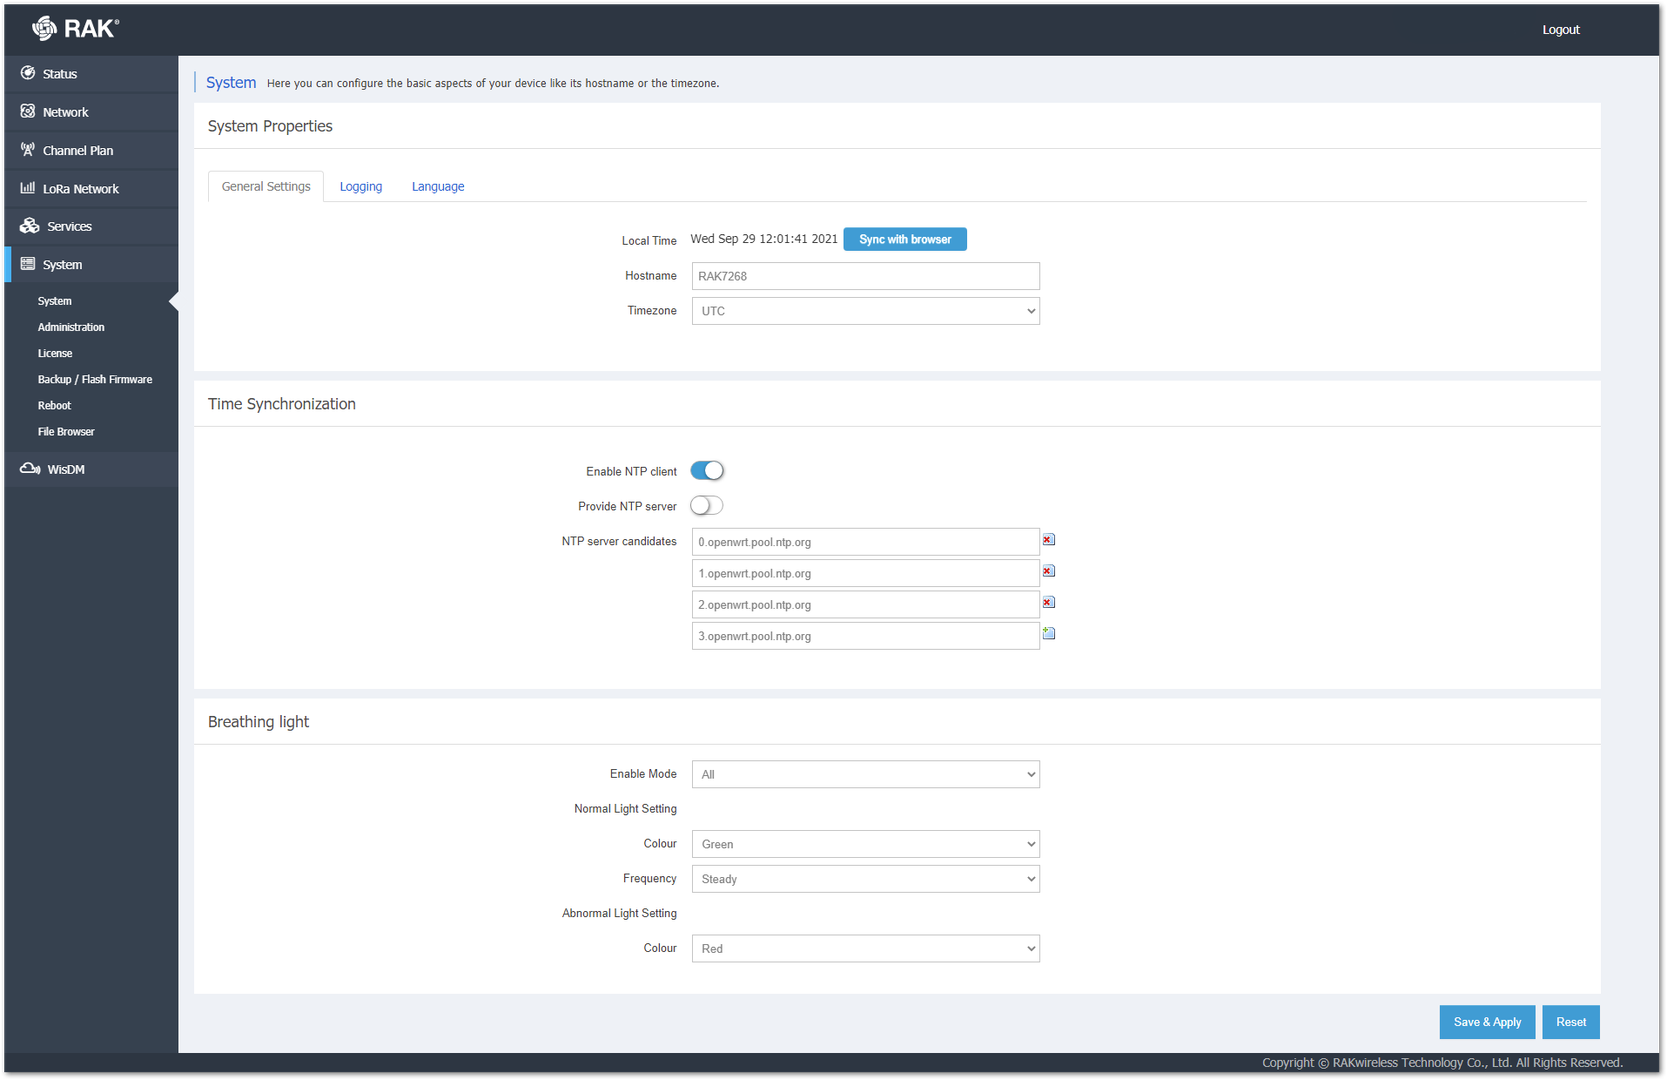 Figure 1: Breathing Light Page
Administration
From this tab, you can change the administrator password for accessing the Web UI of the gateway by typing the new password in both fields and clicking Save & Apply.
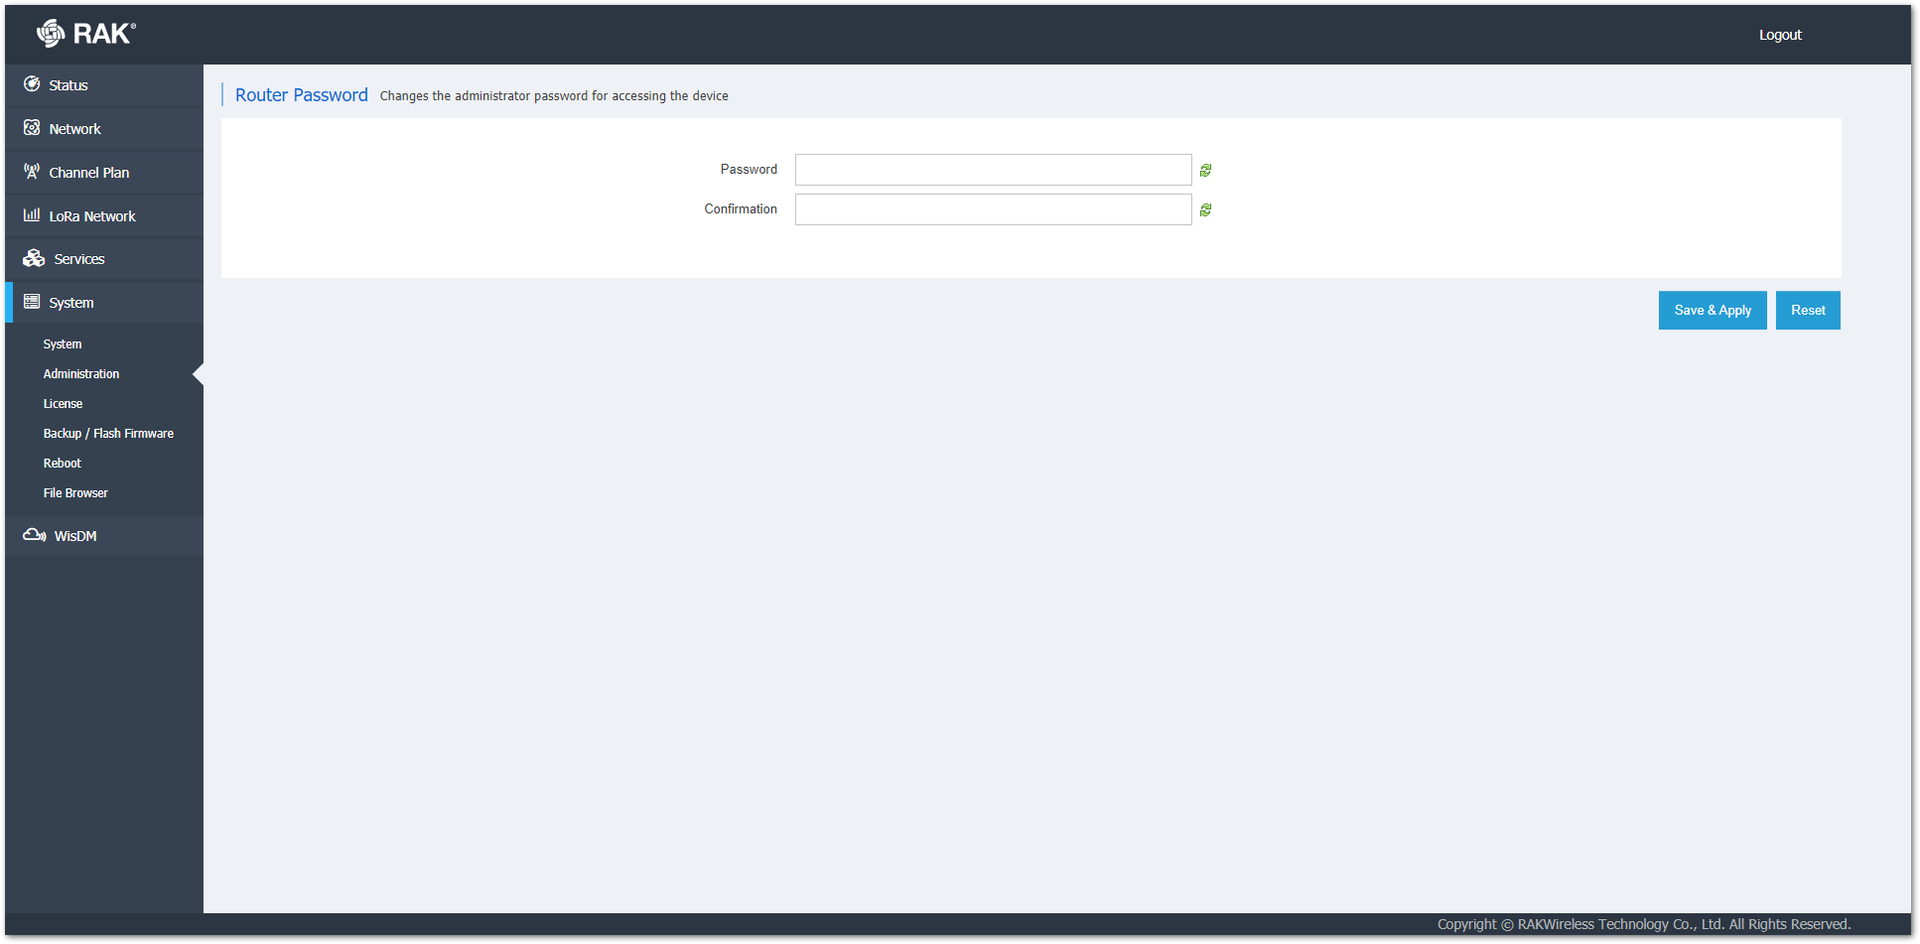 Figure 1: Administration Page
Backup / Flash Firmware
In this section, you can generate a backup of the configuration files, perform a factory reset, restore a backup, or flash new firmware.
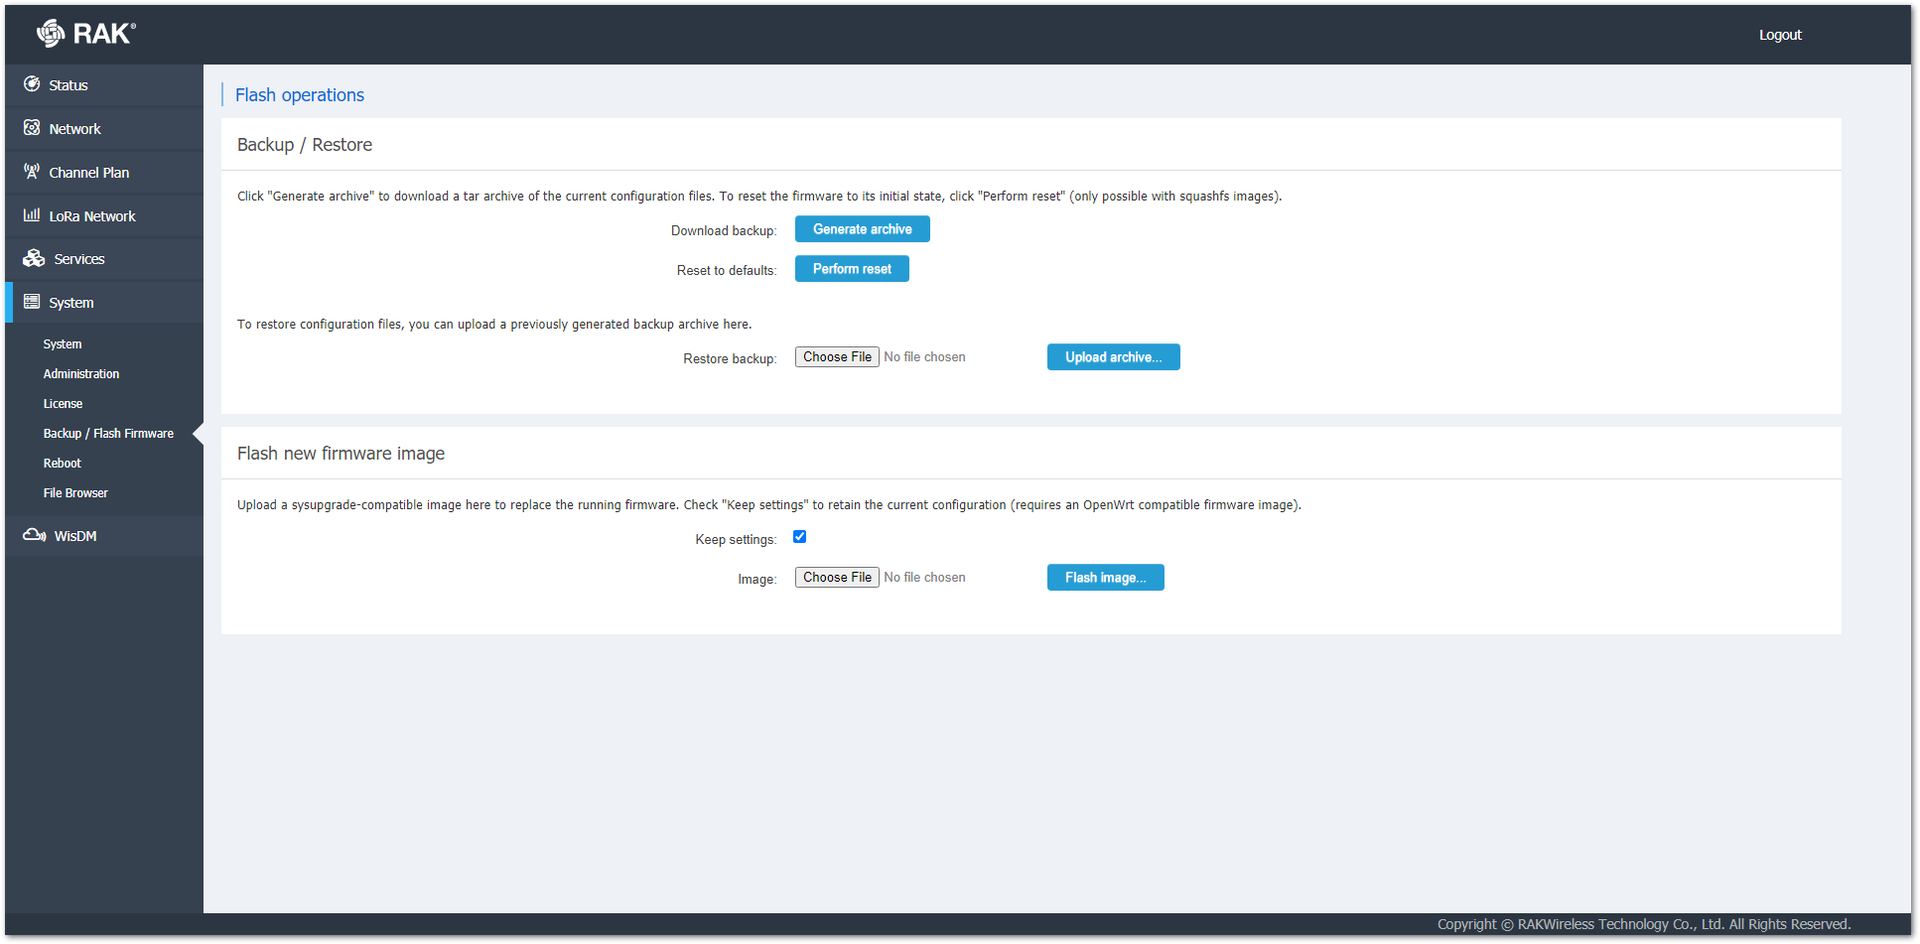 Figure 1: Backup / Flash Firmware Page
-
Backup / Restore
- Generate archive: Generates and downloads an archive of the current configuration.
- Perform reset: Resets the Gateway to the default settings.
- Restore backup: You can upload a previously generated archive via the Choose File button to restore the configuration settings at the time of its making.
-
Flash new firmware image: You can update the firmware by flashing a bin file. This is done by using the Choose File button to select the location of the new firmware file and the Flash Image… button to initiate the flashing process. There is a tick box to toggle the option of keeping the current settings of the Gateway.
The Keep settings check box is selected by default, as unchecking it will results in having a gateway with stock settings after the firmware update.
For a detailed tutorial in the Backup or Restore process, refer to Backup and Restore Explanation documentation.
Reboot
In this tab, you can reboot the gateway. All the unsaved changes will be discarded.
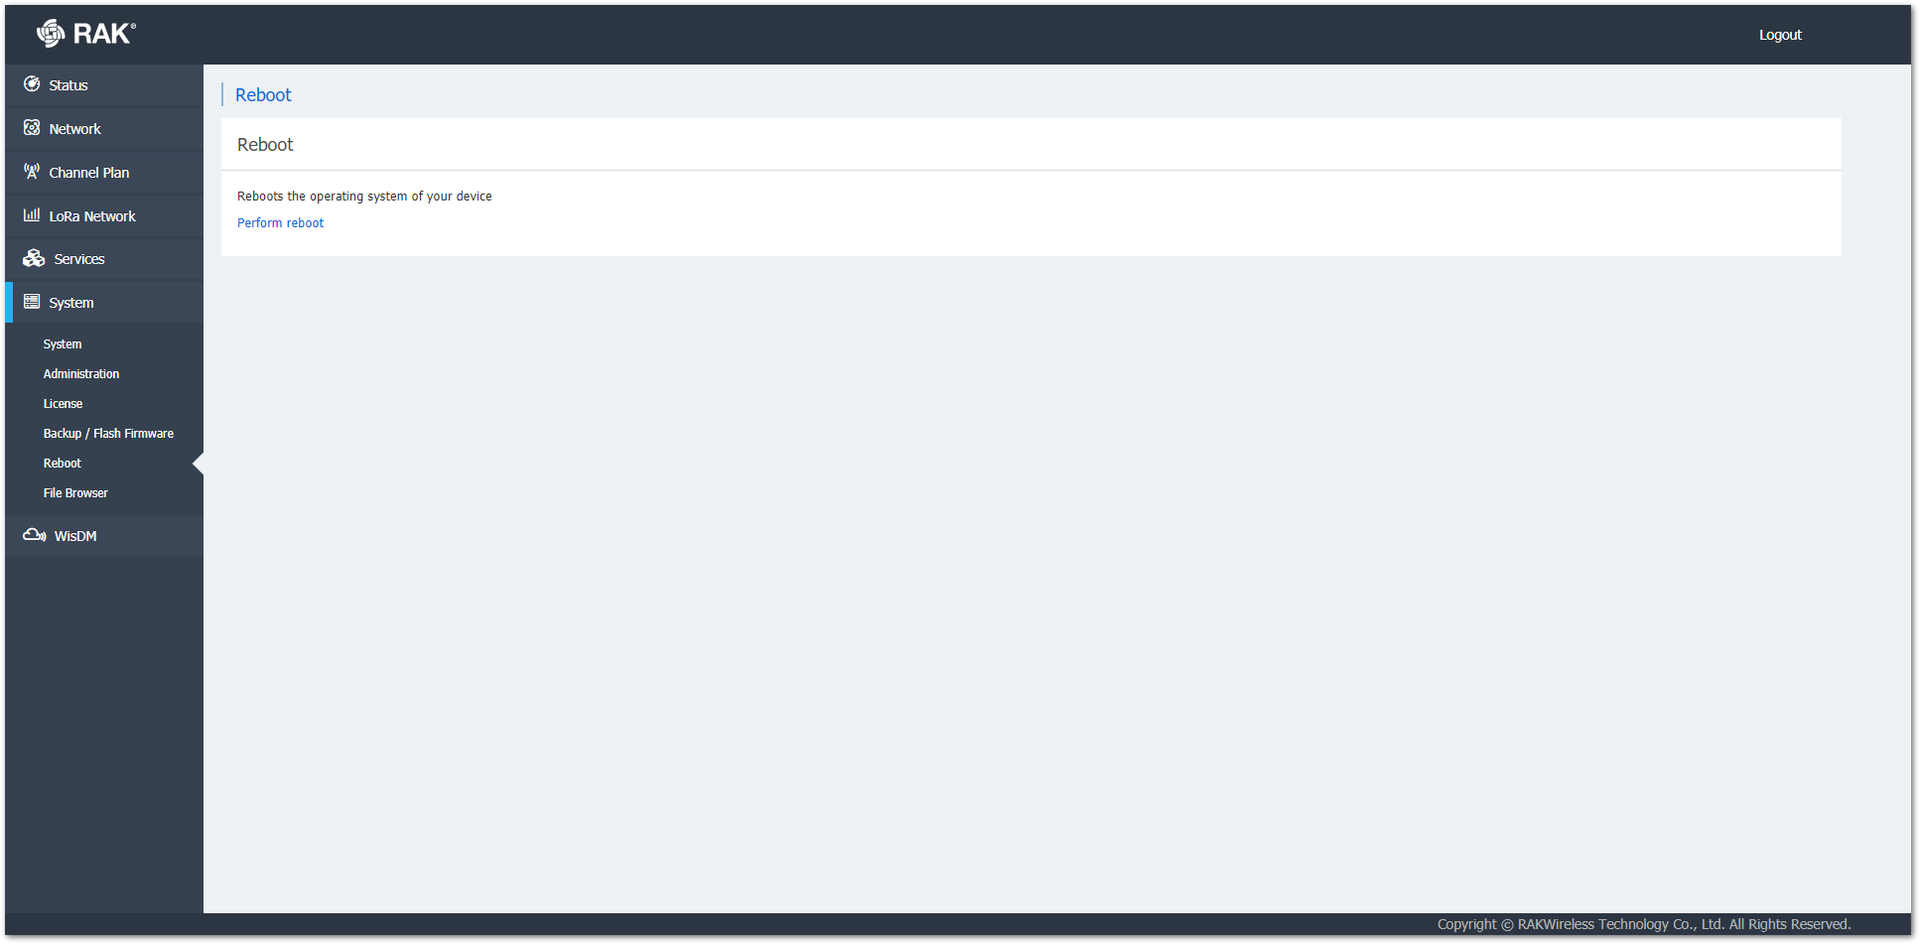 Figure 1: Reboot Page
For more details, refer to Reboot Process documentation.
File Browser
This section gives you access to the files in the root partition. System logs can be downloaded from here.
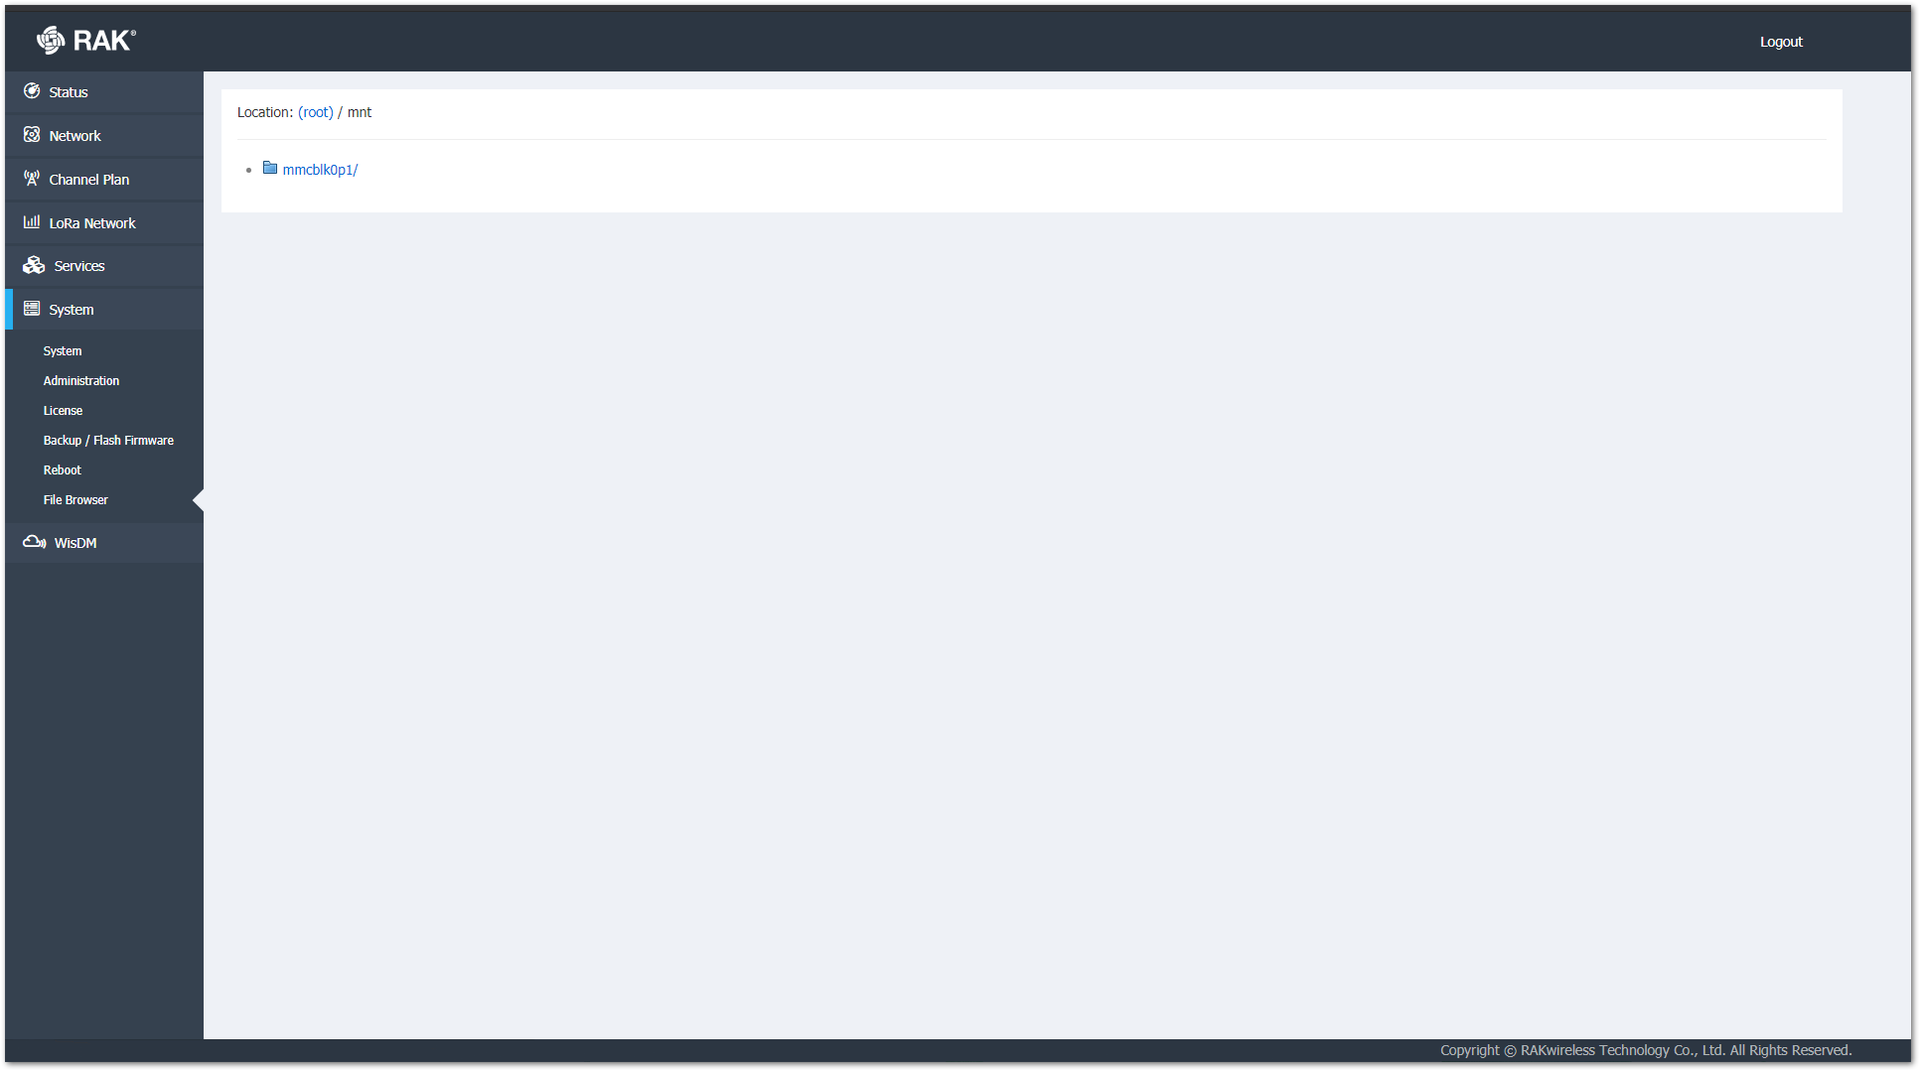 Figure 1: File Browser Page
For more details, refer to File Browser Explanation documentation.
WisDM
In this tab, you can enable/disable the WisDM functionality. More information about WisDM can be found in the RAK News Hub.
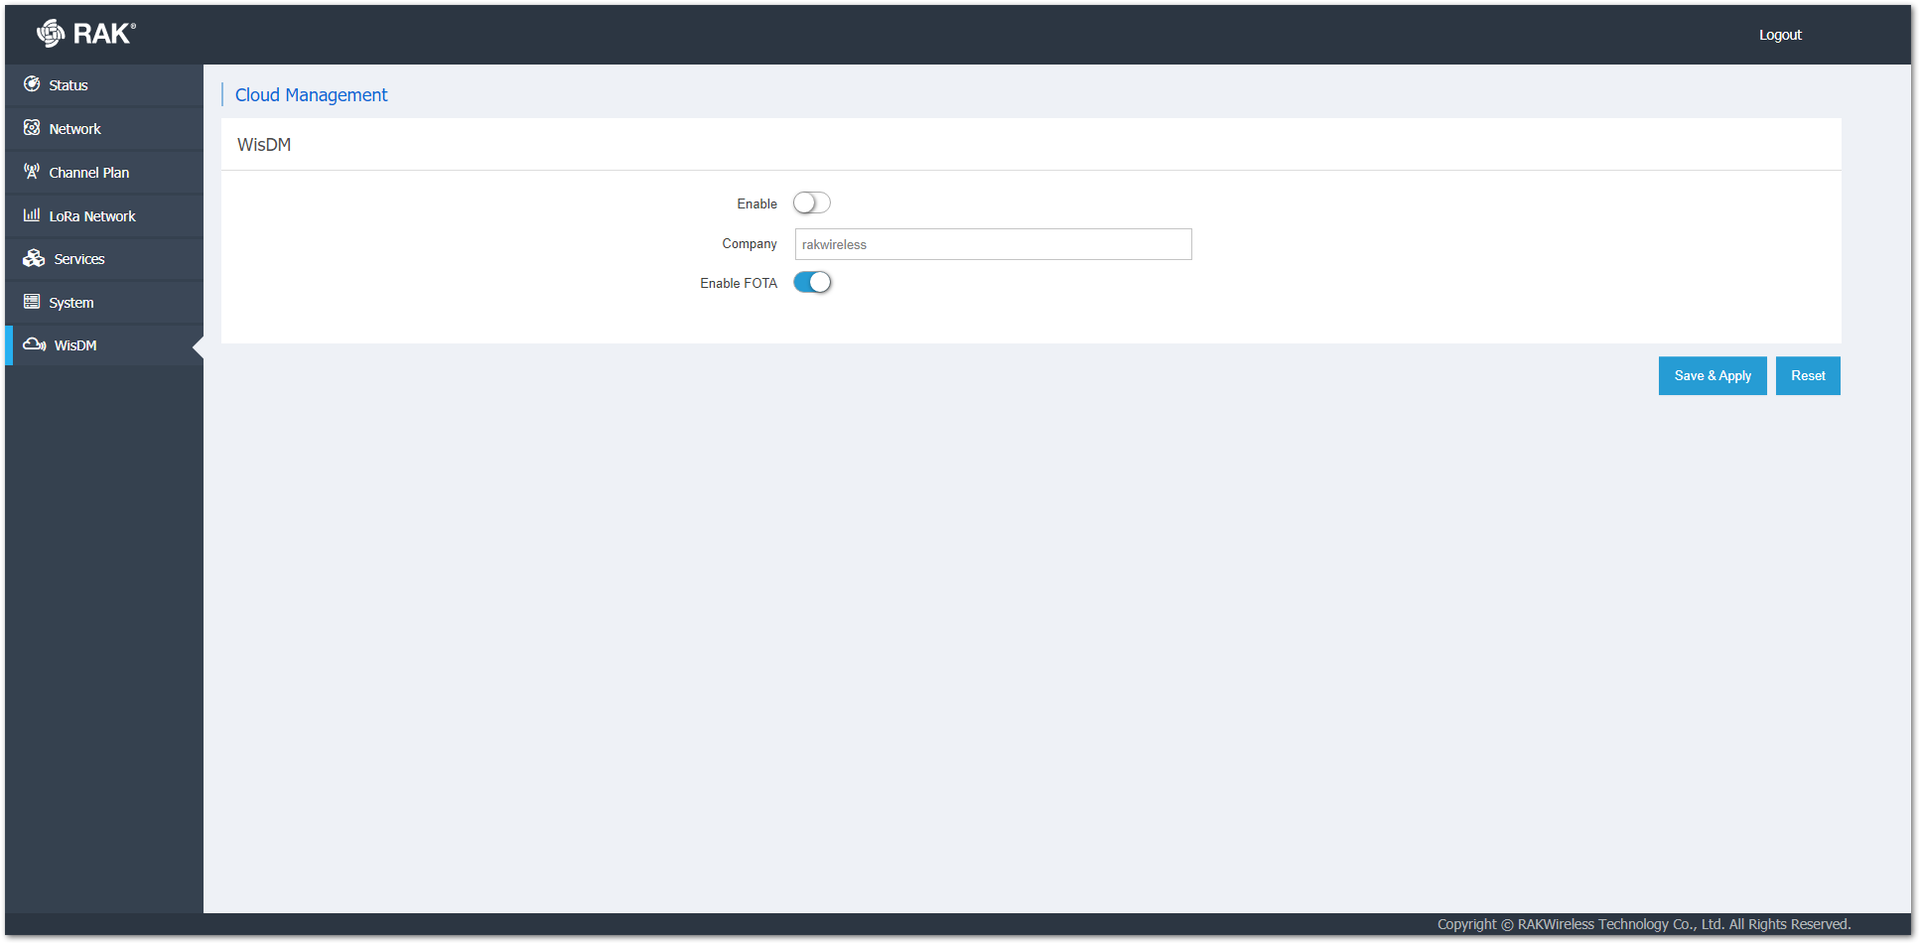 Figure 1: WisDM Page
-
Enable: Enables/disables the WisDM.
-
Company: The name of the company/user that owns the gateway. For easier management and navigation, use the name of the organization with the WisDM account.
-
Enable FOTA: When enabled, the gateway can be upgraded to a newer firmware version via the WisDM. If you want to upgrade the firmware via the Web UI, this function must be disabled.