RF Spectrum Scanner
The RF Spectrum Scanner extension allows you to scan and visualize RF spectrum activity in real time across a defined frequency range. Using color-coded heatmaps that map signal strength (RSSI) over time and frequency, it helps you detect interference, identify noisy channels, and understand how the spectrum environment behaves.
This tool is especially useful for:
- Analyzing RF noise and potential interference in real-world deployments
- Identifying the best frequency sub-bands for reliable LoRa communication
- Troubleshooting poor network performance due to channel congestion
- Running regular audits of the local RF environment
All completed scans are saved automatically and can be reviewed or exported from the History tab for further analysis or record keeping.
-
Starting a spectrum scan will temporarily stop all LoRaWAN transmissions. Make sure it won't disrupt any critical services before you continue.
-
Currently supported only on RAK7289V2 gateways due to hardware requirements.
Install the RF Spectrum Scanner Extension
To install this extension, follow Add an Extension.
Configure the RF Spectrum Scanner Extension
- To access the RF Spectrum Scanner extension, click Launch.
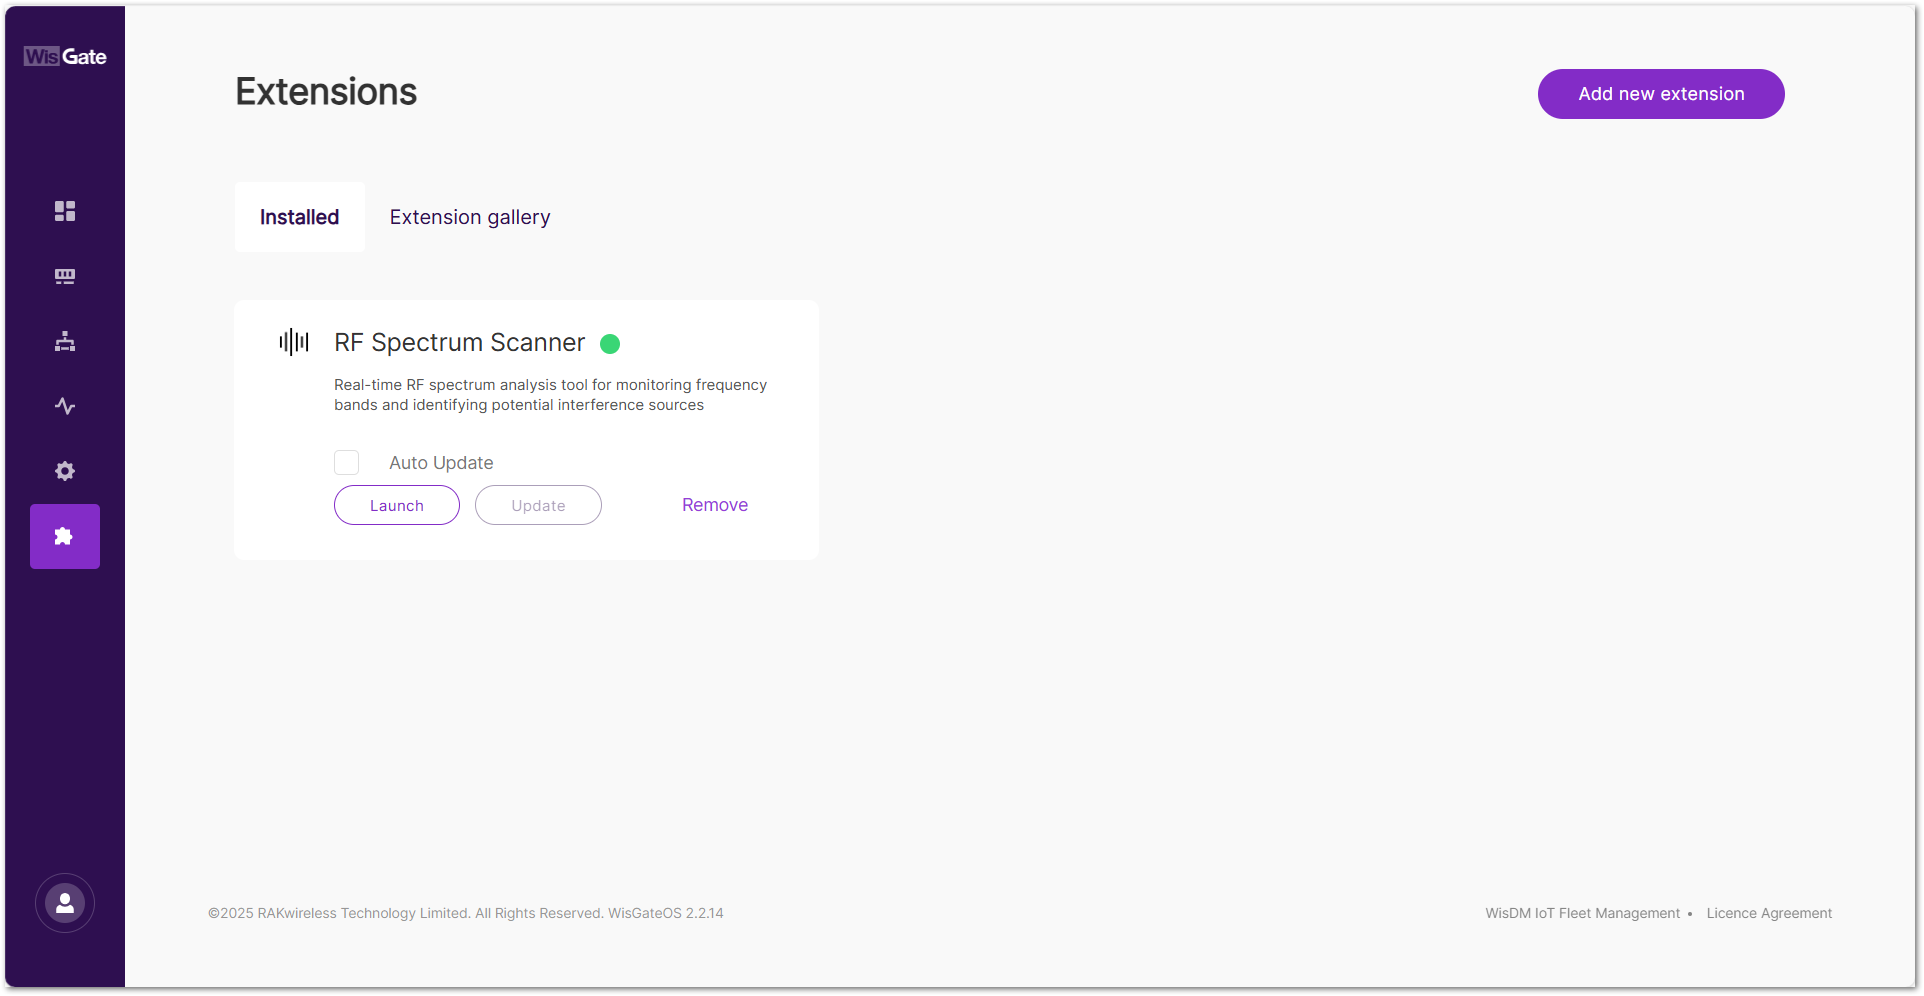 Figure 1: Extensions tab
- In the Live Scan tab, configure the following scan parameters:
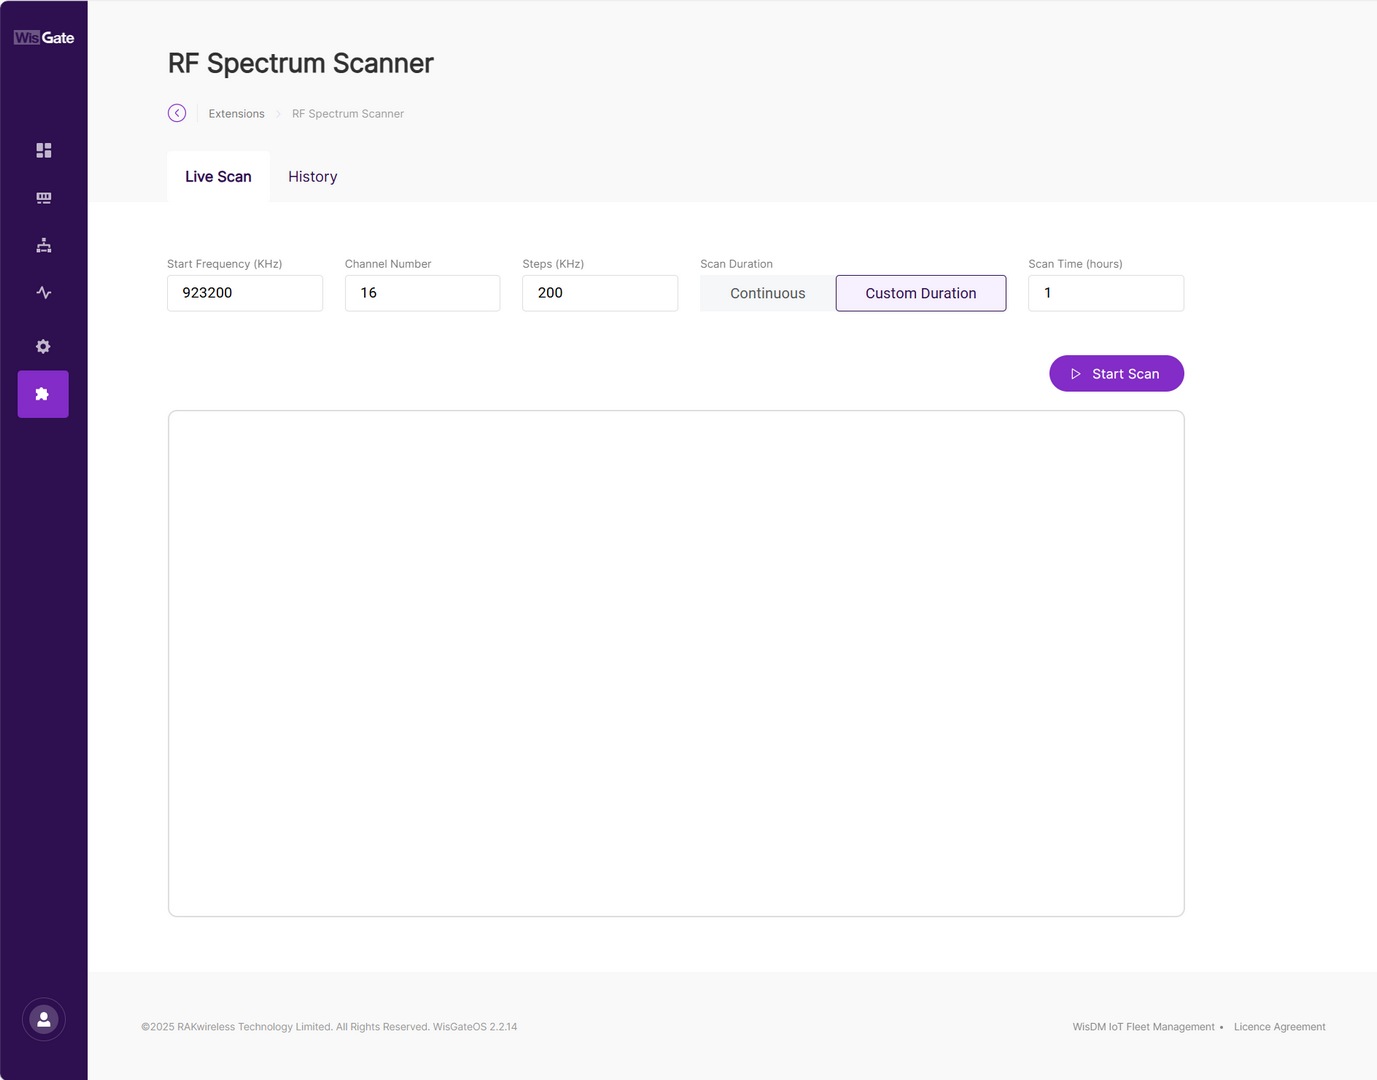 Figure 1: Configuration parameters
| Field | Description | Valid Range / Notes |
|---|---|---|
| Start Frequency (KHz) | Starting frequency of the scan range | 863000~925000 kHz (must be within gateway RF band) |
| Channel Number | Total number of frequency points (channels) to scan | Must be an integer ≥1 and ≤32 |
| Steps (KHz) | Frequency increment between each channel | 10~500 kHz |
| Scan Duration | Determines how long the scan runs |
|
| Scan Time (hours) | Duration of scan if Custom Duration is selected | Integer from 1 to 168 |
- Click Start Scan to initiate the scan.
- A confirmation dialog will appear. Click Confirm to proceed.
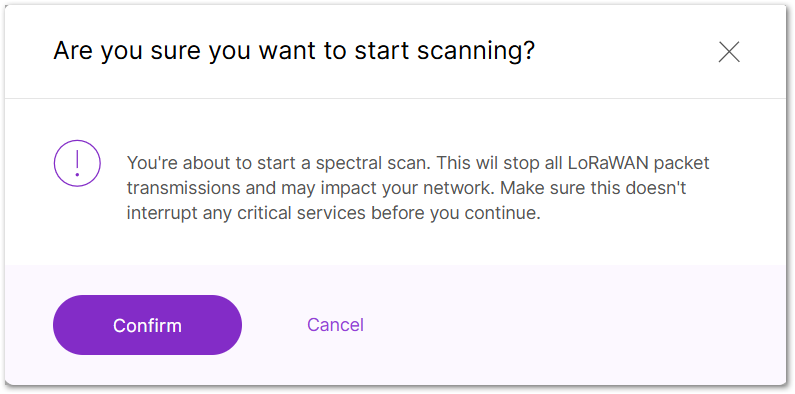 Figure 1: Confirm to start scanning
- Once scanning begins, a real-time chart appears showing signal strength across the scanned frequency range:
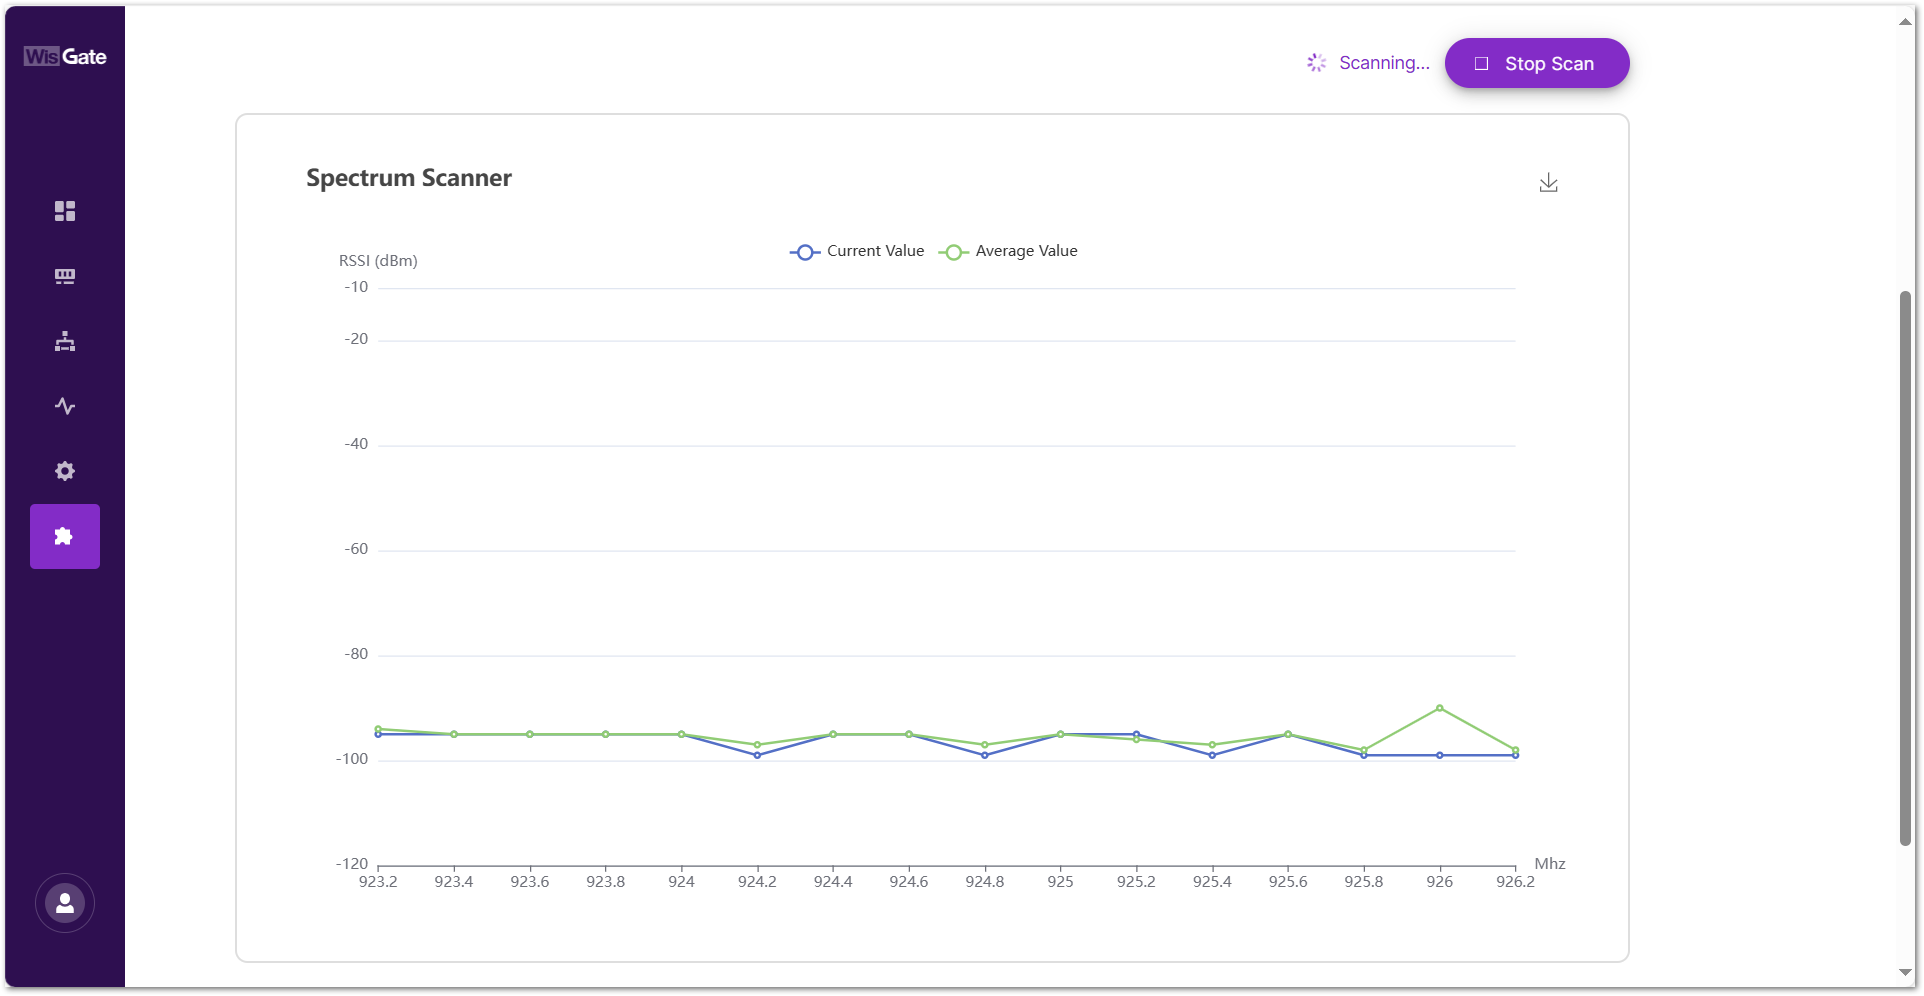 Figure 1: Scanning
- X-Axis (MHz): Shows the frequency range being scanned.
- Y-Axis (RSSI in dBm): Displays signal strength levels for each frequency point.
- Current Value (Blue Line): Live RSSI readings captured during the current scan cycle.
- Average Value (Green Line): Running average of RSSI values since the scan started.
- Download Icon: Click to save the current chart as a PNG image.
- Stop Scan: Click to end the ongoing scan.
Viewing and Managing Scan History
All completed spectrum scans are automatically saved and accessible from the History tab. This section allows users to review past scans, visualize average signal levels, and export scan data for further analysis or archiving.
Each row in the History table represents a scan session. The following details are shown for each session:
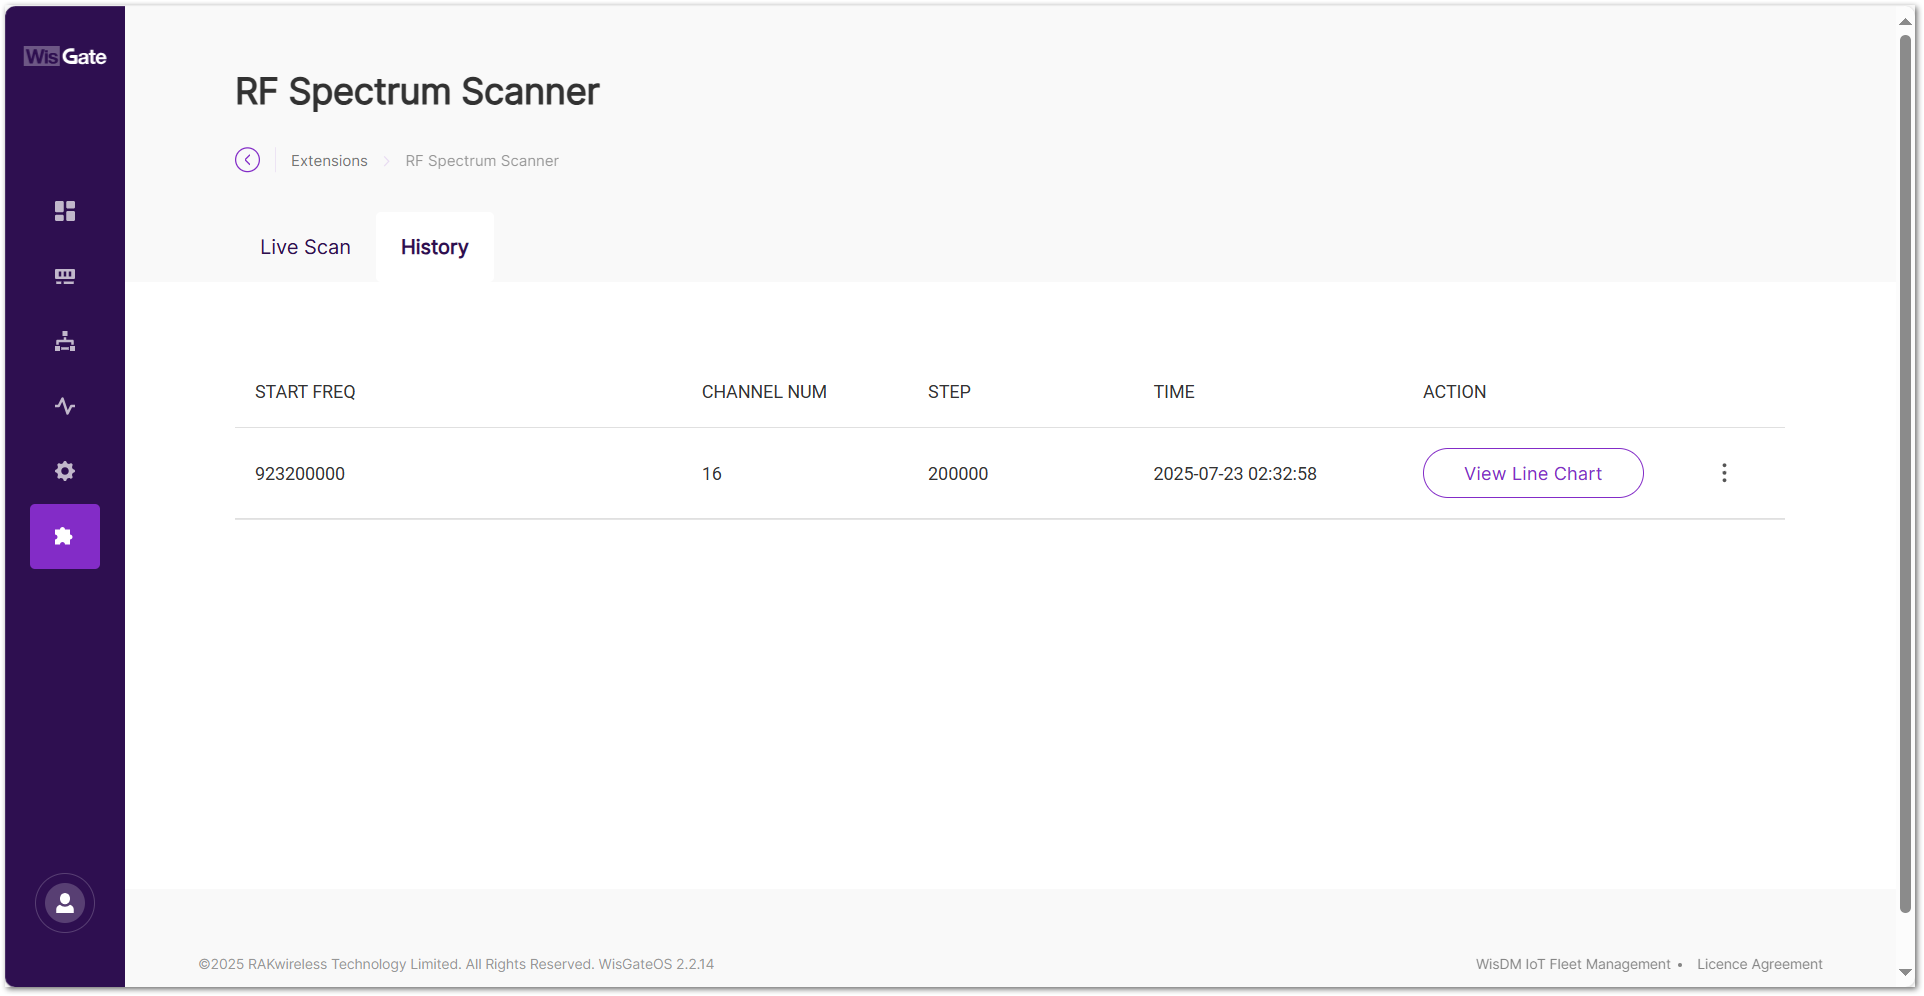 Figure 1: Scan records
-
START FREQ: The starting frequency of the scan (in Hz).
-
CHANNEL NUM: The number of scanned frequency channels.
-
STEP: The step size between each frequency (in Hz).
-
TIME: The timestamp when the scan was initiated.
-
ACTION:
-
View Line Chart: Click View Line Chart to display a graphical summary of the selected scan.
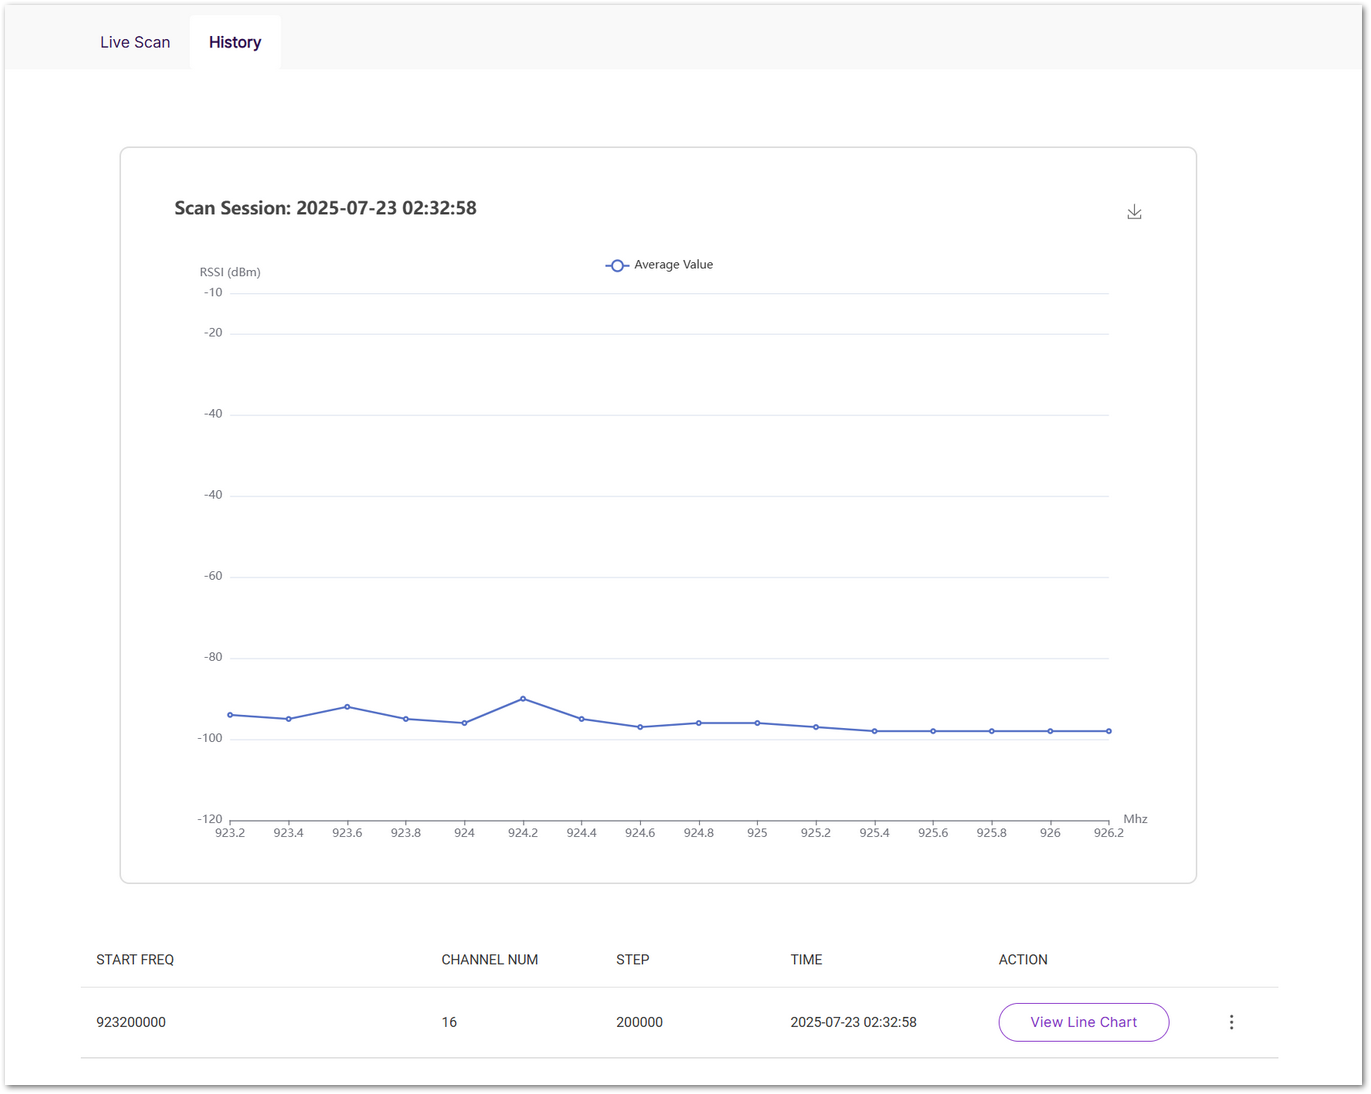 Figure 1: Scan session
 -
Export as Data: Click ⋮ menu and select Export as Data will download the raw scan results as a CSV file.
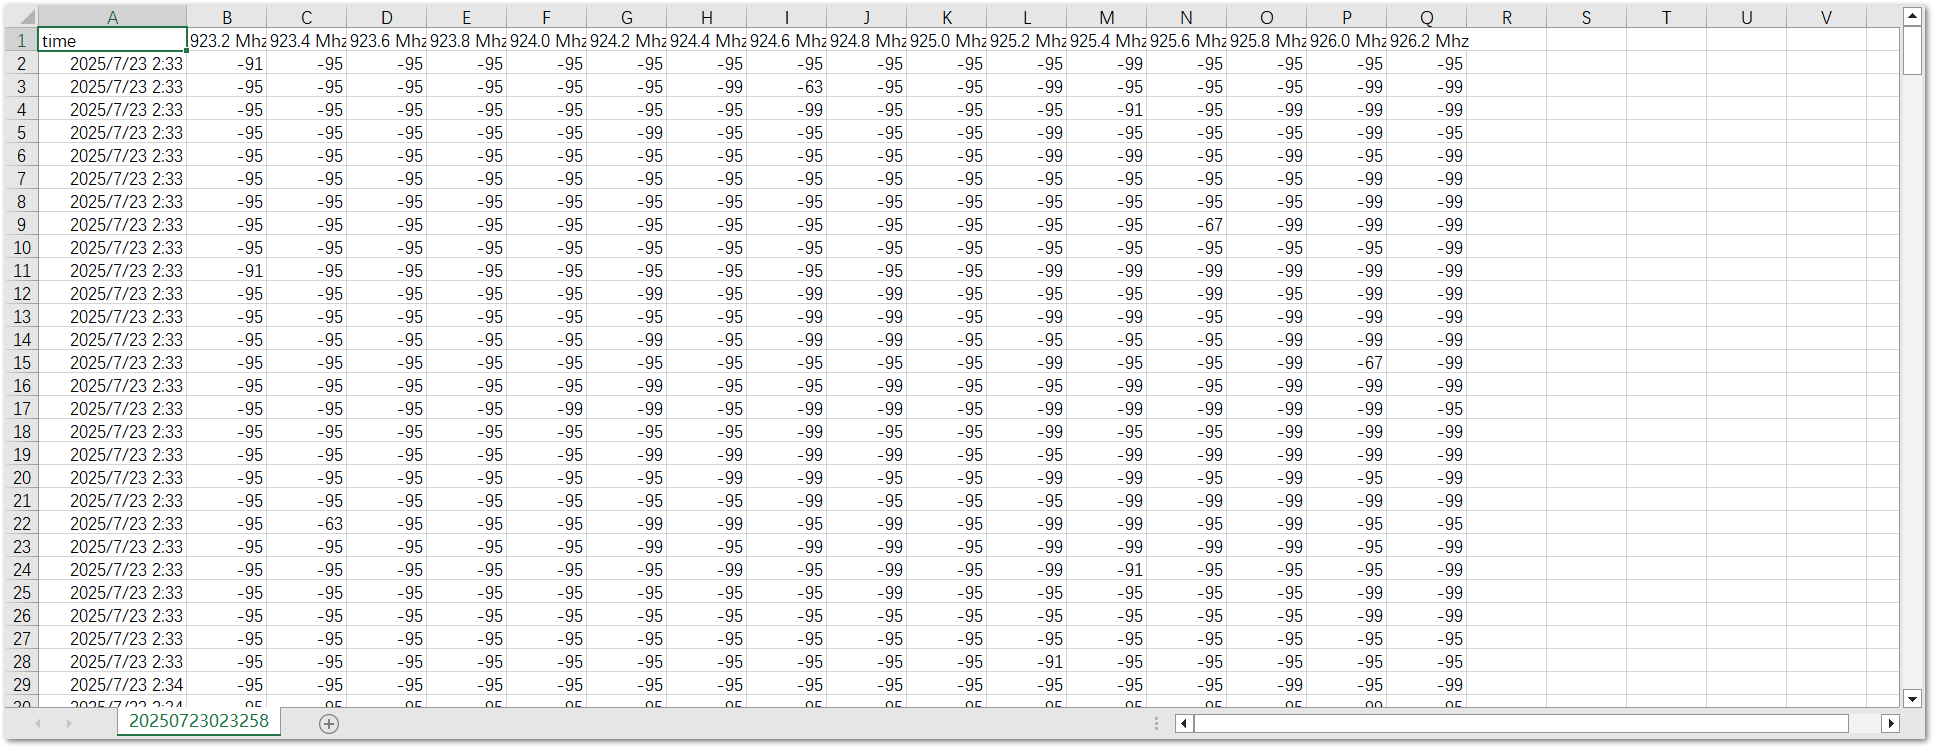 Figure 1: Downloaded data
 -
Delete: Removes the scan record from the list.
-


