WisDM Diagnostic and Debug Tools
View Real-Time Log
You can view real-time logs for both assigned and unassigned gateways, which is useful for monitoring system processes and diagnosing immediate issues.
This feature is available only when the gateway is online.
You can open the log viewer from:
- Gateway Overview page
 Figure 1: Access Real-Time Logs from Gateway Overview
- Gateway List
 Figure 1: Access Real-Time Logs from Gateway List
- Click View log.
- In the pop-up window, enter the gateway access password and click Sign in.
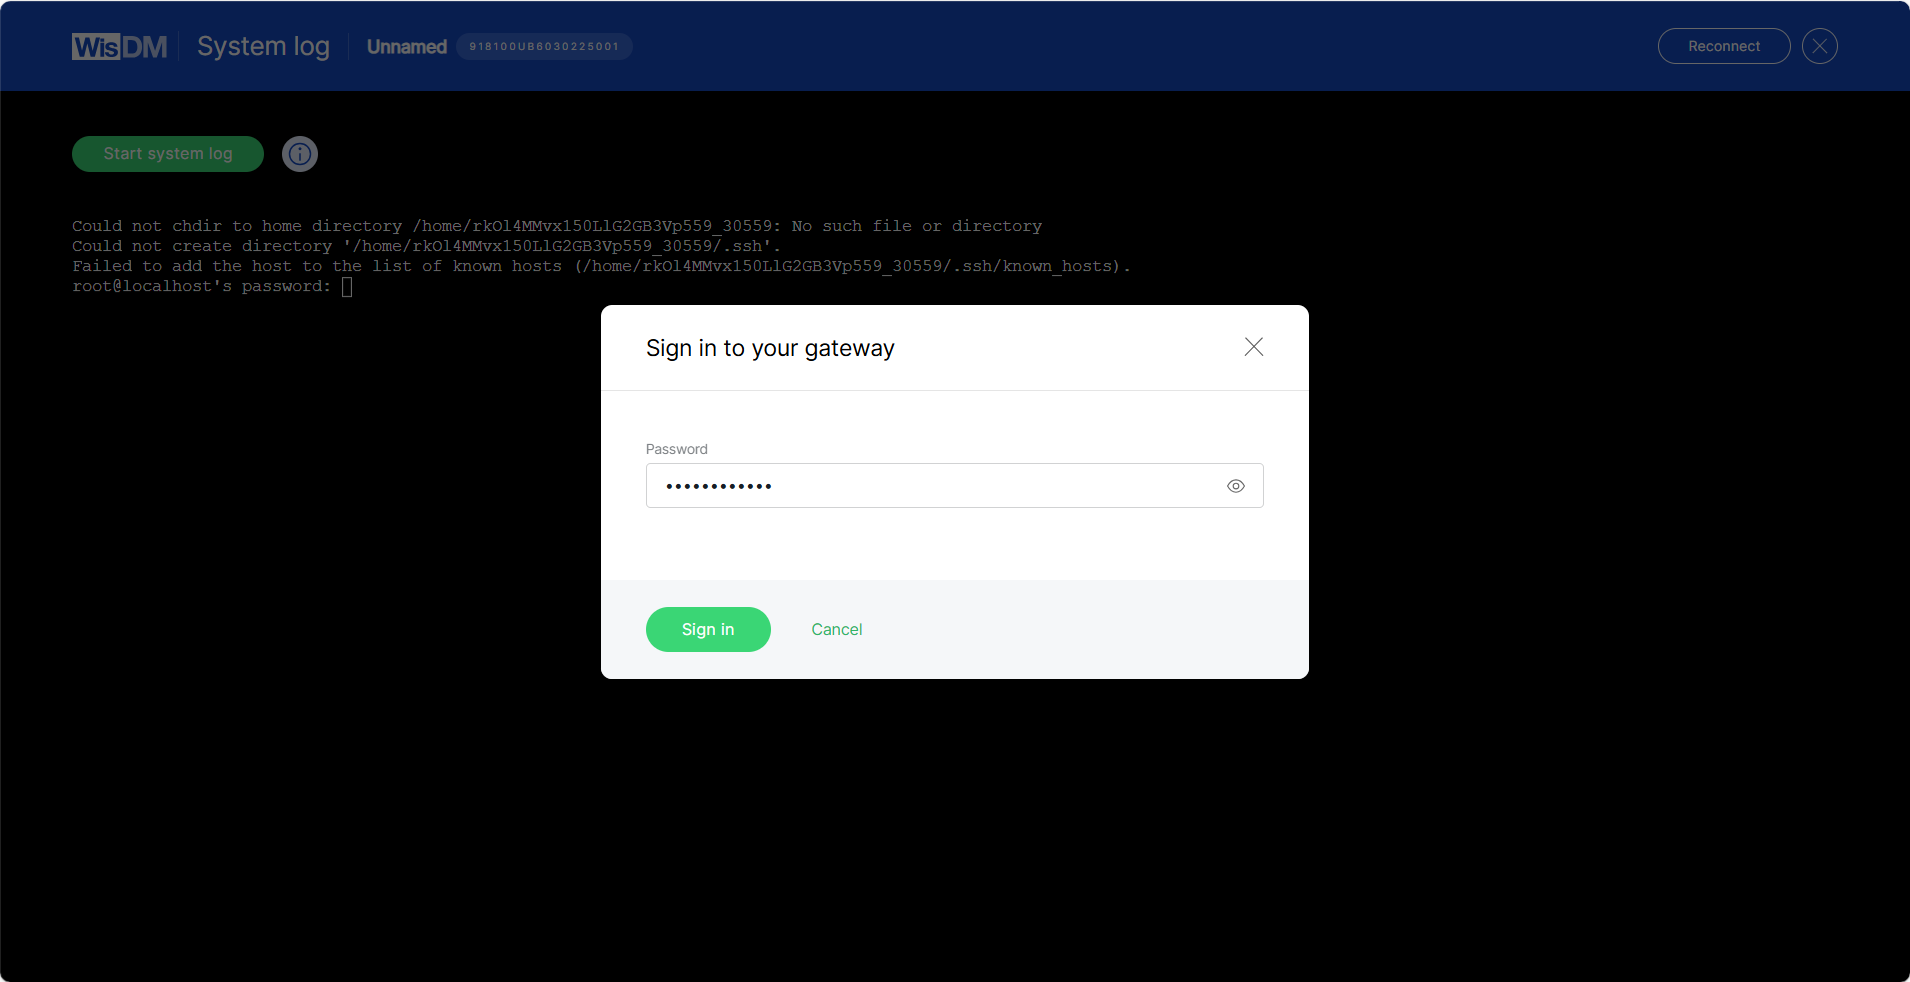 Figure 1: Sign in to Your Gateway
- Click Start system log. WisDM will automatically send the command
logread -fto the gateway, and log entries will begin updating in real time.
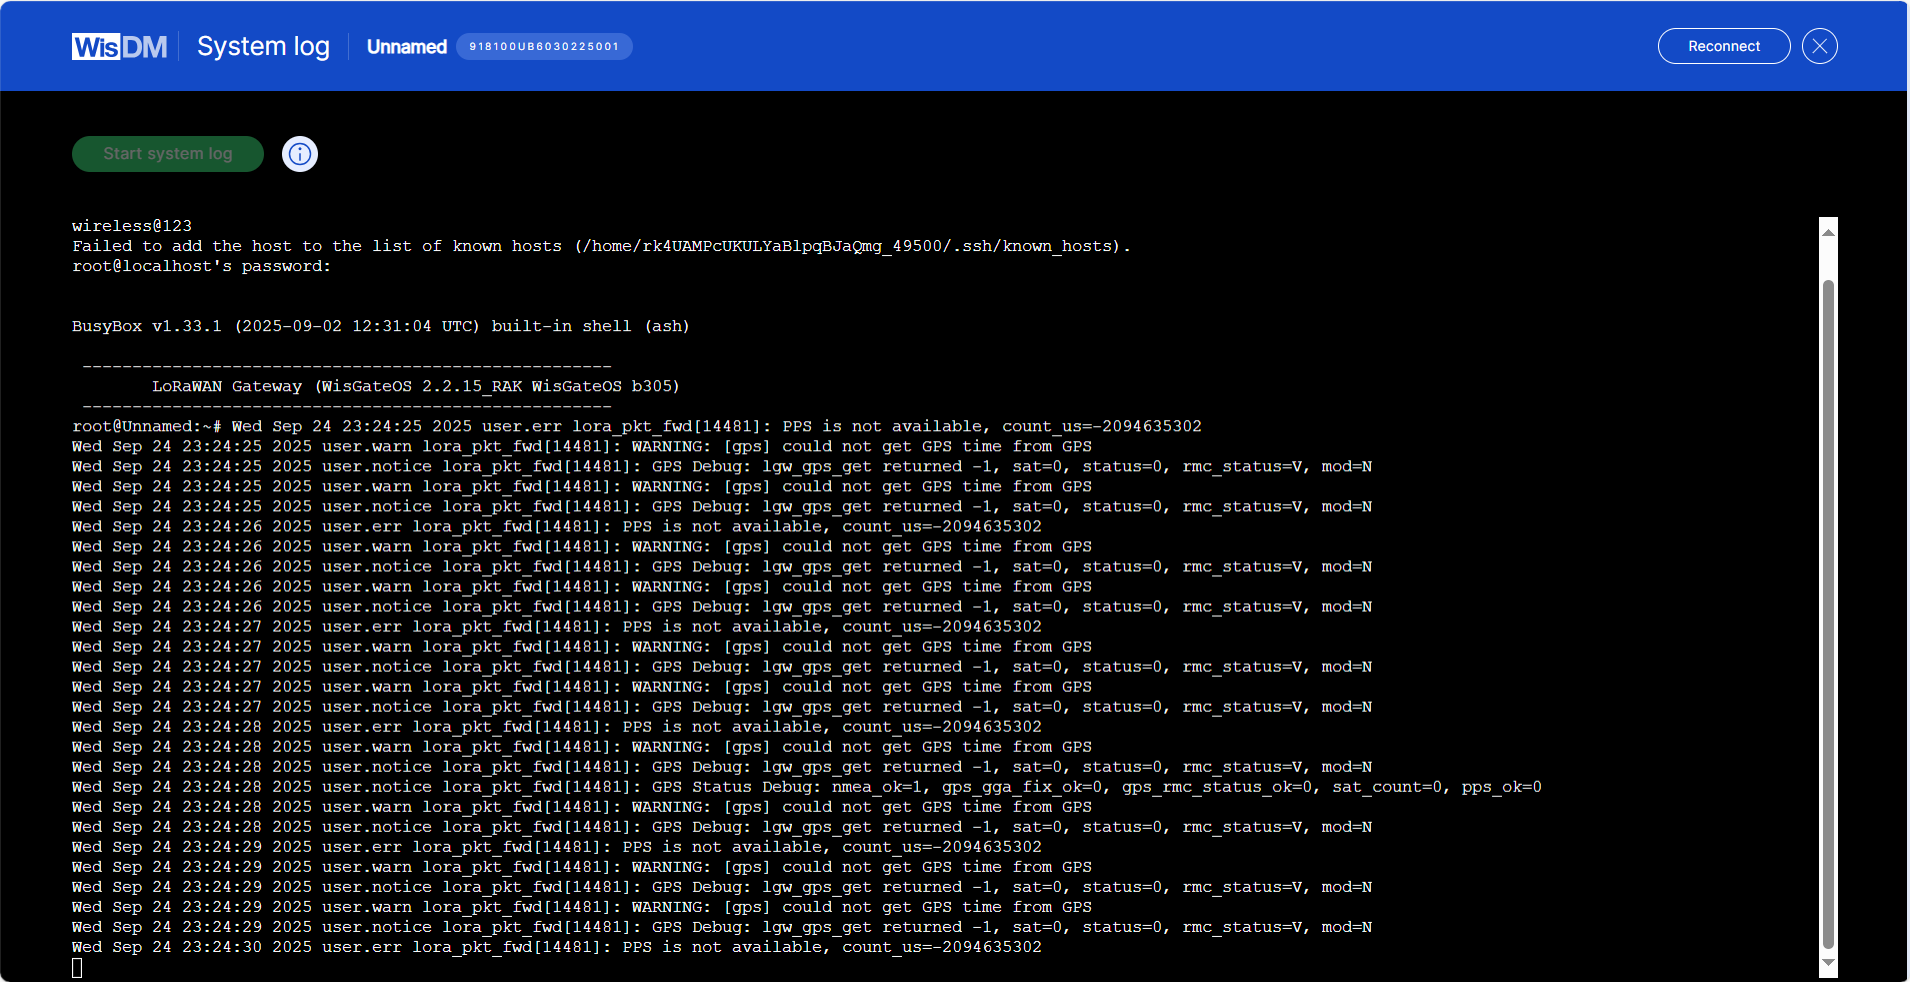 Figure 1: View Real-Time Log
- (Optional) To pause log updates, press Ctrl+C.
History Log
If you have enabled log sharing with WisDM in the gateway's System Settings > Log Settings, WisDM allows you to view the gateway’s historical system logs for the period specified in your configuration.
- Navigate to Gateways > Select a gateway > Overview.
Figure 1: Access History Logs from Gateway Overview- Click History log. Use the Filters panel to select a specific time period and view the logs for that range.
 Figure 1: Filter and Review History Logs
You can review all logs available within the WisDM log rotation cycle.
SSH
Administrators can use SSH to perform advanced tasks such as maintenance, diagnostics, running custom scripts, installing firmware components, and other operations.
Access is granted through a secure Linux SSH tunnel to a specific gateway, provided that the gateway is online.
- Only one SSH session can run on a gateway at a time. If a new session is requested while another is active, the existing session will be terminated and replaced with the new one.
- For gateways running WisGateOS 2.3.0 or later, the system requires a password change on the first SSH login.
- If the gateway was already accessed via SSH on WisGateOS 2.2.x before being upgraded to WisGateOS 2.3.x, no additional password change is required after the upgrade.
Access SSH
You can access the SSH terminal from either of these entry points:
- Gateway Overview page
Figure 1: SSH Access from Gateway Overview- Gateway List
Figure 1: SSH Access from Gateway ListStart an SSH Session
- Click SSH terminal.
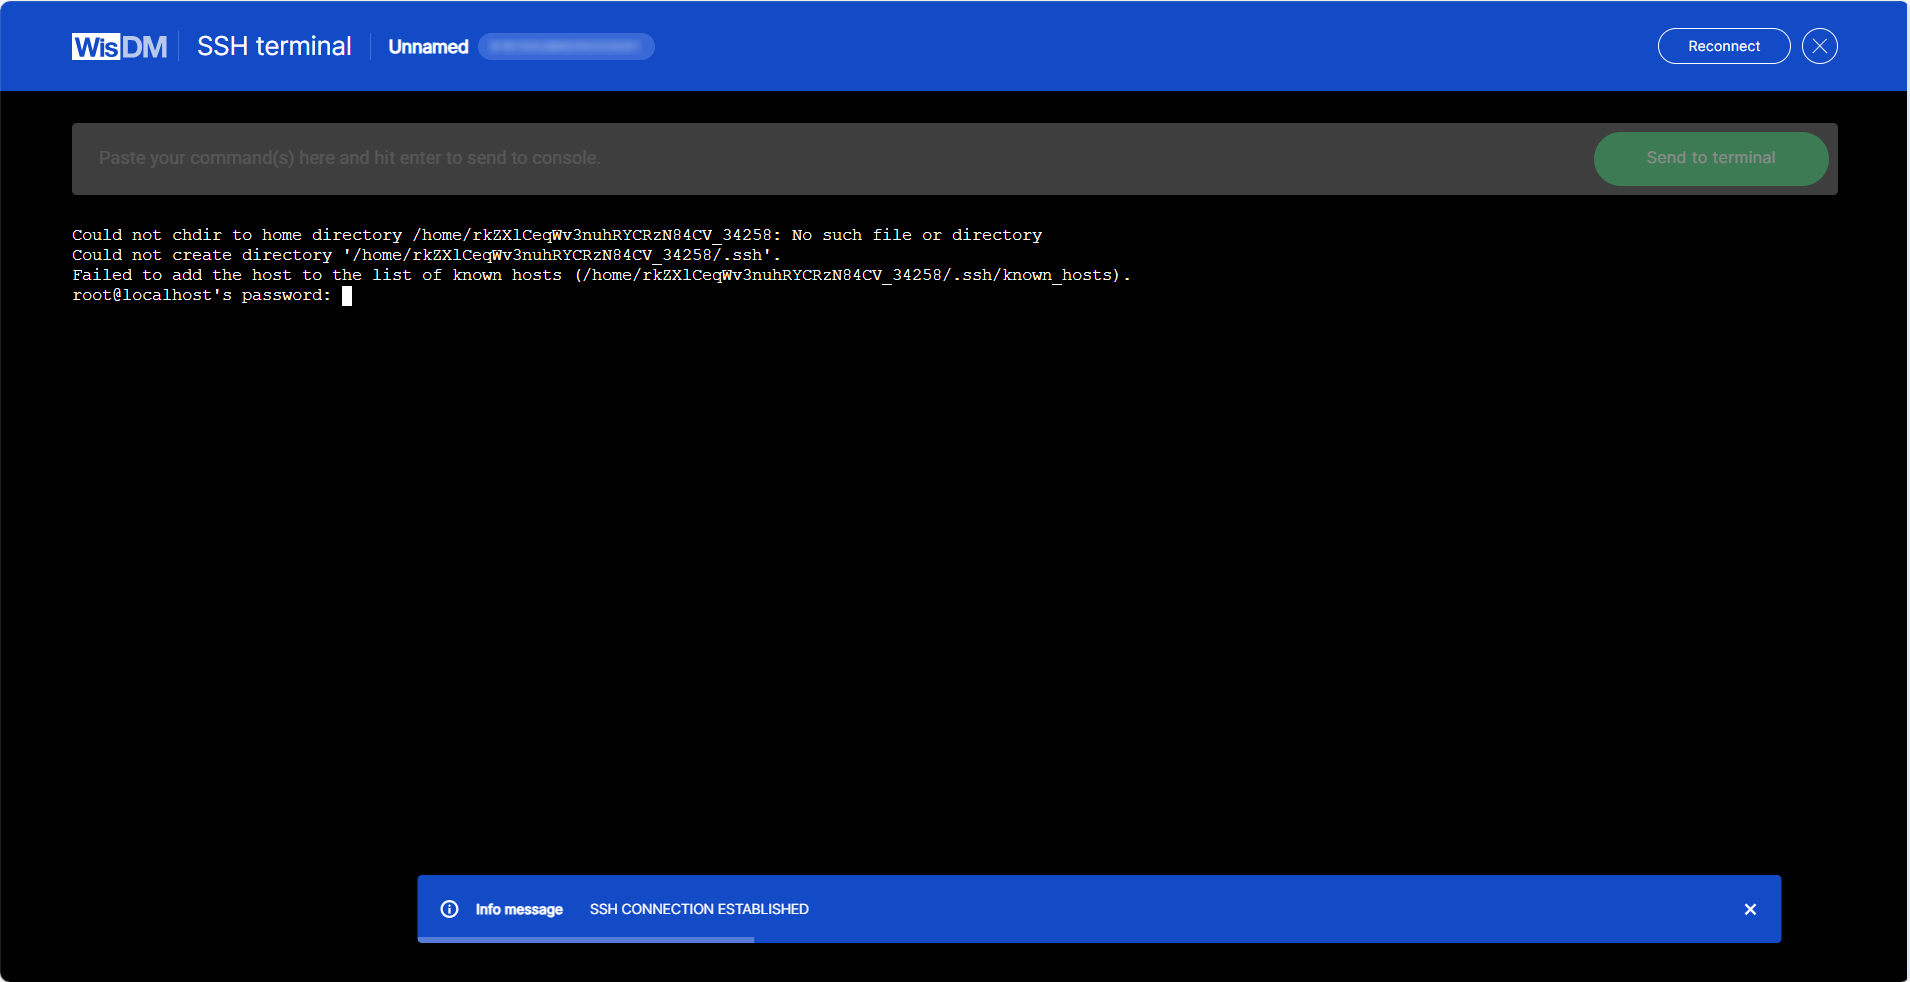 Figure 1: Open SSH Terminal
- Enter the gateway password to authenticate.
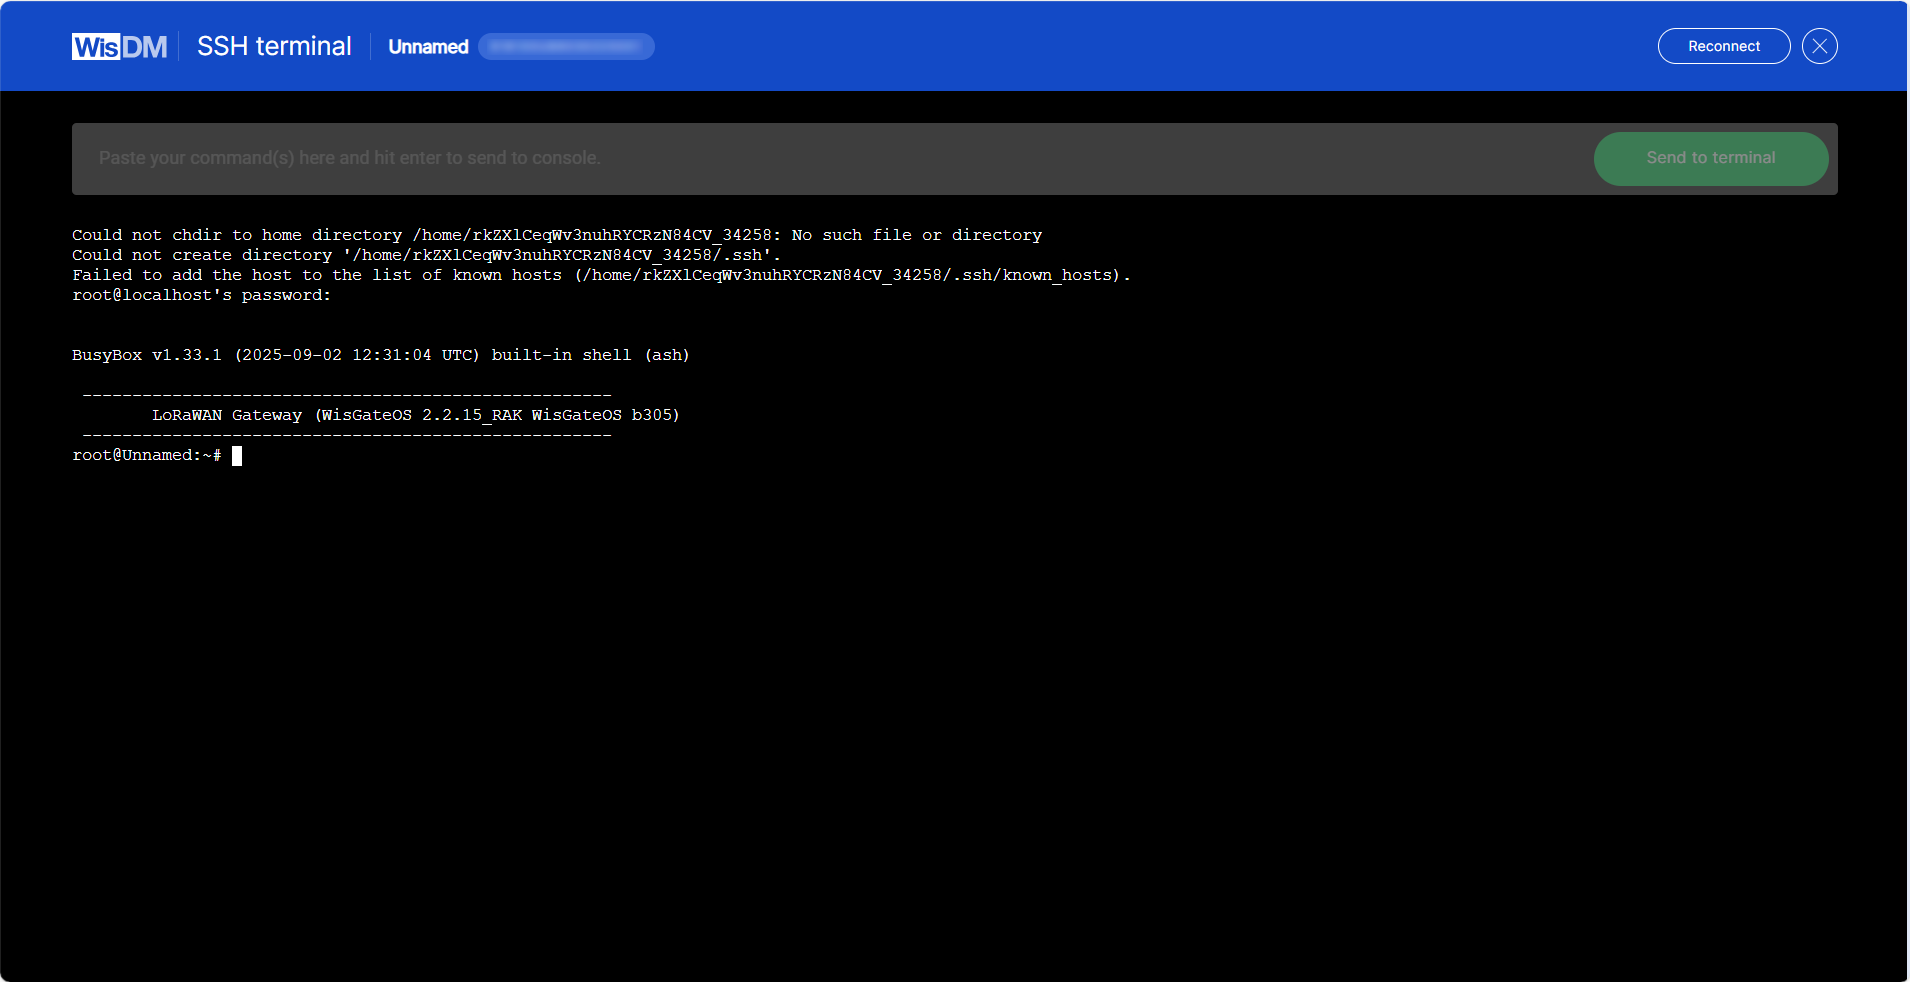 Figure 1: Log in to SSH Terminal
- After logging in, you can execute diagnostic commands, perform maintenance tasks, or run other supported Linux shell commands directly on the gateway.
If you cannot establish an SSH connection, check your firewall settings. By default, WisDM opens SSH sessions using EU IP addresses. If these IPs are not whitelisted in your firewall, the SSH session may fail.
Packet Capture
Gateway packet capture is a collection of packet entries reported by the gateway, detailing the packets it receives and transmits. This feature aids in researching and troubleshooting potential data exchange or connectivity issues in IoT networks centered around the gateway.
This feature is available only when the gateway is online.
Access Packet Capture
You can access the Packet Capture feature from two entry points:
- Gateway Overview page
Figure 1: Access from Gateway Overview- Gateway List
Figure 1: Access from Gateway ListStart a Session
-
Click Packet capture or Open packet capture.
-
Select the session duration and click Start new session.
 Figure 1: Set Session Duration
- The interface displays the list of packets transmitted and received by the gateway in real time.
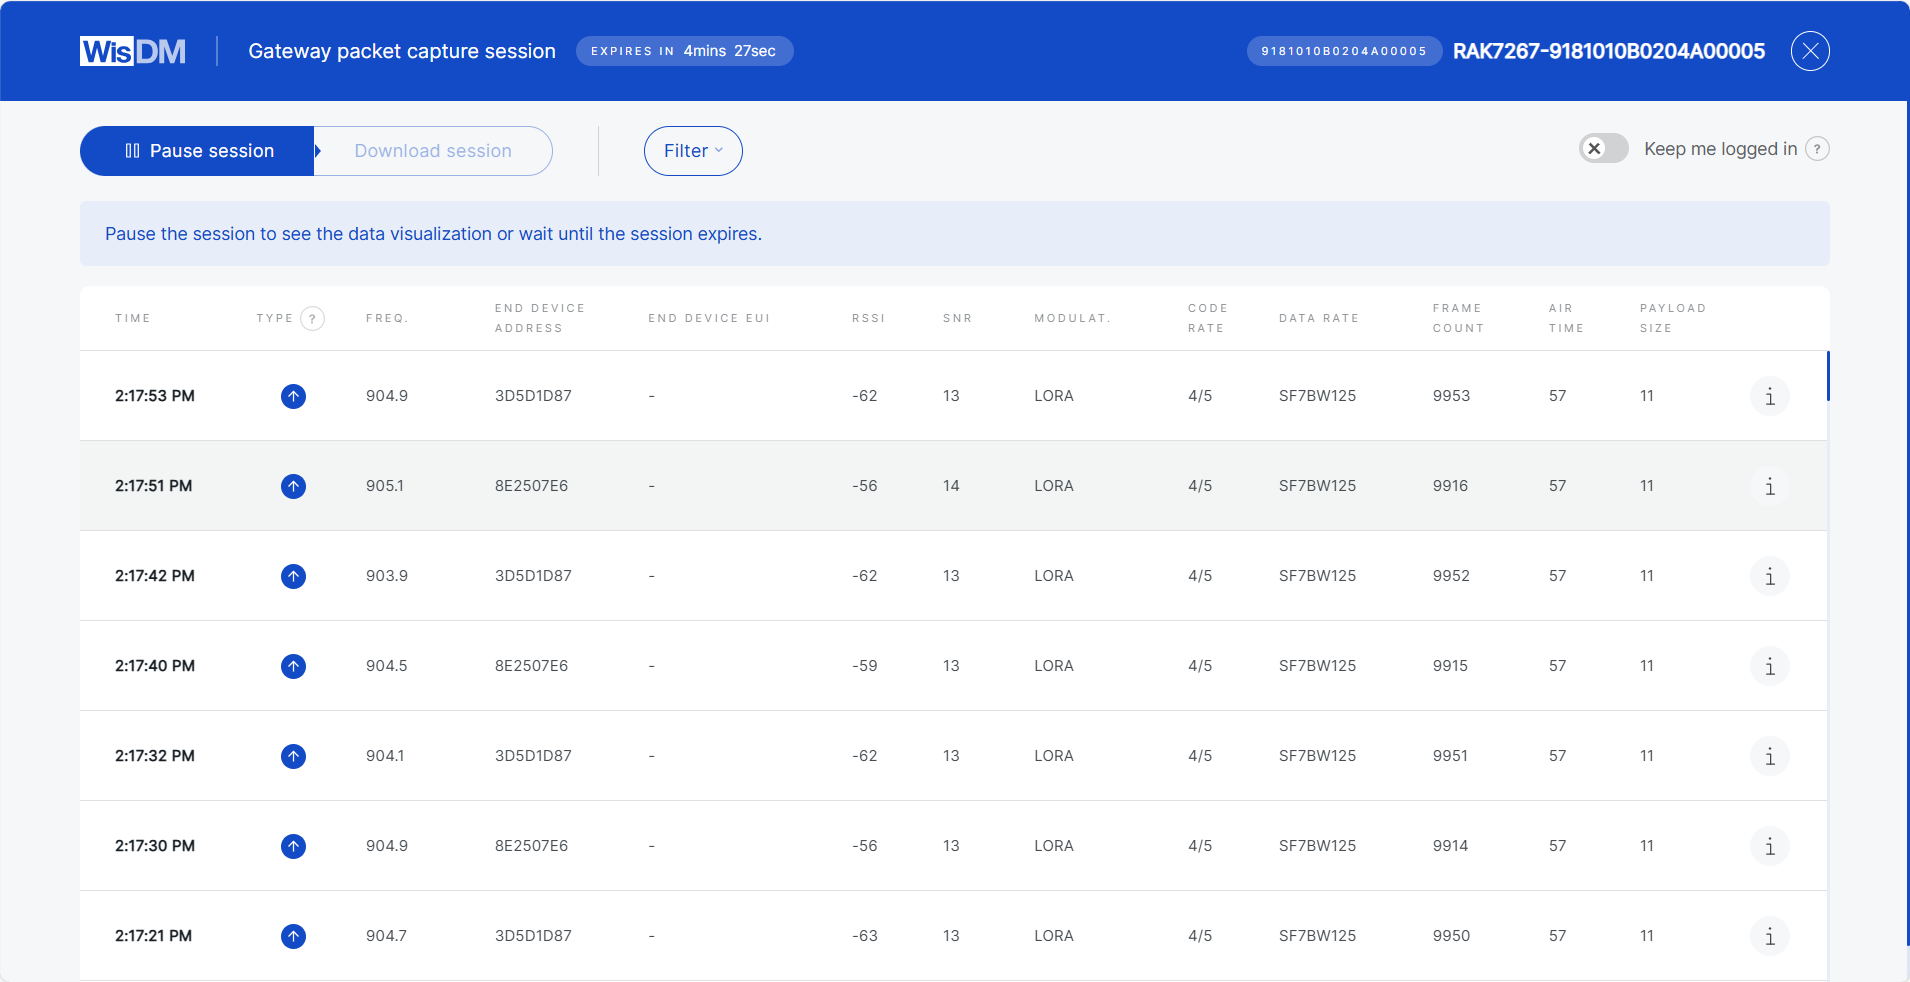 Figure 1: Packets Overview
- When the session ends, you can either start a new session with a different duration or download the captured data for further analysis.
Packet Details
When you click a packet entry in the Packet Capture session, WisDM displays detailed information about the packet. This information helps you analyze connectivity quality, packet integrity, and device activity.
 Figure 1: Packet Details
| Field | Description |
|---|---|
| Time | Timestamp of when the gateway received the packet. |
| Type | Packet type, such as Confirmed Data Up, Join Request, Join Accept. |
| Frequency | Radio frequency used for transmitting the packet. |
| End Device Address (DevAddr) | 32-bit short address of the device within the LoRaWAN® network. |
| End Device EUI (DevEUI) | A globally unique 64-bit identifier assigned to the end device by the manufacturer. |
| Application EUI (AppEUI / JoinEUI) | A globally unique identifier of the application. Used in the join procedure to associate the device with an application server. |
| RSSI | Received Signal Strength Indicator at the gateway (in dBm). Higher (closer to 0) indicate stronger signals. |
| SNR | Signal-to-Noise Ratio (in dB). Higher values indicate better signal quality. |
| Modulation | Transmission modulation type. |
| Code Rate | Forward error correction scheme applied to the transmission. |
| Data Rate | Spreading factor and bandwidth utilized in the transmission. |
| Frame Count (FCnt) | Incremental counter provided by the device, useful for detecting lost or duplicate frames. |
| Air Time | Time taken for the packet to be transmitted over the air. |
| Payload Size | Size of the packet payload in bytes. |
| CRC Status | Result of the CRC integrity check. CRC_OK indicates that the packet passed validation. |
| MAC Command | If present, shows any MAC command carried within the frame. |
| Tx Power | Transmission power level used by the end device (in dBm), if available. |
| Original Log Object | Gateway log entry formatted in JSON. |
| LoRaMAC Data Frame | Parsed LoRaWAN MAC frame. |
Additional Operations
Join Session
If the selected gateway already has an active session, you can join it for the specified duration. When joining, you may also request to load all previously captured packets from the beginning of that session.
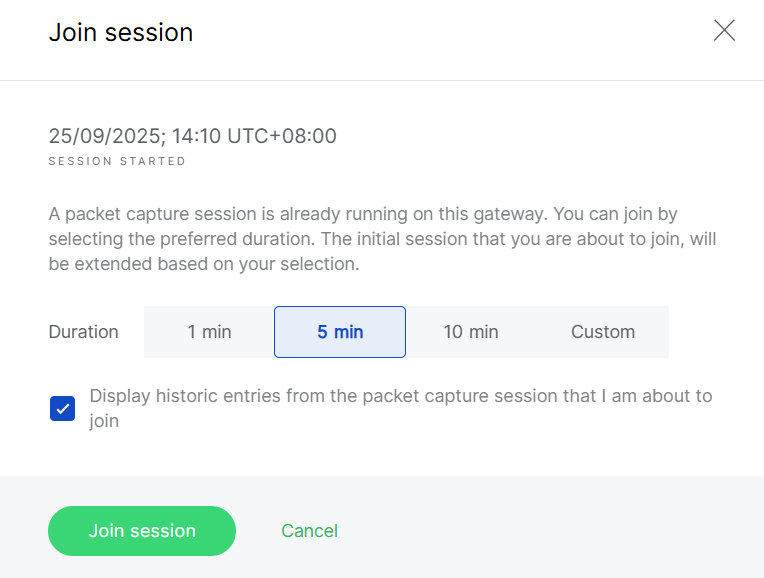 Figure 1: Join Existing Session
Pause and Resume
You can pause/resume updates at any time. While paused, you can review older packets or apply filters by packet parameters.
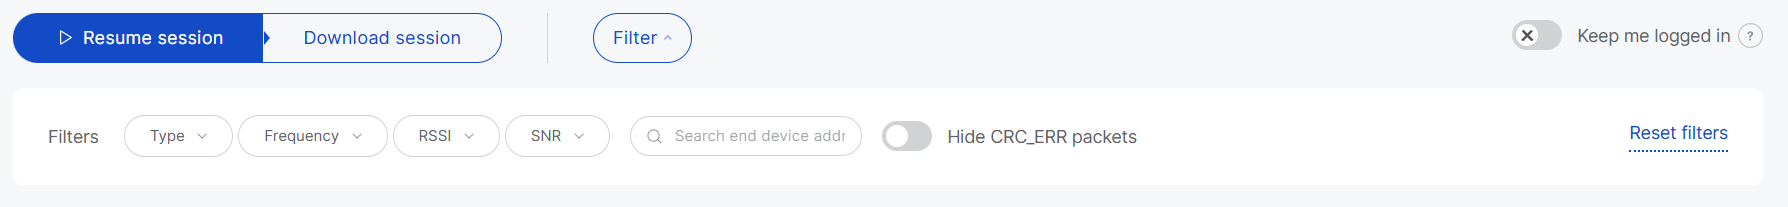 Figure 1: Pause and Resume
Packet Capture Statistics
When a packet capture session is paused or finished, WisDM generates statistics to summarize gateway and end-device activity.
 Figure 1: Packet Capture Statistics
Keep Me Logged In
For security reasons, WisDM automatically logs you out after 15 minutes of inactivity.
If your packet capture session lasts longer than 15 minutes, ensure that you enable the Keep me logged in toggle during the session to avoid interruption.