WisDM Gateway Health and Performance Statistics
This section explains how to monitor the health and performance of a specific gateway in WisDM.
Gateway monitoring information is available from two gateway-level views:
- Overview: Displays basic gateway information, current health indicators, traffic summary, location, SD card status, and system performance.
- Performance Statistics: Displays historical LoRaWAN® traffic and radio performance charts for the selected time range.
To access these views, go to Gateways, select a gateway, and open either the Overview tab or the Performance Statistics tab.
Gateway health and status information on the Overview page is synchronized from the gateway at approximately 10-minute intervals.
Gateway Overview
The Overview page provides essential information about a single gateway, including its identity, activity summary, deployment location, SD card status, and system performance.
Gateway Information
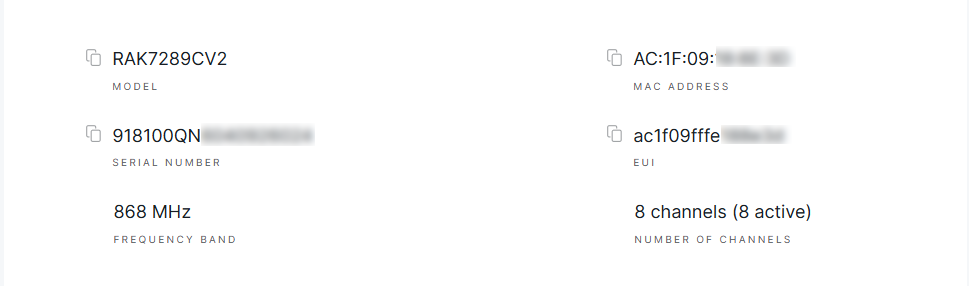 Figure 1: Device Details
- Model: The specific hardware model of the gateway (e.g., RAK7289CV2).
- EUI (Extended Unique Identifier): A globally unique identifier for the gateway, used for registration and device identification.
- MAC Address: The gateway’s network interface hardware address used for Ethernet or Wi-Fi connectivity.
- Serial Number (SN): A unique identifier assigned by the manufacturer, printed on the physical device.
- Frequency Band: The operating frequency of the gateway, inherited from the assigned LoRa Network Configuration under the gateway’s location.
- Number of LoRa Channels: The count of supported LoRa channels count (typically 8 or 16, depending on the model). The channel count determines how many simultaneous LoRaWAN connections the gateway can manage, and is a key factor in assessing its network capacity.
Traffic Statistics
This section offers a brief overview of gateway activity, highlighting the number of received packets, transmitted packets, and connected end devices. It enables you to quickly assess network load and device connectivity.
 Figure 1: Traffic Statistics
Gateway Location Display
WisDM allows you to visualize the physical location of gateways on a map. The displayed location depends on the gateway’s status and available location data.
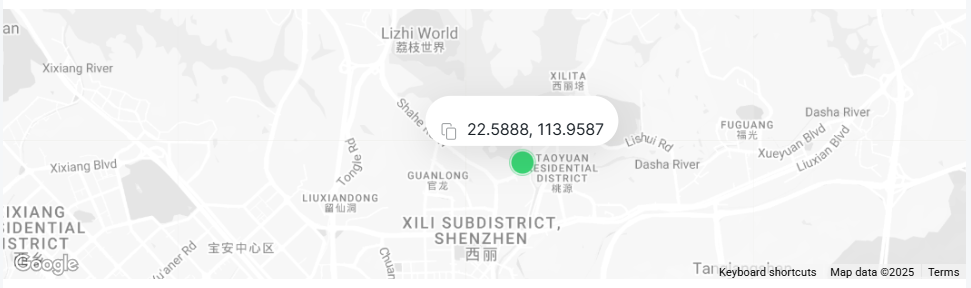 Figure 1: Gateway Deployment Location
Assigned and Online
- With GPS module – Real-time GPS coordinates are displayed on the map, refreshed approximately every 10 minutes.
- Without GPS module but with manually configured static coordinates in the gateway UI – The configured static coordinates are displayed.
- Without GPS data or manual coordinates – The system defaults to the Location Address defined in WisDM as the deployment coordinates.
Unassigned or Offline
- Offline – The map shows the last known GPS coordinates, which will not update until the gateway comes back online.
- Unassigned – Even if the gateway is online, WisDM retains and displays only the last known GPS coordinates. No further updates are collected once the gateway is removed from its Location.
SD Card Status
WisDM allows you to monitor the presence and condition of the SD card installed in the gateway.
 – SD card detected and functioning properly.
 – No SD card detected in the slot. This typically indicates that no card is inserted or that the card is loose.
 – SD card detected, but it is not functioning properly due to read/write errors.
System Performance
The System Performance section shows the current CPU, memory, and online status of the gateway. In the Performance card, click View details to see more information.
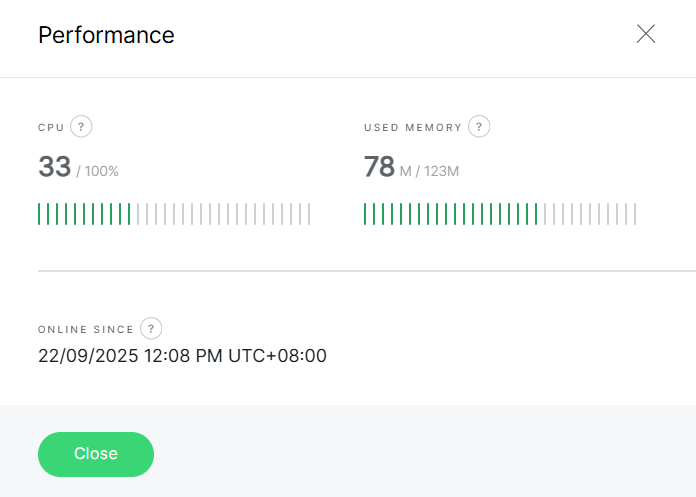 Figure 1: System Performance
-
CPU – Displays the current processing load of the gateway's CPU.
This information helps you assess the device's workload and identify potential bottlenecks. You can configure Notifications to alert you when usage reaches critical levels.
- Normal load : 0%-65%
- Medium load : 65%-80%
- High load : 80%-90%
- Critical load : 90%-100%
-
Used Memory – Shows how much system memory (RAM) is currently being used.
Useful for monitoring performance and detecting potential issues caused by memory saturation saturation, such as high traffic or logging. Notifications can be configured to alert you when usage reaches critical levels.
- Normal load : 0%-65%
- Medium load : 65%-75%
- High load : 75%-85%
- Critical load : 85%-100%
-
Online Since – Shows the time the network interface has been available and working. It may take at least 10 minutes after the last refresh to show the accurate uptime.
You can configure gateway notifications at the Organization or Location level to receive alerts when CPU or memory usage reaches critical levels.
For details, see Organization-Level Notification Settings or Location Management > Location-Level Notification Settings.
Performance Statistics
The Performance Statistics tab provides historical charts for analyzing LoRaWAN traffic and radio performance over time. It helps you monitor trends, diagnose network issues, and evaluate gateway performance within the selected time range.
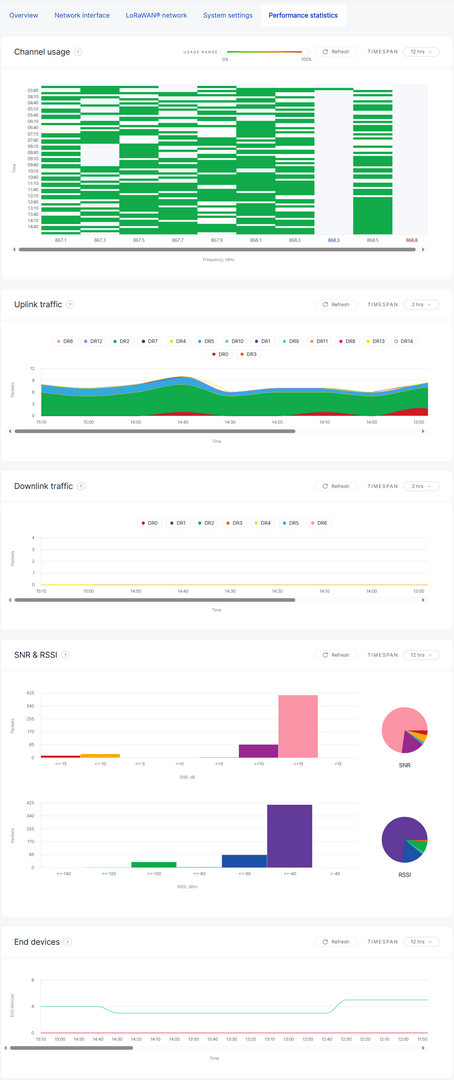 Figure 1: Performance Statistics Dashboard
Common Chart Controls
The following controls are available for the statistics charts:
| Control | Description |
|---|---|
| Timespan | Selects the time range used to display chart data, such as 4 hours or 12 hours. The selected timespan applies to the corresponding statistics chart. |
| Refresh | Refreshes the selected statistics chart to show the latest available data. |
Performance statistics are synchronized approximately every 10 minutes and are displayed based on the selected timespan. They are available only for online gateways.
Channel Usage
The Channel Usage chart shows how often each LoRa channel is occupied within the selected timespan. It helps identify channel congestion or uneven usage across frequencies.
In addition to Timespan and Refresh, this chart also provides a Usage Range filter. You can adjust the usage range to focus on channels within a specific occupancy percentage.
Uplink Traffic
The Uplink Traffic chart shows the number of uplink packets received over time, categorized by data rate (DR). This helps analyze end-device transmission behavior and traffic patterns.
Downlink Traffic
The Downlink Traffic chart shows the number of downlink packets sent to devices over time, categorized by data rate. This helps evaluate gateway-to-device communication activity.
SNR & RSSI
The SNR & RSSI charts show the radio quality and signal strength distribution of received packets.
- SNR (dB): Measures signal clarity.
- RSSI (dBm): Indicates signal strength.
End Devices
The End Devices chart shows the number of active end devices communicating with the gateway during the selected timespan.